ANNUAL REPORT PURSUANT TO SECTION 13 OR 15(d) OF THE SECURITIES EXCHANGE ACT OF 1934 |
TRANSITION REPORT PURSUANT TO SECTION 13 OR 15(d) OF THE SECURITIES EXCHANGE ACT OF 1934 |
(State or other jurisdiction of incorporation or organization) |
(I.R.S. Employer Identification No.) | |
(Address of principal executive offices) |
(Zip Code) |
Title of Each Class |
Trading Symbol |
Name of each exchange on which registered | ||
☒ |
Accelerated filer |
☐ | ||||
Non-accelerated filer |
☐ |
Smaller reporting company |
||||
Emerging growth company |
Item 1. |
Business |
• | further strengthen our legacy long-term care insurance financial and operational capabilities to address customer needs; |
• | allocate capital from Enact to drive Genworth Financial’s long-term shareholder value; and |
• | leverage our unparalleled long-term care expertise to develop innovative aging care services and solutions. |
Reinsurance |
||||
(Amounts in millions) |
recoverable |
|||
UFLIC (1) |
$ | 13,020 | ||
RGA Reinsurance Company |
2,262 | |||
General Reinsurance Corporation |
656 | |||
Riversource Life Insurance Company |
348 | |||
SCOR Global Life USA Reinsurance Company |
333 |
(1) |
We have several significant reinsurance transactions with Union Fidelity Life Insurance Company (“UFLIC”), an affiliate of General Electric Company (“GE”), which results in a significant concentration of reinsurance risk. UFLIC’s obligations to us are secured by trust accounts. See note 9 in our consolidated financial statements under “Part II—Item 8—Financial Statements and Supplementary Data” for additional details. |
Rating Agency |
Rating |
Rating categories | ||
S&P |
A- (7th highest of 21) |
AAA to D | ||
Moody’s |
A3 (7 th highest of 21) |
Aaa to C | ||
Fitch Ratings, Inc. (“Fitch”) |
A- (7th highest of 21) |
AAA to C | ||
A.M. Best |
A- (4th highest of 13) |
A++ to D |
Company |
A.M. Best rating | |
Genworth Life Insurance Company (“GLIC”) |
C++ (9 th highest of 13) | |
Genworth Life and Annuity Insurance Company (“GLAIC”) |
B- (8th highest of 13) | |
Genworth Life Insurance Company of New York (“GLICNY”) |
C++ (9 th highest of 13) |
Rating Agency |
Rating |
Rating categories | ||
S&P |
BB- (13th highest of 21) |
AAA to D | ||
Moody’s |
Ba1 (11 th highest of 21) |
Aaa to C | ||
A.M. Best |
b+ (14 th highest of 21) |
aaa to c |
• | On February 27, 2024, S&P affirmed the credit rating of “BB-” of Genworth Financial and Genworth Holdings with an outlook of stable. |
• | On January 8, 2024, S&P upgraded the financial strength rating of EMICO to “A-” from “BBB+” with an outlook of stable. |
• | On August 1, 2023, A.M. Best assigned an initial public financial strength rating of “A-” to EMICO, with an outlook of stable. |
• | On April 25, 2023, Fitch upgraded the financial strength rating of EMICO to “A-” from “BBB+” with an outlook of stable. |
• | On March 1, 2023, Moody’s upgraded the credit rating of Genworth Holdings to “Ba1” from “Ba2” and upgraded the financial strength rating of EMICO to “A3” from “Baa1.” The outlooks for the ratings are stable. |
• | On February 16, 2023, S&P upgraded the credit rating of Genworth Financial and Genworth Holdings to “BB-” from “B+” with an outlook of stable and upgraded the financial strength rating of EMICO to “BBB+” from “BBB.” |
• | managing interest rate risk, as appropriate, through monitoring asset durations relative to policyholder and contractholder obligations; |
• | selecting assets based on fundamental, research-driven strategies; |
• | emphasizing fixed-income, low-volatility assets while pursuing active strategies to enhance yield; |
• | maintaining sufficient liquidity to meet financial obligations; |
• | regularly evaluating our asset class mix and pursuing additional investment classes when prudent; and |
• | continuously monitoring asset quality and market conditions that could affect our assets. |
• | Our compensation package, including salary, bonus and long-term incentives, aligns employee and stockholder interests. In 2023, we introduced a new rewards and recognition platform that encourages our employees to recognize one another for exemplifying our values to make it human make it about others make it happen make it better |
• | In addition to a competitive compensation program, we also offer our employees benefits such as life and health insurance, paid time off, paid family leave, identity theft protection, financial planning and a retirement savings plan. |
• | To further support our employees, we continue to provide additional financial, health and wellbeing resources, as well as a flexible work schedule to allow employees additional time for self-care and the care of family members. We are currently operating under a hybrid approach organizationally, allowing flexibility to work remotely or in the office. |
• | We offer a multitude of professional development and career enrichment opportunities, including building leadership skills, professional skills training and industry-specific matters, as well as education reimbursement benefits and student loan repayment to aid career progression. |
• | Additionally, we facilitate an annual organization-wide talent management process to support career development, progression and succession planning. |
• | We are committed to fostering an inclusive work environment that encourages employees to be their authentic selves. Our executive leadership established a diversity, equity, and inclusion executive steering committee to emphasize the importance of Genworth’s diversity philosophy. We have built |
and continue to actively engage strong community connections and partnerships with diverse organizations to promote equitable opportunities and have implemented training initiatives to enhance employee inclusivity and self-awareness. |
• | We empower our employees to embrace their differences and commonalities to contribute to a culture of belonging. To help in this important work, all employees are encouraged to participate in our 13 Employee Resource Groups (“ERGs”) and Toastmasters, a communication and leadership club. These ERGs and Toastmasters are central to Genworth’s identity, driving allyship, education, resources and positive change throughout our workforce. |
• | We use our outreach platforms, including the Genworth Foundation, to extend our very purposeful impact in our communities through grants, program sponsorships, paid volunteer time for our employees and employee-directed charitable giving. We align philanthropic efforts with our primary business focus areas, our commitment to sustainability and other programs that are important to our employees. |
• | Please read our Sustainability Report to learn more about our collective accomplishments and plans to continue serving our customers, our colleagues, and our community. |
• | We are proud to embrace a future where the diversity of our associates, leadership and executives contribute to a culture of belonging and inclusion. |
• | As of December 31, 2023, we employed approximately 2,700 full-time and part-time employees globally, none of which are subject to a collective bargaining agreement. Women comprised approximately 61% of our total U.S. employee population, while 34% of our employees in the U.S. were ethnically diverse. Among people leaders in the U.S., 46% were women and 24% were ethnically diverse and for our senior management, which we designate based on internal human resource compensation levels, 32% were women and 22% were ethnically diverse. With respect to the eight members of our non-management Board of Directors, four are women and two are ethnically diverse. In addition, as of January 1, 2024, of the five senior leaders of our top business lines and our investments group, three are women and four are ethnically diverse. |
Item 1A. |
Risk Factors |
• | New lines of business or new products and services, such as those we are pursuing with CareScout, may not be successful or may subject us to additional risks. |
• | We may be required to increase our reserves as a result of deviations from our estimates and actuarial assumptions or other reasons, which could have a material adverse effect on our business, results of operations and financial condition. |
• | If the models used in our businesses are inaccurate, it could have a material adverse impact on our business, results of operations and financial condition. |
• | Our valuation of fixed maturity and equity securities uses methodologies, estimations and assumptions that are subject to change and differing interpretations which could result in changes to investment valuations that may materially adversely affect our business, results of operations and financial condition. |
• | Genworth Financial and Genworth Holdings depend on the ability of Enact Holdings and its subsidiaries to pay dividends and make other payments and distributions to each of them and to meet their obligations. |
• | Our sources of capital have become more limited, and under certain conditions we may need to seek additional capital on unfavorable terms. |
• | Adverse rating agency actions have in the past resulted in a loss of business and adversely affected our results of operations, financial condition and business, and future adverse rating actions could have a further and more significant adverse impact on us. |
• | Defaults by counterparties to our reinsurance arrangements or to derivative instruments we use to hedge our business risks, or defaults by us on agreements we have with these counterparties, may expose us to risks we sought to mitigate, which could have a material adverse effect on our business, results of operations and financial condition. |
• | Defaults or other events impacting the value of our fixed maturity securities portfolio may reduce our income. |
• | Interest rates and changes in rates, including changes in monetary policy to combat inflation, could materially adversely affect our business and profitability. |
• | A deterioration in economic conditions, a severe recession or a decline in home prices, all of which could be driven by many potential factors, may adversely affect Enact Holdings’ loss experience. |
• | Changes in accounting and reporting standards issued by the Financial Accounting Standards Board or other standard-setting bodies and insurance regulators could materially adversely affect our business, financial condition and results of operations. |
• | The inability to obtain in-force rate action increases (including increased premiums and associated benefit reductions) in our long-term care insurance business could have a material adverse impact on our business, including our results of operations and financial condition. |
• | Our insurance businesses are extensively regulated and changes in regulation may reduce our profitability and limit our growth. |
• | Litigation and regulatory investigations or other actions are common in the insurance business and may result in financial losses and harm our reputation. |
• | An adverse change in the regulatory requirements on our U.S. life insurance subsidiaries, including risk-based capital requirements, could have a material adverse impact on our business, results of operations and financial condition. |
• | Changes to the role of the GSEs or to the charters or business practices of the GSEs, including actions or decisions to decrease or discontinue the use of mortgage insurance, could adversely affect our business, financial condition and results of operations. |
• | If Enact is unable to continue to meet the requirements mandated by PMIERs because the GSEs amend them or the GSEs’ interpretation of the financial requirements requires Enact to hold amounts of capital that are higher than planned or otherwise, Enact may not be eligible to write new insurance on loans acquired by the GSEs, which would have a material adverse effect on our business, results of operations and financial condition. |
• | Enact Holdings’ U.S. mortgage insurance subsidiaries are subject to minimum statutory capital requirements, which if not met or waived, would result in restrictions or prohibitions on them doing business and could have a material adverse impact on our business, financial condition and results of operations. |
• | Changes in regulations that adversely affect the mortgage insurance markets in which Enact Holdings operates could affect its operations significantly and could reduce the demand for mortgage insurance. |
• | Our U.S. life insurance subsidiaries may not be able to continue to mitigate the impact of Regulations XXX or AXXX and, therefore, they may incur higher operating costs that could have a material adverse effect on our business, financial condition and results of operations. |
• | If we are unable to retain, attract and motivate qualified employees or senior management, our results of operations, financial condition and business operations may be adversely impacted. |
• | Enact Holdings’ reliance on key customers or distribution relationships could cause a loss of significant sales if one or more of those relationships terminate or are reduced. |
• | Our businesses could be adversely impacted from deficiencies in our disclosure controls and procedures or internal control over financial reporting. |
• | Our computer systems and those of our third-party service providers have in the past and may in the future fail or be compromised, including through cybersecurity breaches; we may experience issues from new and complex information technology methodologies such as artificial intelligence; and unanticipated problems could materially adversely impact our disaster recovery systems and business continuity plans, any of which could damage our reputation, impair our ability to conduct business effectively, result in enforcement action or litigation, and materially adversely affect our business, financial condition and results of operations. |
• | We rely upon third-party vendors who may be unable or unwilling to meet their obligations to us. |
• | Enact Holdings may be unable to maintain or increase capital in its mortgage insurance subsidiaries in a timely manner, on anticipated terms or at all, including through improved business performance, reinsurance or similar transactions, securities offerings or otherwise, in each case as and when required. |
• | Reinsurance may not be available, affordable or adequate to protect us against losses. |
• | A decrease in the volume of high loan-to-value |
• | The amount of mortgage insurance written by Enact Holdings could decline significantly if alternatives to private mortgage insurance are used or lower coverage levels of mortgage insurance are selected. |
• | Enact Holdings’ delegated underwriting program may subject its mortgage insurance subsidiaries to unanticipated claims. |
• | Medical advances, such as genetic research and diagnostic imaging, emerging new technology, including artificial intelligence and related legislation, could materially adversely affect the financial performance of our life insurance, long-term care insurance and annuity businesses. |
• | Other emerging risks, such as the occurrence of natural or man-made disasters, including geopolitical tensions and war; a public health emergency, including pandemics; climate change; or unknown risks and uncertainties associated with artificial intelligence could materially adversely affect our business, financial condition and results of operations. |
• | ceasing and/or reducing new sales of our products or limiting the business opportunities we are presented with; |
• | adversely affecting our relationships with distributors, including the loss of exclusivity under certain agreements with our independent sales intermediaries and distribution partners; |
• | causing us to lose key distributors that have ratings requirements that we may no longer satisfy (or resulting in our renegotiation of new, less favorable arrangements with those distributors); |
• | requiring us to modify some of our existing products or services to remain competitive, including reducing premiums we charge, or introduce new products or services; |
• | materially increasing the number or amount of policy surrenders, withdrawals and loans by contractholders and policyholders; |
• | requiring us to post additional collateral for our derivatives or hedging agreements tied to the credit ratings of our holding companies; |
• | requiring us to provide support, or to arrange for third-party support, in the form of collateral, capital contributions or letters of credit under the terms of certain of our reinsurance and other agreements, or otherwise securing our commercial counterparties for the perceived risk of our financial strength; |
• | adversely affecting our ability to maintain reinsurance or obtain new reinsurance or obtain it on reasonable pricing and other terms; |
• | increasing the capital charge associated with affiliated investments within certain of our U.S. life insurance subsidiaries thereby lowering capital and RBC of these subsidiaries and negatively impacting our financial flexibility; |
• | regulators requiring certain of our subsidiaries to maintain additional capital, limiting thereby our financial flexibility and requiring us to raise additional capital; |
• | adversely affecting our ability to raise capital; |
• | increased scrutiny by the GSEs and/or by customers, potentially resulting in a decrease in the amount of new insurance written; |
• | increasing our cost of borrowing and making it more difficult to borrow in the public debt markets or enter into a credit agreement; and |
• | making it more difficult to execute on CareScout initiatives. |
• | licensing companies and agents to transact business; |
• | calculating the value of assets and determining the eligibility of assets to determine compliance with statutory requirements; |
• | mandating certain insurance benefits; |
• | regulating certain premium rates; |
• | reviewing and approving policy forms; |
• | regulating discrimination in pricing, coverage terms and other insurance practices, as well as unfair trade and claims practices, including through the imposition of restrictions on marketing and sales practices, distribution arrangements and payment of inducements; |
• | establishing and revising statutory capital and reserve requirements and solvency standards; |
• | fixing maximum interest rates on insurance policy loans and minimum rates for guaranteed crediting rates on life insurance policies and annuity contracts; |
• | approving premium increases and associated benefit reductions; |
• | evaluating enterprise risk to an insurer; |
• | approving changes in control of insurance companies; |
• | restricting the payment of dividends and other transactions between affiliates; |
• | regulating the types, amounts and valuation of investments; |
• | restricting the types of insurance products that may be offered; and |
• | imposing insurance eligibility criteria. |
• | an increase in home mortgage interest rates; |
• | limitations on the tax benefits of homeownership and mortgage interest; |
• | implementation of more rigorous mortgage lending regulation; |
• | a decline in economic conditions generally, or in conditions in regional and local economies; |
• | events outside of Enact Holdings’ control, including natural and man-made disasters and pandemics adversely affecting housing markets and home buying; |
• | the level of consumer confidence, which may be adversely affected by economic instability, war or terrorist events; |
• | an increase in the price of homes relative to income levels; |
• | a lack of housing supply at lower home prices; |
• | adverse population trends, including lower homeownership rates; |
• | high rates of home price appreciation, which for refinancings affect whether refinanced loans have loan-to-value |
• | changes in government housing policy encouraging loans to first-time home buyers. |
• | declining interest rates, which may result in the refinancing of the mortgages underlying the insurance policies with new mortgage loans that may not require mortgage insurance or that Enact Holdings does not insure; |
• | customer concentration levels with certain customers that actively market refinancing opportunities to their existing borrowers; |
• | significant appreciation in the value of homes, which causes the unpaid balance of the mortgage to decrease below 80% of the value of the home and enables the borrower to request cancellation of the mortgage insurance; and |
• | changes in mortgage insurance cancellation requirements or procedures of the GSEs or under applicable law. |
• | originating mortgages that consist of two simultaneous loans, known as “simultaneous seconds,” comprising a first mortgage with a loan-to-value loan-to-value |
• | using government mortgage insurance programs; |
• | holding mortgages in the lenders’ own loan portfolios and self-insuring; |
• | using programs, such as those offered by Fannie Mae and Freddie Mac in the United States, requiring lower mortgage insurance coverage levels; |
• | originating and securitizing loans in mortgage-backed securities whose underlying mortgages are not insured with private mortgage insurance or which are structured so that the risk of default lies with the investor, rather than a private mortgage insurer; and |
• | using risk-sharing insurance programs, credit default swaps or similar instruments, instead of private mortgage insurance, to transfer credit risk on mortgages. |
Item 1B. |
Unresolved Staff Comments |
Item 1C. |
Cybersecurity |
Item 2. |
Properties |
Item 3. |
Legal Proceedings |
Item 4. |
Mine Safety Disclosures |
Item 5. |
Market for Registrant’s Common Equity, Related Stockholder Matters and Issuer Purchases of Equity Securities |
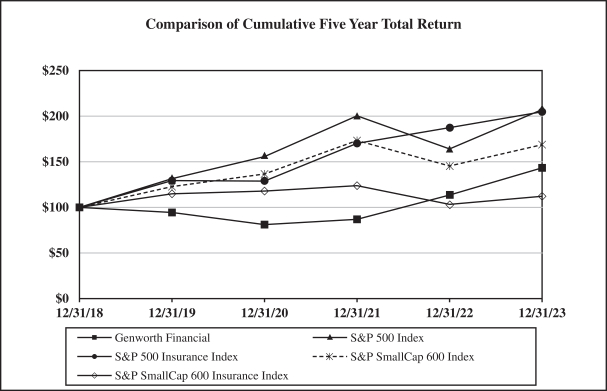
2018 |
2019 |
2020 |
2021 |
2022 |
2023 |
|||||||||||||||||||
Genworth Financial, Inc. |
$ | 100.00 | $ | 94.42 | $ | 81.12 | $ | 86.91 | $ | 113.52 | $ | 143.35 | ||||||||||||
S&P 500 ® |
$ | 100.00 | $ | 131.49 | $ | 155.68 | $ | 200.37 | $ | 164.08 | $ | 207.21 | ||||||||||||
S&P 500 Insurance Index |
$ | 100.00 | $ | 129.38 | $ | 128.81 | $ | 170.19 | $ | 187.42 | $ | 204.78 | ||||||||||||
S&P SmallCap 600 Index |
$ | 100.00 | $ | 122.78 | $ | 136.64 | $ | 173.29 | $ | 145.39 | $ | 168.73 | ||||||||||||
S&P SmallCap 600 Insurance Index |
$ | 100.00 | $ | 114.89 | $ | 117.89 | $ | 123.81 | $ | 103.30 | $ | 112.17 |
(Dollar amounts in millions, except per share amounts) |
Total number of shares purchased |
Average price paid per share |
Total number of shares purchased as part of publicly announced program |
Approximate dollar amount of shares that may yet be purchased under the program (1) |
||||||||||||
October 1, 2023 through October 31, 2023 |
1,717,825 | $ | 5.82 | 1,717,825 | $ | 366 | ||||||||||
November 1, 2023 through November 30, 2023 |
2,581,077 | $ | 5.81 | 2,581,077 | $ | 351 | ||||||||||
December 1, 2023 through December 31, 2023 |
1,600,446 | $ | 6.14 | 1,600,446 | $ | 341 | ||||||||||
Total |
5,899,348 | 5,899,348 | ||||||||||||||
(1) |
On May 2, 2022, Genworth Financial’s Board of Directors authorized a share repurchase program under which Genworth Financial could repurchase up to $350 million of its outstanding Class A common stock. On July 31, 2023, Genworth Financial’s Board of Directors authorized an additional $350 million of share repurchases under the existing share repurchase program. Under the program, share repurchases may be made at the Company’s discretion from time to time in open market transactions, privately negotiated transactions, or other means, including through Rule 10b5-1 trading plans. The timing and number of future shares repurchased under the program will depend on a variety of factors, including Genworth Financial’s stock price and trading volume, and general business and market conditions, among other factors. The authorization has no expiration date and may be modified, suspended or terminated at any time. For additional information on the share repurchase program, see “Item 7—Management’s Discussion and Analysis of Financial Condition and Results of Operations—Liquidity and Capital Resources.” |
Item 6. |
Reserved |
Item 7. |
Management’s Discussion and Analysis of Financial Condition and Results of Operations |
• | Premiums. |
• | Net investment income. |
• | Net investment gains (losses). |
• | Policy fees and other income. |
• | Benefits and other changes in policy reserves. |
• | Liability remeasurement (gains) losses. |
• | Changes in fair value of market risk benefits and associated hedges. non-qualified derivative instruments associated with our market risk benefits. |
• | Interest credited. |
• | Acquisition and operating expenses, net of deferrals. |
• | Amortization of deferred acquisition costs and intangibles. |
• | Interest expense. |
• | Provision (benefit) for income taxes. |
• | Net income from continuing operations attributable to noncontrolling interests. |
Years ended December 31, |
Increase (decrease) and percentage change |
|||||||||||||||||||||||||||
(Amounts in millions) |
2023 |
2022 |
2021 |
2023 vs. 2022 |
2022 vs. 2021 |
|||||||||||||||||||||||
Revenues: |
||||||||||||||||||||||||||||
Premiums |
$ | 3,636 | $ | 3,680 | $ | 3,406 | $ | (44 | ) | (1 | )% | $ | 274 | 8 | % | |||||||||||||
Net investment income |
3,183 | 3,146 | 3,370 | 37 | 1 | % | (224 | ) | (7 | )% | ||||||||||||||||||
Net investment gains (losses) |
23 | (2 | ) | 322 | 25 | NM | (1) |
(324 | ) | (101 | )% | |||||||||||||||||
Policy fees and other income |
646 | 671 | 724 | (25 | ) | (4 | )% | (53 | ) | (7 | )% | |||||||||||||||||
Total revenues |
7,488 | 7,495 | 7,822 | (7 | ) | — | % | (327 | ) | (4 | )% | |||||||||||||||||
Benefits and expenses: |
||||||||||||||||||||||||||||
Benefits and other changes in policy reserves |
4,783 | 4,303 | 4,575 | 480 | 11 | % | (272 | ) | (6 | )% | ||||||||||||||||||
Liability remeasurement (gains) losses |
587 | (290 | ) | 242 | 877 | NM | (1) |
(532 | ) | NM | (1) | |||||||||||||||||
Changes in fair value of market risk benefits and associated hedges |
(12 | ) | (104 | ) | (160 | ) | 92 | 88 | % | 56 | 35 | % | ||||||||||||||||
Interest credited |
503 | 504 | 511 | (1 | ) | — | % | (7 | ) | (1 | )% | |||||||||||||||||
Acquisition and operating expenses, net of deferrals |
942 | 1,285 | 998 | (343 | ) | (27 | )% | 287 | 29 | % | ||||||||||||||||||
Amortization of deferred acquisition costs and intangibles |
264 | 326 | 384 | (62 | ) | (19 | )% | (58 | ) | (15 | )% | |||||||||||||||||
Interest expense |
118 | 106 | 160 | 12 | 11 | % | (54 | ) | (34 | )% | ||||||||||||||||||
Total benefits and expenses |
7,185 | 6,130 | 6,710 | 1,055 | 17 | % | (580 | ) | (9 | )% | ||||||||||||||||||
Income from continuing operations before income taxes |
303 | 1,365 | 1,112 | (1,062 | ) | (78 | )% | 253 | 23 | % | ||||||||||||||||||
Provision for income taxes |
104 | 319 | 248 | (215 | ) | (67 | )% | 71 | 29 | % | ||||||||||||||||||
Income from continuing operations |
199 | 1,046 | 864 | (847 | ) | (81 | )% | 182 | 21 | % | ||||||||||||||||||
Income from discontinued operations, net of taxes |
— | — | 27 | — | — | % | (27 | ) | (100 | )% | ||||||||||||||||||
Net income |
199 | 1,046 | 891 | (847 | ) | (81 | )% | 155 | 17 | % | ||||||||||||||||||
Less: net income from continuing operations attributable to noncontrolling interests |
123 | 130 | 33 | (7 | ) | (5 | )% | 97 | NM | (1) | ||||||||||||||||||
Less: net income from discontinued operations attributable to noncontrolling interests |
— | — | 8 | — | — | % | (8 | ) | (100 | )% | ||||||||||||||||||
Net income available to Genworth Financial, Inc.’s common stockholders |
$ | 76 | $ | 916 | $ | 850 | $ | (840 | ) | (92 | )% | $ | 66 | 8 | % | |||||||||||||
Net income available to Genworth Financial, Inc.’s common stockholders: |
||||||||||||||||||||||||||||
Income from continuing operations available to Genworth Financial, Inc.’s common stockholders |
$ | 76 | $ | 916 | $ | 831 | $ | (840 | ) | (92 | )% | $ | 85 | 10 | % | |||||||||||||
Income from discontinued operations available to Genworth Financial, Inc.’s common stockholders |
— | — | 19 | — | — | % | (19 | ) | (100 | )% | ||||||||||||||||||
Net income available to Genworth Financial, Inc.’s common stockholders |
$ | 76 | $ | 916 | $ | 850 | $ | (840 | ) | (92 | )% | $ | 66 | 8 | % | |||||||||||||
(1) |
We define “NM” as not meaningful for increases or decreases greater than 200%. |
(Amounts in millions) |
2023 |
2022 |
2021 |
|||||||||
Net income available to Genworth Financial, Inc.’s common stockholders |
$ | 76 | $ | 916 | $ | 850 | ||||||
Add: net income from continuing operations attributable to noncontrolling interests |
123 | 130 | 33 | |||||||||
Add: net income from discontinued operations attributable to noncontrolling interests |
— | — | 8 | |||||||||
Net income |
199 | 1,046 | 891 | |||||||||
Less: income from discontinued operations, net of taxes |
— | — | 27 | |||||||||
Income from continuing operations |
199 | 1,046 | 864 | |||||||||
Less: net income from continuing operations attributable to noncontrolling interests |
123 | 130 | 33 | |||||||||
Income from continuing operations available to Genworth Financial, Inc.’s common stockholders |
76 | 916 | 831 | |||||||||
Adjustments to income from continuing operations available to Genworth Financial, Inc.’s common stockholders: |
||||||||||||
Net investment (gains) losses, net (1) |
(25 | ) | 2 | (322 | ) | |||||||
Changes in fair value of market risk benefits attributable to interest rates, equity markets and associated hedges (2) |
(22 | ) | (142 | ) | (210 | ) | ||||||
(Gains) losses on early extinguishment of debt (3) |
(2 | ) | 6 | 45 | ||||||||
Expenses related to restructuring |
4 | 2 | 34 | |||||||||
Pension plan termination costs |
— | 8 | — | |||||||||
Taxes on adjustments |
10 | 26 | 96 | |||||||||
Adjusted operating income available to Genworth Financial, Inc.’s common stockholders |
$ | 41 | $ | 818 | $ | 474 | ||||||
(1) |
For the year ended December 31, 2023, net investment (gains) losses were adjusted for the portion attributable to noncontrolling interests of $2 million. |
(2) |
Changes in fair value of market risk benefits and associated hedges were adjusted to exclude changes in reserves, attributed fees and benefit payments of $(10) million, $(38) million and $(50) million for the years ended December 31, 2023, 2022 and 2021, respectively. |
(3) |
See note 17 in our consolidated financial statements under “Part II—Item 8—Financial Statements and Supplementary Data” for additional information on (gains) losses on early extinguishment of debt during 2023 and 2022. During 2021, we paid pre-tax make-whole premiums of $26 million and incurred pre-tax losses of $19 million in connection with the early redemption and repurchase of certain of Genworth Holdings’ senior notes. |
Years ended December 31, |
Increase (decrease) and percentage change |
|||||||||||||||||||||||||||
(Amounts in millions, except per share amounts) |
2023 |
2022 |
2021 |
2023 vs. 2022 |
2022 vs. 2021 |
|||||||||||||||||||||||
Income from continuing operations available to Genworth Financial, Inc.’s common stockholders per share: |
||||||||||||||||||||||||||||
Basic |
$ | 0.16 | $ | 1.82 | $ | 1.64 | $ | (1.66 | ) | (91 | )% | $ | 0.18 | 11 | % | |||||||||||||
Diluted |
$ | 0.16 | $ | 1.79 | $ | 1.61 | $ | (1.63 | ) | (91 | )% | $ | 0.18 | 11 | % | |||||||||||||
Net income available to Genworth Financial, Inc.’s common stockholders per share: |
||||||||||||||||||||||||||||
Basic |
$ | 0.16 | $ | 1.82 | $ | 1.68 | $ | (1.66 | ) | (91 | )% | $ | 0.14 | 8 | % | |||||||||||||
Diluted |
$ | 0.16 | $ | 1.79 | $ | 1.65 | $ | (1.63 | ) | (91 | )% | $ | 0.14 | 8 | % | |||||||||||||
Adjusted operating income available to Genworth Financial, Inc.’s common stockholders per share: |
||||||||||||||||||||||||||||
Basic |
$ | 0.09 | $ | 1.62 | $ | 0.93 | $ | (1.53 | ) | (94 | )% | $ | 0.69 | 74 | % | |||||||||||||
Diluted |
$ | 0.09 | $ | 1.60 | $ | 0.92 | $ | (1.51 | ) | (94 | )% | $ | 0.68 | 74 | % | |||||||||||||
Weighted-average common shares outstanding: |
||||||||||||||||||||||||||||
Basic |
468.8 | 504.4 | 506.9 | |||||||||||||||||||||||||
Diluted |
474.9 | 510.9 | 514.7 | |||||||||||||||||||||||||
Years ended December 31, |
Increase (decrease) and percentage change |
|||||||||||||||||||||||||||
(Amounts in millions) |
2023 |
2022 |
2021 |
2023 vs. 2022 |
2022 vs. 2021 |
|||||||||||||||||||||||
Adjusted operating income (loss) available to Genworth Financial, Inc.’s common stockholders: |
||||||||||||||||||||||||||||
Enact segment |
$ | 552 | $ | 578 | $ | 520 | $ | (26 | ) | (4 | )% | $ | 58 | 11 | % | |||||||||||||
Long-Term Care Insurance segment |
(242 | ) | 320 | 126 | (562 | ) | (176 | )% | 194 | 154 | % | |||||||||||||||||
Life and Annuities segment: |
||||||||||||||||||||||||||||
Life insurance |
(275 | ) | (111 | ) | (201 | ) | (164 | ) | (148 | )% | 90 | 45 | % | |||||||||||||||
Fixed annuities |
50 | 62 | 83 | (12 | ) | (19 | )% | (21 | ) | (25 | )% | |||||||||||||||||
Variable annuities |
37 | 21 | 22 | 16 | 76 | % | (1 | ) | (5 | )% | ||||||||||||||||||
Life and Annuities segment |
(188 | ) | (28 | ) | (96 | ) | (160 | ) | NM | (1) |
68 | 71 | % | |||||||||||||||
Corporate and Other |
(81 | ) | (52 | ) | (76 | ) | (29 | ) | (56 | )% | 24 | 32 | % | |||||||||||||||
Adjusted operating income available to Genworth Financial, Inc.’s common stockholders |
$ | 41 | $ | 818 | $ | 474 | $ | (777 | ) | (95 | )% | $ | 344 | 73 | % | |||||||||||||
(1) |
We define “NM” as not meaningful for increases or decreases greater than 200%. |
• | Net income in 2023 and 2022 was $76 million and $916 million, respectively, and adjusted operating income was $41 million and $818 million, respectively. Adjusted operating income (loss) highlights were as follows: |
• | Enact segment |
• | Adjusted operating income decreased primarily attributable to higher losses on new delinquencies and lower favorable reserve adjustments, partially offset by higher net investment income, higher premiums and lower operating costs in 2023. |
• | Long-Term Care Insurance segment |
• | The change to an adjusted operating loss in 2023 from adjusted operating income in 2022 was largely driven by unfavorable cash flow assumption updates in 2023 compared to favorable updates in 2022. |
• | The change was also driven by adverse actual versus expected experience in 2023 primarily related to higher claims and unfavorable timing impacts related to a legal settlement. |
• | We also experienced higher operating costs and lower premiums in 2023. |
• | Life and Annuities segment |
• | Life insurance: |
• | The adjusted operating loss increased largely from $179 million of unfavorable updates to our persistency and mortality assumptions, as well as lower premiums reflecting runoff of our in-force blocks in 2023. |
• | These adverse developments were partially offset by lower DAC amortization related to higher lapses in 2022 and a $20 million legal settlement expense in 2022 that did not recur. |
• | Fixed annuities: |
• | Adjusted operating income decreased mainly attributable to lower net spreads primarily related to block runoff, partially offset by favorable mortality experience in 2023. |
• | Variable annuities: |
• | Adjusted operating income increased predominantly due to aging of our in-force block, partially offset by a decrease in fee income driven by lower account value in 2023. |
• | Corporate and Other |
• | The adjusted operating loss increased primarily from higher expenses related to CareScout growth initiatives and higher interest expense attributable to Genworth Holdings’ junior subordinated notes, partially offset by higher net investment income in 2023. |
• | Net income in 2022 and 2021 was $916 million and $850 million, respectively, and adjusted operating income was $818 million and $474 million, respectively. Adjusted operating income (loss) highlights were as follows: |
• | Enact segment |
• | Adjusted operating income increased primarily attributable to lower losses largely driven by net favorable reserve adjustments of $212 million, consisting of reserve releases of $248 million primarily related to COVID-19 delinquencies from 2020 and 2021 curing at levels above original reserve expectations, partially offset by reserve strengthening of $36 million related to 2022 delinquencies given uncertainty in the economic environment. |
• | This improvement was partially offset by the minority initial public offering of Enact Holdings that closed in September 2021, which reduced Genworth Financial’s ownership percentage to 81.6%. |
• | The improvement was also partially offset by lower premiums in 2022. |
• | Long-Term Care Insurance segment |
• | Adjusted operating income increased largely driven by favorable cash flow assumption updates reflecting an expected reserve reduction, net of estimated settlement payments, attributable to the inclusion of a legal settlement, partially offset by lower net investment income in 2022. |
• | Life and Annuities segment |
• | Life insurance: |
• | The adjusted operating loss decreased largely from favorable cash flow assumption updates in our universal and term universal life insurance products in 2022 related to higher interest rates compared to unfavorable cash flow assumption updates in 2021 primarily driven by unfavorable pre-COVID-19 |
• | The decrease was also attributable to lower DAC amortization primarily driven by lapse experience in our term life insurance products. |
• | Fixed annuities: |
• | Adjusted operating income decreased mainly attributable to lower net spreads primarily related to block runoff, partially offset by favorable mortality in 2022. |
• | Corporate and Other |
• | The adjusted operating loss decreased primarily related to lower interest expense in 2022, partially offset by tax benefits of $21 million in 2021 from a reduction in uncertain tax positions due to the expiration of certain statute of limitations that did not recur. |
• | Mortgage insurance portfolio in-force growth in 2023. New insurance written decreased 20% during 2023 compared to 2022 mostly from a decline in originations due to elevated interest rates. |
• | Loss performance. pre-tax reserve releases of $241 million in 2023 primarily related to favorable cure performance on 2022 and prior delinquencies, including those related to COVID-19. New primary delinquencies in 2023 increased compared to 2022 largely due to the aging of large, new books of business. |
• | Capital |
• | Capital returns |
• | In-force rate actions.in-force rate action plan from 2012 through 2023 was approximately $28.0 billion, on a net present value basis, which includes our current updated assumptions regarding future premiums and benefit reductions from approved rate actions and legal settlements as described in “Results of Operations and Selected Financial and Operating Performance Measures by Segment.” This estimated cumulative economic benefit reflects progress of approximately 84% toward our latest estimate of approximately $33.3 billion total net present value of premium increases and benefit reductions contemplated in our multi-year in-force rate action plan, which also takes into account our current updated assumptions. As a result, based on current assumptions, the remaining estimated amount to be achieved through future rate action approvals under our in-force rate action plan was reduced by $1.5 billion in 2023 to approximately $5.3 billion. |
• | Claims. |
• | Actual to expected experience. pre-tax actual versus expected experience of $269 million in 2023 was primarily driven by higher claims and unfavorable timing impacts related to a legal settlement. |
• | Annual assumption review. pre-tax impacts of $61 million from cash flow assumption updates. We made unfavorable updates to our healthy life assumptions to better reflect near-term experience for cost of care, mortality, incidence and lapse rates, partially offset by a favorable update to our disabled life mortality assumptions to reflect an expectation that mortality will continue at elevated levels in the near term post-COVID-19. See “—Critical Accounting Estimates—Liability for future policy benefits” for additional information on the impact of changes in our long-term care insurance cash flow assumptions. Assumption updates also included changes for future in-force rate action approvals and benefit reductions based on recent favorable experience and reflect a recent legal settlement that primarily impacted uncapped cohorts. |
• | As part of our annual review of assumptions in the fourth quarter of 2023, our life insurance business had unfavorable pre-tax impacts of $226 million from cash flow assumption updates. We made |
unfavorable cash flow assumption updates to our persistency assumptions in our universal life insurance products with secondary guarantees to better reflect emerging experience. We also made unfavorable updates to our mortality assumptions in our term universal, universal and term life insurance products to better reflect emerging experience related to more modest mortality improvement and to include an expectation that mortality will continue at elevated levels in the near term post-COVID-19, similar to long-term care insurance. See “—Critical Accounting Estimates—Liability for future policy benefits” for additional information on the impact of changes in our life insurance cash flow assumptions. |
• | As of December 31, 2023 and 2022, the consolidated RBC ratio on a company action level basis of our U.S. domiciled life insurance subsidiaries was approximately 303% and 291%, respectively. The increase was primarily driven by earnings in our annuity products, including a net benefit to variable annuities from the impact of equity market and interest rate performance, as well as a net favorable impact from assumption updates primarily in our life insurance products in 2023. |
• | Genworth Financial executed $295 million in share repurchases, excluding excise taxes and other associated costs, during 2023. |
Years ended December 31, |
Increase (decrease) and percentage change |
|||||||||||||||||||
(Amounts in millions) |
2023 |
2022 |
2021 |
2023 vs. 2022 |
||||||||||||||||
Revenues: |
||||||||||||||||||||
Premiums |
$ | 957 | $ | 940 | $ | 975 | $ | 17 | 2 | % | ||||||||||
Net investment income |
208 | 155 | 141 | 53 | 34 | % | ||||||||||||||
Net investment gains (losses) |
(14 | ) | (2 | ) | (2 | ) | (12 | ) | NM | (1) | ||||||||||
Policy fees and other income |
2 | 2 | 4 | — | — | % | ||||||||||||||
Total revenues |
1,153 | 1,095 | 1,118 | 58 | 5 | % | ||||||||||||||
Benefits and expenses: |
||||||||||||||||||||
Benefits and other changes in policy reserves |
27 | (94 | ) | 125 | 121 | 129 | % | |||||||||||||
Acquisition and operating expenses, net of deferrals |
212 | 227 | 230 | (15 | ) | (7 | )% | |||||||||||||
Amortization of deferred acquisition costs and intangibles |
11 | 12 | 15 | (1 | ) | (8 | )% | |||||||||||||
Interest expense |
52 | 52 | 51 | — | — | % | ||||||||||||||
Total benefits and expenses |
302 | 197 | 421 | 105 | 53 | % | ||||||||||||||
Income from continuing operations before income taxes |
851 | 898 | 697 | (47 | ) | (5 | )% | |||||||||||||
Provision for income taxes |
186 | 194 | 148 | (8 | ) | (4 | )% | |||||||||||||
Income from continuing operations |
665 | 704 | 549 | (39 | ) | (6 | )% | |||||||||||||
Less: net income from continuing operations attributable to noncontrolling interests |
123 | 130 | 33 | (7 | ) | (5 | )% | |||||||||||||
Income from continuing operations available to Genworth Financial, Inc.’s common stockholders |
542 | 574 | 516 | (32 | ) | (6 | )% | |||||||||||||
Adjustments to income from continuing operations available to Genworth Financial, Inc.’s common stockholders: |
||||||||||||||||||||
Net investment (gains) losses, net (2) |
12 | 2 | 2 | 10 | NM | (1) | ||||||||||||||
Expenses related to restructuring |
— | 3 | 3 | (3 | ) | (100 | )% | |||||||||||||
Taxes on adjustments |
(2 | ) | (1 | ) | (1 | ) | (1 | ) | (100 | )% | ||||||||||
Adjusted operating income available to Genworth Financial, Inc.’s common stockholders |
$ | 552 | $ | 578 | $ | 520 | $ | (26 | ) | (4 | )% | |||||||||
(1) |
We define “NM” as not meaningful for increases or decreases greater than 200%. |
(2) |
Net investment (gains) losses were adjusted for the portion attributable to noncontrolling interests of $2 million. |
Years ended December 31, |
Increase (decrease) and percentage change |
|||||||||||||||||||
(Amounts in millions) |
2023 |
2022 |
2021 |
2023 vs. 2022 |
||||||||||||||||
Primary insurance in-force |
$ | 262,937 | $ | 248,262 | $ | 226,514 | $ | 14,675 | 6 | % | ||||||||||
Risk in-force: |
||||||||||||||||||||
Primary |
$ | 67,529 | $ | 62,791 | $ | 56,881 | $ | 4,738 | 8 | % | ||||||||||
Pool |
69 | 79 | 105 | (10 | ) | (13 | )% | |||||||||||||
Total risk in-force |
$ | 67,598 | $ | 62,870 | $ | 56,986 | $ | 4,728 | 8 | % | ||||||||||
New insurance written |
$ | 53,081 | $ | 66,485 | $ | 97,004 | $ | (13,404 | ) | (20 | )% |
Years ended December 31, |
Increase (decrease) |
|||||||||||||||
2023 |
2022 |
2021 |
2023 vs. 2022 |
|||||||||||||
Loss ratio |
3 | % | (10 | )% | 13 | % | 13 | % | ||||||||
Expense ratio |
23 | % | 25 | % | 25 | % | (2 | )% |
(Amounts in millions) |
2023 |
2022 |
2021 |
|||||||||
Primary insurance in-force by loan-to-value |
||||||||||||
95.01% and above |
$ | 44,955 | $ | 39,509 | $ | 35,455 | ||||||
90.01% to 95.00% |
109,227 | 103,618 | 95,149 | |||||||||
85.01% to 90.00% |
77,887 | 72,132 | 64,549 | |||||||||
85.00% and below |
30,868 | 33,003 | 31,361 | |||||||||
Total |
$ | 262,937 | $ | 248,262 | $ | 226,514 | ||||||
Primary risk in-force by loan-to-value |
||||||||||||
95.01% and above |
$ | 12,878 | $ | 11,136 | $ | 9,907 | ||||||
90.01% to 95.00% |
31,781 | 30,079 | 27,608 | |||||||||
85.01% to 90.00% |
19,163 | 17,621 | 15,644 | |||||||||
85.00% and below |
3,707 | 3,955 | 3,722 | |||||||||
Total |
$ | 67,529 | $ | 62,791 | $ | 56,881 | ||||||
Primary insurance in-force by credit quality at origination: |
||||||||||||
Over 760 |
$ | 110,635 | $ | 102,467 | $ | 89,982 | ||||||
740—759 |
43,053 | 40,097 | 35,874 | |||||||||
720—739 |
37,020 | 34,916 | 31,730 | |||||||||
700—719 |
29,766 | 28,867 | 27,359 | |||||||||
680—699 |
21,835 | 21,554 | 21,270 | |||||||||
660—679 (1) |
11,357 | 10,926 | 10,549 | |||||||||
640—659 |
6,137 | 6,095 | 6,124 | |||||||||
620—639 |
2,504 | 2,630 | 2,783 | |||||||||
<620 |
630 | 710 | 843 | |||||||||
Total |
$ | 262,937 | $ | 248,262 | $ | 226,514 | ||||||
Primary risk in-force by credit quality at origination: |
||||||||||||
Over 760 |
$ | 28,363 | $ | 25,807 | $ | 22,489 | ||||||
740—759 |
11,096 | 10,154 | 9,009 | |||||||||
720—739 |
9,621 | 8,931 | 8,055 | |||||||||
700—719 |
7,623 | 7,317 | 6,907 | |||||||||
680—699 |
5,557 | 5,428 | 5,334 | |||||||||
660—679 (1) |
2,908 | 2,767 | 2,638 | |||||||||
640—659 |
1,565 | 1,540 | 1,530 | |||||||||
620—639 |
635 | 665 | 702 | |||||||||
<620 |
161 | 182 | 217 | |||||||||
Total |
$ | 67,529 | $ | 62,791 | $ | 56,881 | ||||||
(1) |
Loans with unknown FICO scores are included in the 660-679 category. |
2023 |
2022 |
2021 |
||||||||||
Primary insurance: |
||||||||||||
Insured loans in-force |
974,516 | 960,306 | 937,350 | |||||||||
Delinquent loans |
20,432 | 19,943 | 24,820 | |||||||||
Percentage of delinquent loans (delinquency rate) |
2.10 | % | 2.08 | % | 2.65 | % |
2023 |
||||||||||||||||
(Dollar amounts in millions) |
Delinquencies |
Direct primary case reserves (1) |
Risk in-force |
Reserves as % of risk in-force |
||||||||||||
Payments in default: |
||||||||||||||||
3 payments or less |
10,166 | $ | 88 | $ | 629 | 14 | % | |||||||||
4 – 11 payments |
6,934 | 205 | 469 | 44 | % | |||||||||||
12 payments or more |
3,332 | 184 | 200 | 92 | % | |||||||||||
Total |
20,432 | $ | 477 | $ | 1,298 | 37 | % | |||||||||
(1) |
Direct primary case reserves exclude loss adjustment expenses, pool, IBNR and reinsurance reserves. |
2022 |
||||||||||||||||
(Dollar amounts in millions) |
Delinquencies |
Direct primary case reserves (1) |
Risk in-force |
Reserves as % of risk in-force |
||||||||||||
Payments in default: |
||||||||||||||||
3 payments or less |
8,920 | $ | 69 | $ | 509 | 14 | % | |||||||||
4 – 11 payments |
6,466 | 166 | 390 | 43 | % | |||||||||||
12 payments or more |
4,557 | 244 | 248 | 98 | % | |||||||||||
Total |
19,943 | $ | 479 | $ | 1,147 | 42 | % | |||||||||
(1) |
Direct primary case reserves exclude loss adjustment expenses, pool, IBNR and reinsurance reserves. |
Percent of primary risk in-force as ofDecember 31, 2023 |
Percent of direct primary case reserves as of December 31, 2023 (1) |
Delinquency rate as of December 31, |
||||||||||||||||||
2023 |
2022 |
2021 |
||||||||||||||||||
By State: |
||||||||||||||||||||
California |
13 | % | 12 | % | 2.22 | % | 2.09 | % | 3.17 | % | ||||||||||
Texas |
8 | % | 8 | % | 2.22 | % | 2.12 | % | 2.89 | % | ||||||||||
Florida (2) |
8 | % | 9 | % | 2.39 | % | 2.54 | % | 2.97 | % | ||||||||||
New York (2) |
5 | % | 12 | % | 3.05 | % | 2.95 | % | 3.80 | % | ||||||||||
Illinois (2) |
4 | % | 6 | % | 2.61 | % | 2.54 | % | 3.09 | % | ||||||||||
Arizona |
4 | % | 3 | % | 1.93 | % | 1.78 | % | 2.31 | % | ||||||||||
Michigan |
4 | % | 3 | % | 1.94 | % | 1.79 | % | 1.87 | % | ||||||||||
Georgia |
3 | % | 4 | % | 2.23 | % | 2.23 | % | 2.94 | % | ||||||||||
North Carolina |
3 | % | 2 | % | 1.56 | % | 1.59 | % | 2.18 | % | ||||||||||
Washington |
3 | % | 2 | % | 1.77 | % | 1.92 | % | 2.98 | % |
(1) |
Direct primary case reserves exclude loss adjustment expenses, pool, IBNR and reinsurance reserves. |
(2) |
Jurisdiction predominantly uses a judicial foreclosure process, which generally increases the amount of time it takes for a foreclosure to be completed. |
Percent of primary risk in-force as ofDecember 31, 2023 |
Percent of direct primary case reserves as of December 31, 2023 (1) |
Delinquency rate as of December 31, |
||||||||||||||||||
2023 |
2022 |
2021 |
||||||||||||||||||
By MSA or MD: |
||||||||||||||||||||
Phoenix, AZ MSA |
3 | % | 2 | % | 2.01 | % | 1.83 | % | 2.36 | % | ||||||||||
Chicago-Naperville, IL MD |
3 | % | 4 | % | 2.88 | % | 2.84 | % | 3.68 | % | ||||||||||
Atlanta, GA MSA |
3 | % | 3 | % | 2.40 | % | 2.42 | % | 3.28 | % | ||||||||||
New York, NY MD |
2 | % | 7 | % | 3.60 | % | 3.75 | % | 5.32 | % | ||||||||||
Washington-Arlington, DC MD |
2 | % | 2 | % | 2.01 | % | 1.85 | % | 2.96 | % | ||||||||||
Houston, TX MSA |
2 | % | 3 | % | 2.67 | % | 2.60 | % | 3.61 | % | ||||||||||
Los Angeles-Long Beach, CA MD |
2 | % | 3 | % | 2.39 | % | 2.18 | % | 3.95 | % | ||||||||||
Dallas, TX MD |
2 | % | 2 | % | 1.92 | % | 1.86 | % | 2.31 | % | ||||||||||
Riverside-San Bernardino, CA MSA |
2 | % | 3 | % | 2.83 | % | 2.89 | % | 3.42 | % | ||||||||||
Denver-Aurora-Lakewood, CO MSA |
2 | % | 1 | % | 1.12 | % | 1.12 | % | 1.66 | % |
(1) |
Direct primary case reserves exclude loss adjustment expenses, pool, IBNR and reinsurance reserves. |
(Amounts in millions) |
Weighted average rate (1) |
Percent of direct primary case reserves (2) |
Primary insurance in-force |
Percent of total |
Primary risk in-force |
Percent of total |
Delinquency rate |
|||||||||||||||||||||
Policy Year |
||||||||||||||||||||||||||||
2008 and prior |
5.74 | % | 18 | % | $ | 5,621 | 2 | % | $ | 1,449 | 2 | % | 8.61 | % | ||||||||||||||
2009 to 2015 |
4.34 | % | 4 | 3,383 | 1 | 881 | 1 | 4.55 | % | |||||||||||||||||||
2016 |
3.94 | % | 4 | 4,659 | 2 | 1,248 | 2 | 3.20 | % | |||||||||||||||||||
2017 |
4.30 | % | 5 | 5,321 | 2 | 1,403 | 2 | 3.59 | % | |||||||||||||||||||
2018 |
4.82 | % | 6 | 5,750 | 2 | 1,476 | 2 | 4.42 | % | |||||||||||||||||||
2019 |
4.25 | % | 8 | 13,773 | 5 | 3,544 | 5 | 2.77 | % | |||||||||||||||||||
2020 |
3.27 | % | 15 | 44,486 | 17 | 11,697 | 17 | 1.70 | % | |||||||||||||||||||
2021 |
3.11 | % | 21 | 70,045 | 27 | 17,846 | 27 | 1.65 | % | |||||||||||||||||||
2022 |
4.89 | % | 16 | 59,267 | 23 | 14,907 | 22 | 1.57 | % | |||||||||||||||||||
2023 |
6.68 | % | 3 | 50,632 | 19 | 13,078 | 20 | 0.47 | % | |||||||||||||||||||
Total portfolio |
4.41 | % | 100 | % | $ | 262,937 | 100 | % | $ | 67,529 | 100 | % | 2.10 | % | ||||||||||||||
(1) |
Average annual mortgage interest rate weighted by insurance in-force. |
(2) |
Direct primary case reserves exclude loss adjustment expenses, pool, IBNR and reinsurance reserves. |
Years ended December 31, |
Increase (decrease) and percentage change |
|||||||||||||||||||||||||||
(Amounts in millions) |
2023 |
2022 |
2021 |
2023 vs. 2022 |
2022 vs. 2021 |
|||||||||||||||||||||||
Revenues: |
||||||||||||||||||||||||||||
Premiums |
$ | 2,463 | $ | 2,500 | $ | 2,561 | $ | (37 | ) | (1)% | $ | (61 | ) | (2)% | ||||||||||||||
Net investment income |
1,914 | 1,900 | 2,027 | 14 | 1% | (127 | ) | (6)% | ||||||||||||||||||||
Net investment gains (losses) |
114 | 19 | 257 | 95 | NM (1) |
(238 | ) | (93)% | ||||||||||||||||||||
Policy fees and other income |
— | — | 1 | — | — % | (1 | ) | (100)% | ||||||||||||||||||||
Total revenues |
4,491 | 4,419 | 4,846 | 72 | 2% | (427 | ) | (9)% | ||||||||||||||||||||
Benefits and expenses: |
||||||||||||||||||||||||||||
Benefits and other changes in policy reserves |
3,802 | 3,788 | 3,808 | 14 | — % | (20 | ) | (1)% | ||||||||||||||||||||
Liability remeasurement (gains) losses |
321 | (317 | ) | 68 | 638 | NM (1) |
(385 | ) | NM (1) |
|||||||||||||||||||
Acquisition and operating expenses, net of deferrals |
452 | 413 | 451 | 39 | 9% | (38 | ) | (8)% | ||||||||||||||||||||
Amortization of deferred acquisition costs and intangibles |
71 | 74 | 76 | (3 | ) | (4)% | (2 | ) | (3)% | |||||||||||||||||||
Total benefits and expenses |
4,646 | 3,958 | 4,403 | 688 | 17% | (445 | ) | (10)% | ||||||||||||||||||||
Income (loss) from continuing operations before income taxes |
(155 | ) | 461 | 443 | (616 | ) | (134)% | 18 | 4% | |||||||||||||||||||
Provision (benefit) for income taxes |
(3 | ) | 125 | 123 | (128 | ) | (102)% | 2 | 2% | |||||||||||||||||||
Income (loss) from continuing operations |
(152 | ) | 336 | 320 | (488 | ) | (145)% | 16 | 5% | |||||||||||||||||||
Adjustments to income (loss) from continuing operations: |
||||||||||||||||||||||||||||
Net investment (gains) losses |
(114 | ) | (19 | ) | (257 | ) | (95 | ) | NM (1) |
238 | 93% | |||||||||||||||||
Expenses related to restructuring |
— | (1 | ) | 12 | 1 | 100% | (13 | ) | (108)% | |||||||||||||||||||
Taxes on adjustments |
24 | 4 | 51 | 20 | NM (1) |
(47 | ) | (92)% | ||||||||||||||||||||
Adjusted operating income (loss) available to Genworth Financial, Inc.’s common stockholders |
$ | (242 | ) | $ | 320 | $ | 126 | $ | (562 | ) | (176)% | $ | 194 | 154% | ||||||||||||||
(1) |
We define “NM” as not meaningful for increases or decreases greater than 200%. |
Years ended December 31 |
(Increase) decrease and percentage change |
|||||||||||||||||||||||||||
(Amounts in millions) |
2023 |
2022 |
2021 |
2023 vs. 2022 |
2022 vs. 2021 |
|||||||||||||||||||||||
Cash flow assumption updates |
$ | 52 | $ | (335 | ) | $ | 227 | $ | 387 | 116 | % | $ | (562 | ) | NM | (1) | ||||||||||||
Actual to expected experience |
269 | 18 | (159 | ) | 251 | NM | (1) |
177 | 111 | % | ||||||||||||||||||
Total liability remeasurement (gains) losses |
$ | 321 | $ | (317 | ) | $ | 68 | $ | 638 | NM | (1) |
$ | (385 | ) | NM | (1) | ||||||||||||
(1) |
We define “NM” as not meaningful for increases or decreases greater than 200%. |
(Dollar amounts in millions) |
2023 |
2022 |
2021 |
|||||||||
State filings approved |
117 | 139 | 173 | |||||||||
Impacted in-force premiums |
$ | 697 | $ | 1,143 | $ | 1,095 | ||||||
Weighted-average percentage rate increase approved |
51 | % | 48 | % | 37 | % | ||||||
Gross incremental premiums approved |
$ | 354 | $ | 549 | $ | 403 |
Years ended December 31, |
Increase (decrease) and percentage change |
|||||||||||||||||||||||||||
(Amounts in millions) |
2023 |
2022 |
2021 |
2023 vs. 2022 |
2022 vs. 2021 |
|||||||||||||||||||||||
Revenues: |
||||||||||||||||||||||||||||
Premiums |
$ | 207 | $ | 234 | $ | (136 | ) | $ | (27 | ) | (12 | )% | $ | 370 | NM | (1) | ||||||||||||
Net investment income |
1,042 | 1,083 | 1,195 | (41 | ) | (4 | )% | (112 | ) | (9 | )% | |||||||||||||||||
Net investment gains (losses) |
(49 | ) | (4 | ) | 74 | (45 | ) | NM | (1) |
(78 | ) | (105 | )% | |||||||||||||||
Policy fees and other income |
646 | 669 | 718 | (23 | ) | (3 | )% | (49 | ) | (7 | )% | |||||||||||||||||
Total revenues |
1,846 | 1,982 | 1,851 | (136 | ) | (7 | )% | 131 | 7 | % | ||||||||||||||||||
Benefits and expenses: |
||||||||||||||||||||||||||||
Benefits and other changes in policy reserves |
963 | 620 | 648 | 343 | 55 | % | (28 | ) | (4 | )% | ||||||||||||||||||
Liability remeasurement (gains) losses |
266 | 27 | 174 | 239 | NM | (1) |
(147 | ) | (84 | )% | ||||||||||||||||||
Changes in fair value of market risk benefits and associated hedges |
(12 | ) | (104 | ) | (160 | ) | 92 | 88 | % | 56 | 35 | % | ||||||||||||||||
Interest credited |
503 | 504 | 511 | (1 | ) | — | % | (7 | ) | (1 | )% | |||||||||||||||||
Acquisition and operating expenses, net of deferrals |
213 | 604 | 233 | (391 | ) | (65 | )% | 371 | 159 | % | ||||||||||||||||||
Amortization of deferred acquisition costs and intangibles |
181 | 240 | 291 | (59 | ) | (25 | )% | (51 | ) | (18 | )% | |||||||||||||||||
Total benefits and expenses |
2,114 | 1,891 | 1,697 | 223 | 12 | % | 194 | 11 | % | |||||||||||||||||||
Income (loss) from continuing operations before income taxes |
(268 | ) | 91 | 154 | (359 | ) | NM | (1) |
(63 | ) | (41 | )% | ||||||||||||||||
Provision (benefit) for income taxes |
(59 | ) | 16 | 30 | (75 | ) | NM | (1) |
(14 | ) | (47 | )% | ||||||||||||||||
Income (loss) from continuing operations |
(209 | ) | 75 | 124 | (284 | ) | NM | (1) |
(49 | ) | (40 | )% | ||||||||||||||||
Adjustments to income (loss) from continuing operations: |
||||||||||||||||||||||||||||
Net investment (gains) losses |
49 | 4 | (74 | ) | 45 | NM | (1) |
78 | 105 | % | ||||||||||||||||||
Changes in fair value of market risk benefits attributable to interest rates, equity markets and associated hedges (2) |
(22 | ) | (142 | ) | (210 | ) | 120 | 85 | % | 68 | 32 | % | ||||||||||||||||
Expenses related to restructuring |
— | (1 | ) | 5 | 1 | 100 | % | (6 | ) | (120 | )% | |||||||||||||||||
Pension plan termination costs |
— | 8 | — | (8 | ) | (100 | )% | 8 | NM | (1) | ||||||||||||||||||
Taxes on adjustments |
(6 | ) | 28 | 59 | (34 | ) | (121 | )% | (31 | ) | (53 | )% | ||||||||||||||||
Adjusted operating loss available to Genworth Financial, Inc.’s common stockholders |
$ | (188 | ) | $ | (28 | ) | $ | (96 | ) | $ | (160 | ) | NM | (1) |
$ | 68 | 71 | % | ||||||||||
(1) |
We define “NM” as not meaningful for increases or decreases greater than 200%. |
(2) |
For the years ended December 31, 2023, 2022 and 2021, changes in fair value of market risk benefits and associated hedges were adjusted to exclude changes in reserves, attributed fees and benefit payments of $(10) million, $(38) million and $(50) million, respectively. |
Years ended December 31, |
Increase (decrease) and percentage change |
||||||||||||||||||||||||||
(Amounts in millions) |
2023 |
2022 |
2021 |
2023 vs. 2022 |
2022 vs. 2021 |
|||||||||||||||||||||||
Adjusted operating income (loss) available to Genworth Financial, Inc.’s common stockholders: |
||||||||||||||||||||||||||||
Life insurance |
$ | (275 | ) | $ | (111 | ) | $ | (201 | ) | $ | (164 | ) | (148)% | $ | 90 | 45% | ||||||||||||
Fixed annuities |
50 | 62 | 83 | (12 | ) | (19)% | (21 | ) | (25)% | |||||||||||||||||||
Variable annuities |
37 | 21 | 22 | 16 | 76% | (1 | ) | (5)% | ||||||||||||||||||||
Total adjusted operating loss available to Genworth Financial, Inc.’s common stockholders |
$ | (188 | ) | $ | (28 | ) | $ | (96 | ) | $ | (160 | ) | NM (1) |
$ | 68 | 71% | ||||||||||||
(1) |
We define “NM” as not meaningful for increases or decreases greater than 200%. |
• | The adjusted operating loss in our life insurance products increased largely from $179 million of unfavorable updates to our persistency and mortality assumptions, as well as lower premiums reflecting runoff of our in-force blocks in 2023. These adverse developments were partially offset by lower DAC amortization related to higher lapses in 2022 and a $20 million legal settlement expense in 2022 that did not recur. |
• | Adjusted operating income in our fixed annuity products decreased mainly attributable to lower net spreads primarily related to block runoff, partially offset by favorable mortality experience in 2023. |
• | Adjusted operating income in our variable annuity products increased predominantly due to aging of our in-force block, partially offset by a decrease in fee income driven by lower account value in 2023. |
• | Our fixed annuity products increased $352 million primarily from a third-party recapture of $372 million of certain single premium immediate annuity contracts in 2022 that did not recur, partially offset by favorable mortality in 2023. |
• | Our life insurance products decreased $11 million primarily from less unfavorable mortality, partially offset by an increase in cost of reinsurance reserves related to a ceded reinsurance transaction in the fourth quarter of 2023. |
• | Our variable annuity products had an unfavorable variance of $50 million principally driven by higher derivative losses and lower interest rate increases, partially offset by favorable equity market impacts as well as lower attributed fees and higher benefit payments due to aging of our in-force block in 2023. |
• | Our fixed annuity products had an unfavorable variance of $42 million primarily attributable to lower interest rate increases, partially offset by favorable equity market impacts in 2023. |
• | Our fixed annuity products decreased $363 million primarily due to a payment of $365 million in 2022 related to the recapture of certain single premium immediate annuity contracts by a third party. |
• | Our life insurance products decreased $23 million primarily due to a legal settlement expense of $25 million and pension plan termination costs of $8 million in 2022 that did not recur. These decreases were partially offset by higher costs associated with an outsourcing arrangement in 2023. |
• | The adjusted operating loss in our life insurance products decreased largely from favorable cash flow assumption updates in our universal and term universal life insurance products in 2022 related to higher interest rates compared to unfavorable cash flow assumption updates in 2021 primarily driven by unfavorable pre-COVID-19 |
• | Adjusted operating income in our fixed annuity products decreased mainly attributable to lower net spreads primarily related to block runoff, partially offset by favorable mortality in 2022. |
• | Adjusted operating income in our variable annuity products was relatively flat in 2022 compared to 2021. |
• | Our fixed annuity products decreased $395 million primarily from a third-party recapture of $372 million of certain single premium immediate annuity contracts and from favorable mortality in 2022. |
• | Our life insurance products increased $352 million primarily from higher ceded reinsurance in 2021, partially offset by favorable mortality experience in 2022. We ceded $360 million of certain term life insurance reserves in connection with a reinsurance transaction in 2021. |
• | Our variable annuity products increased $15 million primarily from unfavorable equity market performance and aging of the in-force block in 2022. |
• | The liability remeasurement loss in our life insurance products decreased $117 million mainly attributable to favorable cash flow assumption updates in our universal and term universal life insurance products in 2022 compared to unfavorable updates in 2021. The favorable cash flow assumption updates in 2022 were primarily related to higher interest rates. The unfavorable cash flow assumption updates in 2021 were primarily driven by unfavorable pre-COVID-19 |
• | Our fixed annuity products had a liability remeasurement gain of $5 million in 2022 compared to a loss of $25 million in 2021. The liability remeasurement loss in 2021 was largely driven by unfavorable mortality assumption updates. |
• | Our variable annuity products had an unfavorable variance of $75 million principally driven by unfavorable equity market impacts, partially offset by higher interest rates and derivative gains in 2022. |
• | Our fixed annuity products had a favorable variance of $19 million primarily attributable to higher interest rates, partially offset by unfavorable equity market impacts in 2022. |
Years ended December 31, |
Increase (decrease) and percentage change |
|||||||||||||||||||
(Amounts in millions) |
2023 |
2022 |
2021 |
2023 vs. 2022 |
||||||||||||||||
Term and whole life insurance |
||||||||||||||||||||
Life insurance in-force, net of reinsurance |
$ | 44,121 | $ | 48,162 | $ | 47,297 | $ | (4,041 | ) | (8)% | ||||||||||
Life insurance in-force, before reinsurance |
$ | 270,950 | $ | 300,145 | $ | 332,793 | $ | (29,195 | ) | (10)% | ||||||||||
Term universal life insurance |
||||||||||||||||||||
Life insurance in-force, net of reinsurance |
$ | 90,427 | $ | 92,719 | $ | 99,471 | $ | (2,292 | ) | (2)% | ||||||||||
Life insurance in-force, before reinsurance |
$ | 91,024 | $ | 93,336 | $ | 100,119 | $ | (2,312 | ) | (2)% | ||||||||||
Universal life insurance |
||||||||||||||||||||
Life insurance in-force, net of reinsurance |
$ | 28,710 | $ | 29,798 | $ | 31,117 | $ | (1,088 | ) | (4)% | ||||||||||
Life insurance in-force, before reinsurance |
$ | 32,199 | $ | 33,622 | $ | 35,228 | $ | (1,423 | ) | (4)% |
Years ended December 31, |
Increase (decrease) and percentage change |
|||||||||||||||||||||||||||
(Amounts in millions) |
2023 |
2022 |
2021 |
2023 vs. 2022 |
2022 vs. 2021 |
|||||||||||||||||||||||
Revenues: |
||||||||||||||||||||||||||||
Premiums |
$ | 9 | $ | 6 | $ | 6 | $ | 3 | 50% | $ | — | — % | ||||||||||||||||
Net investment income |
19 | 8 | 7 | 11 | 138% | 1 | 14% | |||||||||||||||||||||
Net investment gains (losses) |
(28 | ) | (15 | ) | (7 | ) | (13 | ) | (87)% | (8 | ) | (114)% | ||||||||||||||||
Policy fees and other income |
(2 | ) | — | 1 | (2 | ) | NM (1) |
(1 | ) | (100)% | ||||||||||||||||||
Total revenues |
(2 | ) | (1 | ) | 7 | (1 | ) | (100)% | (8 | ) | (114)% | |||||||||||||||||
Benefits and expenses: |
||||||||||||||||||||||||||||
Benefits and other changes in policy reserves |
(9 | ) | (11 | ) | (6 | ) | 2 | 18% | (5 | ) | (83)% | |||||||||||||||||
Acquisition and operating expenses, net of deferrals |
65 | 41 | 84 | 24 | 59% | (43 | ) | (51)% | ||||||||||||||||||||
Amortization of deferred acquisition costs and intangibles |
1 | — | 2 | 1 | NM (1) |
(2 | ) | (100)% | ||||||||||||||||||||
Interest expense |
66 | 54 | 109 | 12 | 22% | (55 | ) | (50)% | ||||||||||||||||||||
Total benefits and expenses |
123 | 84 | 189 | 39 | 46% | (105 | ) | (56)% | ||||||||||||||||||||
Loss from continuing operations before income taxes |
(125 | ) | (85 | ) | (182 | ) | (40 | ) | (47)% | 97 | 53% | |||||||||||||||||
Benefit for income taxes |
(20 | ) | (16 | ) | (53 | ) | (4 | ) | (25)% | 37 | 70% | |||||||||||||||||
Loss from continuing operations |
(105 | ) | (69 | ) | (129 | ) | (36 | ) | (52)% | 60 | 47% | |||||||||||||||||
Adjustments to loss from continuing operations: |
||||||||||||||||||||||||||||
Net investment (gains) losses |
28 | 15 | 7 | 13 | 87% | 8 | 114% | |||||||||||||||||||||
(Gains) losses on early extinguishment of debt |
(2 | ) | 6 | 45 | (8 | ) | (133)% | (39 | ) | (87)% | ||||||||||||||||||
Expenses related to restructuring |
4 | 1 | 14 | 3 | NM (1) |
(13 | ) | (93)% | ||||||||||||||||||||
Taxes on adjustments |
(6 | ) | (5 | ) | (13 | ) | (1 | ) | (20)% | 8 | 62% | |||||||||||||||||
Adjusted operating loss available to Genworth Financial, Inc.’s common stockholders |
$ | (81 | ) | $ | (52 | ) | $ | (76 | ) | $ | (29 | ) | (56)% | $ | 24 | 32% | ||||||||||||
(1) |
We define “NM” as not meaningful for increases or decreases greater than 200%. |
• | The U.S. Federal Reserve increased interest rates by 100 basis points, bringing the upper end of the target range to the highest level since 2001. |
• | During the fourth quarter of 2023, the ten-year U.S. Treasury yield rose to its highest level since 2007, but U.S. Treasury yields decreased compared to September 30, 2023. Although the two-year U.S. Treasury yield remained above the ten-year U.S. Treasury yield in 2023, the differential between the two-year yield and the ten-year yield declined compared to December 31, 2022. |
• | Credit spreads tightened and credit market performance remained resilient as macroeconomic data continued to support market optimism for a soft economic landing in 2023. |
• | Bank deposits stabilized in the second half of 2023 after three regional banks were taken into receivership by the Federal Deposit Insurance Corporation in early 2023. At this time, we believe our investment portfolio is well positioned and any risks to valuations as a result of the pressures in the regional banking system and commercial real estate are manageable. |
• | As of December 31, 2023, our fixed maturity securities portfolio, which was 96% investment grade, comprised 75% of our total invested assets and cash. |
• | As of December 31, 2023, $1.3 billion notional of our derivatives portfolio was cleared through the Chicago Mercantile Exchange (“CME”). |
• | The customer swap agreements that govern our cleared derivatives contain provisions that enable our clearing agents to request initial margin in excess of CME requirements. As of December 31, 2023, we posted initial margin of $79 million to our clearing agents, which represented $39 million more than was otherwise required by the clearinghouse. Because our clearing agents serve as guarantors of our obligations to the CME, the customer agreements contain broad termination provisions that are not specifically dependent on ratings. |
• | As of December 31, 2023, $11.4 billion notional of our derivatives portfolio was in bilateral OTC derivative transactions pursuant to which we have posted aggregate independent amounts of $464 million and are holding collateral from counterparties in the amount of $19 million. |
Increase (decrease) |
||||||||||||||||||||||||||||||||||||||||
2023 |
2022 |
2021 |
2023 vs. 2022 |
2022 vs. 2021 |
||||||||||||||||||||||||||||||||||||
(Amounts in millions) |
Yield |
Amount |
Yield |
Amount |
Yield |
Amount |
Yield |
Amount |
Yield |
Amount |
||||||||||||||||||||||||||||||
Fixed maturity securities— taxable |
4.5 | % | $ | 2,244 | 4.5 | % | $ | 2,296 | 4.5 | % | $ | 2,411 | — | % | $ | (52 | ) | — | % | $ | (115 | ) | ||||||||||||||||||
Fixed maturity securities— non-taxable |
4.2 | % | 3 | 4.7 | % | 5 | 5.6 | % | 7 | (0.5 | )% | (2 | ) | (0.9 | )% | (2 | ) | |||||||||||||||||||||||
Equity securities |
3.0 | % | 11 | 4.0 | % | 10 | 4.0 | % | 9 | (1.0 | )% | 1 | — | % | 1 | |||||||||||||||||||||||||
Commercial mortgage loans |
4.4 | % | 302 | 4.6 | % | 321 | 5.5 | % | 376 | (0.2 | )% | (19 | ) | (0.9 | )% | (55 | ) | |||||||||||||||||||||||
Policy loans |
10.2 | % | 224 | 10.0 | % | 211 | 9.3 | % | 189 | 0.2 | % | 13 | 0.7 | % | 22 | |||||||||||||||||||||||||
Limited partnerships (1) |
4.5 | % | 117 | 4.7 | % | 99 | 15.7 | % | 223 | (0.2 | )% | 18 | (11.0 | )% | (124 | ) | ||||||||||||||||||||||||
Other invested assets (2) |
50.5 | % | 279 | 59.9 | % | 267 | 69.7 | % | 241 | (9.4 | )% | 12 | (9.8 | )% | 26 | |||||||||||||||||||||||||
Cash, cash equivalents, restricted cash and short-term investments |
4.7 | % | 95 | 1.2 | % | 20 | — | % | 1 | 3.5 | % | 75 | 1.2 | % | 19 | |||||||||||||||||||||||||
Gross investment income before expenses and fees |
5.1 | % | 3,275 | 5.0 | % | 3,229 | 5.2 | % | 3,457 | 0.1 | % | 46 | (0.2 | )% | (228 | ) | ||||||||||||||||||||||||
Expenses and fees |
(0.2 | )% | (92 | ) | (0.2 | )% | (83 | ) | (0.1 | )% | (87 | ) | — | % | (9 | ) | (0.1 | )% | 4 | |||||||||||||||||||||
Net investment income |
4.9 | % | $ | 3,183 | 4.8 | % | $ | 3,146 | 5.1 | % | $ | 3,370 | 0.1 | % | $ | 37 | (0.3 | )% | $ | (224 | ) | |||||||||||||||||||
Average invested assets and cash |
$ | 64,637 | $ | 65,160 | $ | 66,099 | $ | (523 | ) | $ | (939 | ) | ||||||||||||||||||||||||||||
(1) |
Limited partnership investments are primarily equity-based and do not have fixed returns by period. |
(2) |
Investment income for other invested assets includes amortization of terminated cash flow hedges, which have no corresponding book value within the yield calculation. |
(Amounts in millions) |
2023 |
2022 |
2021 |
|||||||||
Realized investment gains (losses): |
||||||||||||
Available-for-sale |
||||||||||||
Realized gains |
$ | 29 | $ | 28 | $ | 67 | ||||||
Realized losses |
(154 | ) | (102 | ) | (10 | ) | ||||||
Net realized gains (losses) on available-for-sale |
(125 | ) | (74 | ) | 57 | |||||||
Net realized gains (losses) on equity securities sold |
(1 | ) | — | (7 | ) | |||||||
Net realized gains (losses) on limited partnerships |
— | — | 3 | |||||||||
Total net realized investment gains (losses) |
(126 | ) | (74 | ) | 53 | |||||||
Net change in allowance for credit losses on available-for-sale |
(7 | ) | — | (6 | ) | |||||||
Write-down of available-for-sale |
(1 | ) | (2 | ) | (1 | ) | ||||||
Net unrealized gains (losses) on equity securities still held |
53 | (35 | ) | 1 | ||||||||
Net unrealized gains (losses) on limited partnerships |
111 | 71 | 264 | |||||||||
Commercial mortgage loans |
(5 | ) | 4 | (3 | ) | |||||||
Derivative instruments |
7 | 32 | 13 | |||||||||
Other |
(9 | ) | 2 | 1 | ||||||||
Net investment gains (losses) |
$ | 23 | $ | (2 | ) | $ | 322 | |||||
• | We recorded $125 million of net losses related to the sale of available-for-sale |
• | We recorded net unrealized gains on equity securities of $53 million in 2023 driven by favorable equity market performance compared to net unrealized losses of $35 million in 2022 from unfavorable performance. We recorded $40 million of higher net unrealized gains on limited partnerships driven by more favorable private equity market performance in 2023. We also recorded an allowance for credit losses on available-for-sale |
• | Net investment gains related to derivatives decreased in 2023 primarily from losses on hedging programs that support our fixed indexed annuity products compared to gains in 2022, lower gains on hedging programs that support our indexed universal life insurance products and losses from forward bond purchase commitments in 2023. These decreases were partially offset by gains on equity index options in 2023 compared to losses in 2022. |
• | We recorded net realized losses related to the sale of available-for-sale |
• | We recorded $193 million of lower net unrealized gains on limited partnerships in 2022 compared to 2021 primarily from less favorable private equity market performance in 2022. We also recorded $35 million of net unrealized losses on equity securities during 2022 driven by unfavorable equity market performance. |
2023 |
2022 |
|||||||||||||||
(Amounts in millions) |
Carrying value |
% of total |
Carrying value |
% of total |
||||||||||||
Available-for-sale |
||||||||||||||||
Public |
$ | 32,189 | 51 | % | $ | 31,757 | 53 | % | ||||||||
Private |
14,592 | 24 | 14,826 | 24 | ||||||||||||
Equity securities |
396 | 1 | 319 | 1 | ||||||||||||
Commercial mortgage loans, net |
6,802 | 10 | 7,010 | 11 | ||||||||||||
Policy loans |
2,220 | 4 | 2,139 | 3 | ||||||||||||
Limited partnerships |
2,821 | 5 | 2,331 | 4 | ||||||||||||
Other invested assets |
731 | 1 | 566 | 1 | ||||||||||||
Cash, cash equivalents and restricted cash |
2,215 | 4 | 1,799 | 3 | ||||||||||||
Total cash, cash equivalents and invested assets |
$ | 61,966 | 100 | % | $ | 60,747 | 100 | % | ||||||||
As of December 31, |
||||||||||||||||||||||||
(Amounts in millions) |
2023 |
2022 |
||||||||||||||||||||||
NRSRO designation |
Amortized cost |
Fair value |
% of total |
Amortized cost |
Fair value |
% of total |
||||||||||||||||||
Public fixed maturity securities |
||||||||||||||||||||||||
AAA |
$ | 2,779 | $ | 2,559 | 8 | % | $ | 6,394 | $ | 6,067 | 19 | % | ||||||||||||
AA |
6,461 | 6,170 | 19 | 3,146 | 2,859 | 9 | ||||||||||||||||||
A |
9,474 | 9,287 | 29 | 8,860 | 8,398 | 27 | ||||||||||||||||||
BBB |
14,346 | 13,645 | 42 | 14,964 | 13,623 | 43 | ||||||||||||||||||
BB |
518 | 498 | 2 | 839 | 776 | 2 | ||||||||||||||||||
B |
32 | 30 | — | 37 | 34 | — | ||||||||||||||||||
CCC and lower |
— | — | — | — | — | — | ||||||||||||||||||
Total public fixed maturity securities |
$ | 33,610 | $ | 32,189 | 100 | % | $ | 34,240 | $ | 31,757 | 100 | % | ||||||||||||
Private fixed maturity securities |
||||||||||||||||||||||||
AAA |
$ | 866 | $ | 832 | 6 | % | $ | 876 | $ | 825 | 6 | % | ||||||||||||
AA |
1,574 | 1,477 | 10 | 1,562 | 1,421 | 10 | ||||||||||||||||||
A |
4,398 | 4,043 | 28 | 4,675 | 4,170 | 28 | ||||||||||||||||||
BBB |
7,709 | 7,126 | 48 | 8,129 | 7,221 | 48 | ||||||||||||||||||
BB |
1,037 | 975 | 7 | 1,217 | 1,076 | 7 | ||||||||||||||||||
B |
149 | 117 | 1 | 135 | 113 | 1 | ||||||||||||||||||
CCC and lower |
7 | 7 | — | — | — | — | ||||||||||||||||||
Not rated |
15 | 15 | — | — | — | — | ||||||||||||||||||
Total private fixed maturity securities |
$ | 15,755 | $ | 14,592 | 100 | % | $ | 16,594 | $ | 14,826 | 100 | % | ||||||||||||
Total fixed maturity securities |
||||||||||||||||||||||||
AAA |
$ | 3,645 | $ | 3,391 | 7 | % | $ | 7,270 | $ | 6,892 | 15 | % | ||||||||||||
AA |
8,035 | 7,647 | 16 | 4,708 | 4,280 | 9 | ||||||||||||||||||
A |
13,872 | 13,330 | 29 | 13,535 | 12,568 | 27 | ||||||||||||||||||
BBB |
22,055 | 20,771 | 45 | 23,093 | 20,844 | 45 | ||||||||||||||||||
BB |
1,555 | 1,473 | 3 | 2,056 | 1,852 | 4 | ||||||||||||||||||
B |
181 | 147 | — | 172 | 147 | — | ||||||||||||||||||
CCC and lower |
7 | 7 | — | — | — | — | ||||||||||||||||||
Not rated |
15 | 15 | — | — | — | — | ||||||||||||||||||
Total fixed maturity securities |
$ | 49,365 | $ | 46,781 | 100 | % | $ | 50,834 | $ | 46,583 | 100 | % | ||||||||||||
2023 |
2022 |
|||||||||||||||
(Amounts in millions) |
Carrying value |
% of total |
Carrying value |
% of total |
||||||||||||
Bank loan investments |
$ | 529 | 72 | % | $ | 467 | 82 | % | ||||||||
Derivatives |
131 | 18 | 50 | 9 | ||||||||||||
Short-term investments |
27 | 4 | 3 | 1 | ||||||||||||
Other investments |
44 | 6 | 46 | 8 | ||||||||||||
Total other invested assets |
$ | 731 | 100 | % | $ | 566 | 100 | % | ||||||||
(Notional in millions) |
Measurement |
December 31, 2022 |
Additions |
Maturities/ terminations |
December 31, 2023 |
|||||||||||||||
Derivatives designated as hedges |
||||||||||||||||||||
Cash flow hedges: |
||||||||||||||||||||
Interest rate swaps |
Notional | $ | 8,542 | $ | 1,857 | $ | (1,424 | ) | $ | 8,975 | ||||||||||
Foreign currency swaps |
Notional | 144 | — | (13 | ) | 131 | ||||||||||||||
Forward bond purchase commitments |
Notional | — | 1,075 | — | 1,075 | |||||||||||||||
Total cash flow hedges |
8,686 | 2,932 | (1,437 | ) | 10,181 | |||||||||||||||
Total derivatives designated as hedges |
8,686 | 2,932 | (1,437 | ) | 10,181 | |||||||||||||||
Derivatives not designated as hedges |
||||||||||||||||||||
Equity index options |
Notional | 936 | 729 | (963 | ) | 702 | ||||||||||||||
Financial futures |
Notional | 1,403 | 5,488 | (5,640 | ) | 1,251 | ||||||||||||||
Forward bond purchase commitments |
Notional | — | 500 | — | 500 | |||||||||||||||
Total derivatives not designated as hedges |
2,339 | 6,717 | (6,603 | ) | 2,453 | |||||||||||||||
Total derivatives |
$ | 11,025 | $ | 9,649 | $ | (8,040 | ) | $ | 12,634 | |||||||||||
(Number of policies) |
Measurement |
December 31, 2022 |
Additions |
Maturities/ terminations |
December 31, 2023 |
|||||||||||||||
Derivatives not designated as hedges |
||||||||||||||||||||
Fixed indexed annuity embedded derivatives |
Policies | 7,315 | — | (1,489 | ) | 5,826 | ||||||||||||||
Indexed universal life embedded derivatives |
Policies | 771 | — | (22 | ) | 749 |
Increase (decrease) and percentage change |
||||||||||||||||
(Amounts in millions) |
2023 |
2022 |
2023 vs. 2022 |
|||||||||||||
Present value of expected net premiums (1) |
$ | 15,333 | $ | 16,691 | $ | (1,358 | ) | (8 | )% | |||||||
Present value of expected future policy benefits (1) |
$ | 50,095 | $ | 50,551 | $ | (456 | ) | (1 | )% |
(1) |
At the locked-in discount rate. |
(Amounts in millions) |
||||
5% increase in future claim costs (1) |
$ | (1,490 | ) | |
Reduction in claim termination rates (2) |
$ | (290 | ) | |
10% reduction in benefit of future in-force rate actions (3) |
$ | (175 | ) |
(1) |
Reflects the impact of an unfavorable assumption change for claim terminations, incidence or benefit utilization rates (any discrete adverse assumption changes therefrom or in combination with, that results in our future claim costs increasing by 5%). |
(2) |
Reflects the impact of a 3% decrease in mortality and 8% decrease in lapse rates. |
(3) |
Reflects the impact of an unfavorable change to our assumptions for future premium rate increases and benefit reductions. |
Increase (decrease) and percentage change |
||||||||||||||||
(Amounts in millions) |
2023 |
2022 |
2023 vs. 2022 |
|||||||||||||
Present value of expected net premiums (1) |
$ | 1,835 | $ | 1,573 | $ | 262 | 17 | % | ||||||||
Present value of expected future policy benefits (1) |
$ | 2,192 | $ | 2,127 | $ | 65 | 3 | % |
(1) |
At the locked-in discount rate and excluding the impacts of flooring adjustments. See note 2 in our consolidated financial statements under “Item 8—Financial Statements and Supplementary Data” for additional information. |
(Amounts in millions) |
||||
2% higher mortality |
$ | (20 | ) | |
10% increase in lapses |
$ | (60 | ) |
Increase (decrease) and percentage change |
||||||||||||||||
(Amounts in millions) |
2023 |
2022 |
2023 vs. 2022 |
|||||||||||||
Total present value of expected future policy benefits (1) |
$ | 2,691 | $ | 2,897 | $ | (206 | ) | (7 | )% |
(1) |
At the locked-in discount rate. |
(Amounts in millions) |
||||
10% lower mortality |
$ | (60 | ) |
(Amounts in millions) |
||||
100 basis point decrease in projected crediting rates |
$ | (50 | ) | |
10% increase in persistency |
$ | (213 | ) | |
2% higher mortality |
$ | (42 | ) |
2023 |
||||||||||||||||
(Amounts in millions) |
Total |
Level 1 |
Level 2 |
Level 3 |
||||||||||||
Fixed maturity securities: |
||||||||||||||||
Pricing services |
$ | 41,311 | $ | — | $ | 41,311 | $ | — | ||||||||
Broker quotes |
221 | — | — | 221 | ||||||||||||
Internal models |
5,249 | — | 2,374 | 2,875 | ||||||||||||
Total fixed maturity securities |
$ | 46,781 | $ | — | $ | 43,685 | $ | 3,096 | ||||||||
2022 |
||||||||||||||||
(Amounts in millions) |
Total |
Level 1 |
Level 2 |
Level 3 |
||||||||||||
Fixed maturity securities: |
||||||||||||||||
Pricing services |
$ | 41,113 | $ | — | $ | 41,113 | $ | — | ||||||||
Broker quotes |
250 | — | — | 250 | ||||||||||||
Internal models |
5,220 | — | 2,280 | 2,940 | ||||||||||||
Total fixed maturity securities |
$ | 46,583 | $ | — | $ | 43,393 | $ | 3,190 | ||||||||
• | Invested assets increased $803 million primarily attributable to increases of $490 million in limited partnerships, $198 million in fixed maturity securities and $165 million in other invested assets, partially offset by a decrease of $208 million in commercial mortgage loans in 2023. Limited partnerships increased largely from capital calls in 2023. The increase in fixed maturity securities was predominantly related to tightening credit spreads increasing the fair value of our fixed maturity investment portfolio, partially offset by net sales and maturities in 2023. The increase in other invested assets was primarily related to derivatives and bank loan investments. Commercial mortgage loans decreased mostly due to payments outpacing originations in 2023. We continue to monitor macroeconomic trends and rebalance our investment holdings in commercial real estate. |
• | Cash and cash equivalents increased $416 million primarily related to net sales and maturities of fixed maturity securities and commercial mortgage loan payments outpacing originations, partially offset by net withdrawals from our investment contracts and repurchases of Genworth Financial’s common stock in 2023. |
• | Deferred acquisition costs decreased $223 million primarily attributable to amortization in our life and long-term care insurance products in 2023. |
• | The liability for future policy benefits increased $2,248 million primarily from a decrease in the single-A interest rate used to discount the liability for future policy benefits and aging of our long-term care insurance in-force block, partially offset by the runoff of our life insurance and fixed annuity products. The increase also includes the effects of changes in cash flow assumptions and variances between actual and expected experience. See “—Critical Accounting Estimates—Liability for future policy benefits” for additional information on the impact of changes in cash flow assumptions. |
• | Policyholder account balances decreased $1,024 million primarily from surrenders, benefit payments and policy charges in our fixed annuity and universal and term universal life insurance products in 2023, partially offset by an increase in additional insurance liabilities due to changes in cash flow assumptions. See “—Critical Accounting Estimates—Policyholder account balances —additional insurance liabilities” for additional information. |
• | Market risk benefit liabilities decreased $123 million mostly related to favorable equity market performance in 2023. |
• | We reported net income available to Genworth Financial, Inc.’s common stockholders of $76 million for the year ended December 31, 2023. |
• | Unrealized gains (losses) on investments increased total equity by $1,277 million primarily from tightening credit spreads in 2023. |
• | Change in the discount rate used to measure future policy benefits decreased total equity by $1,036 million largely attributable to a decrease in the single-A interest rate used to discount the liability for future policy benefits and related reinsurance recoverables (net of deferred taxes) in 2023. |
• | Treasury stock increased $299 million primarily due to the repurchase of Genworth Financial’s common stock, at cost, including excise taxes and other costs paid in connection with acquiring the shares, resulting in a decrease to total equity in 2023. |
(Amounts in millions) |
2023 |
2022 |
2021 |
|||||||||
Net cash from operating activities |
$ | 597 | $ | 1,049 | $ | 437 | ||||||
Net cash from investing activities |
1,261 | 733 | 896 | |||||||||
Net cash used by financing activities |
(1,443 | ) | (1,554 | ) | (2,419 | ) | ||||||
Net increase (decrease) in cash before foreign exchange effect |
$ | 415 | $ | 228 | $ | (1,086 | ) | |||||
Item 7A. |
Quantitative and Qualitative Disclosures About Market Risk |
(Dollar amounts in millions) |
2023 |
2022 |
||||||
Principal amount |
$ | 593 | $ | 600 | ||||
Weighted-average interest rate |
7.27 | % | 3.81 | % | ||||
Fair value (1) |
$ | 443 | $ | 378 |
(1) |
The fair value methodology is based on the then-current coupon, revalued based on the three-month Term SOFR Reference Rate or LIBOR, as applicable, set and commercially available data using the current spread assumption. The model is a floating rate coupon model using the risk premium or spread assumption to derive the valuation. |
Item 8. |
Financial Statements and Supplementary Data |
Page |
||||
Annual Financial Statements: |
||||
130 |
||||
Financial Statements as of December 31, 2023 and 2022 and for the years ended December 31, 2023, 2022 and 2021: |
||||
134 |
||||
135 |
||||
136 |
||||
137 |
||||
138 |
||||
Notes to Consolidated Financial Statements: |
||||
139 |
||||
140 |
||||
160 |
||||
165 |
||||
166 |
||||
180 |
||||
185 |
||||
186 |
||||
187 |
||||
191 |
||||
198 |
||||
201 |
||||
202 |
||||
206 |
||||
206 |
||||
209 |
||||
211 |
||||
214 |
||||
217 |
||||
217 |
||||
221 |
||||
241 |
||||
246 |
||||
254 |
||||
257 |
||||
261 |
||||
263 |
||||
265 |
||||
Financial Statement Schedules as of December 31, 2023 and 2022 and for the years ended December 31, 2023, 2022 and 2021: |
||||
267 |
||||
268 |
||||
275 |
• | evaluating the actuarial methodologies and key assumptions used to estimate the liability for future policy benefits for long-term care insurance and life insurance for consistency with generally accepted actuarial methodologies and industry practice |
• | evaluating certain of the Company’s key assumptions by assessing them in comparison to the Company’s relevant historical experience data and industry data or qualitative factors, and the consistency of the assumptions with each other |
• | assessing the reasonableness of estimated future in-force rate action assumptions for long-term care insurance for a selection of estimated rate increases by a) comparing to the Company’s historical regulatory approvals and regulatory information and b) assessing the Company’s ability to achieve the estimated future in-force rate actions by reperforming the Company’s calculations and comparing to the requirements to request a rate action. |
• | evaluating the methods and assumptions for consistency with generally accepted actuarial methodologies and industry practice |
• | evaluating the Company’s mortality and lapse assumptions by assessing the consistency of the assumptions with the underlying historical claims and lapse experience data and industry data |
• | developing an estimate of the additional insurance liabilities for a selection of contracts using the Company’s assumptions and comparing the results to the Company’s recorded additional insurance liabilities for the selected contracts. |
• | assessing the Company’s reserving methodology by comparing to accepted actuarial methodologies |
• | developing an independent estimate and range for a portion of the mortgage insurance loss reserves, using the Company’s underlying historical claims and delinquency data and independently developed models and assumptions and assessing the position in the range and the |
year-over-year movements of the Company’s recorded mortgage insurance loss reserves within the developed independent range. |
/s/ KPMG LLP |
December 31, |
||||||||
2023 |
2022 |
|||||||
(As adjusted) | ||||||||
Assets |
||||||||
Investments: |
||||||||
Fixed maturity securities available-for-sale, |
$ | $ | ||||||
Equity securities, at fair value |
||||||||
Commercial mortgage loans (net of unamortized balance of loan origination fees and costs of $ |
||||||||
Less: Allowance for credit losses |
( |
) | ( |
) | ||||
|
|
|
|
|||||
Commercial mortgage loans, net |
||||||||
Policy loans |
||||||||
Limited partnerships |
||||||||
Other invested assets |
||||||||
|
|
|
|
|||||
Total investments |
||||||||
Cash, cash equivalents and restricted cash |
||||||||
Accrued investment income |
||||||||
Deferred acquisition costs |
||||||||
Intangible assets |
||||||||
Reinsurance recoverable |
||||||||
Less: Allowance for credit losses |
( |
) | ( |
) | ||||
|
|
|
|
|||||
Reinsurance recoverable, net |
||||||||
Other assets |
||||||||
Deferred tax asset |
||||||||
Market risk benefit assets |
||||||||
Separate account assets |
||||||||
|
|
|
|
|||||
Total assets |
$ | $ | ||||||
|
|
|
|
|||||
Liabilities and equity |
||||||||
Liabilities: |
||||||||
Future policy benefits |
$ | $ | ||||||
Policyholder account balances |
||||||||
Market risk benefit liabilities |
||||||||
Liability for policy and contract claims |
||||||||
Unearned premiums |
||||||||
Other liabilities |
||||||||
Long-term borrowings |
||||||||
Separate account liabilities |
||||||||
Liabilities related to discontinued operations |
||||||||
|
|
|
|
|||||
Total liabilities |
||||||||
|
|
|
|
|||||
Commitments and contingencies (Note 25) |
||||||||
Equity: |
||||||||
Class A common stock, $ |
||||||||
Additional paid-in capital |
||||||||
Accumulated other comprehensive income (loss) |
( |
) | ( |
) | ||||
Retained earnings |
||||||||
Treasury stock, at cost ( |
( |
) | ( |
) | ||||
|
|
|
|
|||||
Total Genworth Financial, Inc.’s stockholders’ equity |
||||||||
Noncontrolling interests |
||||||||
|
|
|
|
|||||
Total equity |
||||||||
|
|
|
|
|||||
Total liabilities and equity |
$ | $ | ||||||
|
|
|
|
Years ended December 31, |
||||||||||||
2023 |
2022 |
2021 |
||||||||||
(As adjusted) |
(As adjusted) |
|||||||||||
Revenues: |
||||||||||||
Premiums |
$ | $ | $ | |||||||||
Net investment income |
||||||||||||
Net investment gains (losses) |
( |
) | ||||||||||
Policy fees and other income |
||||||||||||
|
|
|
|
|
|
|||||||
Total revenues |
||||||||||||
|
|
|
|
|
|
|||||||
Benefits and expenses: |
||||||||||||
Benefits and other changes in policy reserves |
||||||||||||
Liability remeasurement (gains) losses |
( |
) | ||||||||||
Changes in fair value of market risk benefits and associated hedges |
( |
) | ( |
) | ( |
) | ||||||
Interest credited |
||||||||||||
Acquisition and operating expenses, net of deferrals |
||||||||||||
Amortization of deferred acquisition costs and intangibles |
||||||||||||
Interest expense |
||||||||||||
|
|
|
|
|
|
|||||||
Total benefits and expenses |
||||||||||||
|
|
|
|
|
|
|||||||
Income from continuing operations before income taxes |
||||||||||||
Provision for income taxes |
||||||||||||
|
|
|
|
|
|
|||||||
Income from continuing operations |
||||||||||||
Income from discontinued operations, net of taxes |
||||||||||||
|
|
|
|
|
|
|||||||
Net income |
||||||||||||
Less: net income from continuing operations attributable to noncontrolling interests |
||||||||||||
Less: net income from discontinued operations attributable to noncontrolling interests |
||||||||||||
|
|
|
|
|
|
|||||||
Net income available to Genworth Financial, Inc.’s common stockholders |
$ | $ | $ | |||||||||
|
|
|
|
|
|
|||||||
Net income available to Genworth Financial, Inc.’s common stockholders: |
||||||||||||
Income from continuing operations available to Genworth Financial, Inc.’s common stockholders |
$ | $ | $ | |||||||||
Income from discontinued operations available to Genworth Financial, Inc.’s common stockholders |
||||||||||||
|
|
|
|
|
|
|||||||
Net income available to Genworth Financial, Inc.’s common stockholders |
$ | $ | $ | |||||||||
|
|
|
|
|
|
|||||||
Income from continuing operations available to Genworth Financial, Inc.’s common stockholders per share: |
||||||||||||
Basic |
$ | $ | $ | |||||||||
|
|
|
|
|
|
|||||||
Diluted |
$ | $ | $ | |||||||||
|
|
|
|
|
|
|||||||
Net income available to Genworth Financial, Inc.’s common stockholders per share: |
||||||||||||
Basic |
$ | $ | $ | |||||||||
|
|
|
|
|
|
|||||||
Diluted |
$ | $ | $ | |||||||||
|
|
|
|
|
|
|||||||
Weighted-average common shares outstanding: |
||||||||||||
Basic |
||||||||||||
|
|
|
|
|
|
|||||||
Diluted |
||||||||||||
|
|
|
|
|
|
Years ended December 31, |
||||||||||||
2023 |
2022 |
2021 |
||||||||||
(As adjusted) |
(As adjusted) |
|||||||||||
Net income |
$ | $ | $ | |||||||||
Other comprehensive income (loss), net of taxes: |
||||||||||||
Net unrealized gains (losses) on securities without an allowance for credit losses |
( |
) | ( |
) | ||||||||
Net unrealized gains (losses) on securities with an allowance for credit losses |
||||||||||||
Derivatives qualifying as hedges |
( |
) | ( |
) | ( |
) | ||||||
Change in discount rate used to measure future policy benefits |
( |
) | ||||||||||
Change in instrument-specific credit risk of market risk benefits |
||||||||||||
Foreign currency translation and other adjustments |
||||||||||||
|
|
|
|
|
|
|||||||
Total other comprehensive income (loss) |
||||||||||||
|
|
|
|
|
|
|||||||
Total comprehensive income |
||||||||||||
Less: comprehensive income attributable to noncontrolling interests |
||||||||||||
|
|
|
|
|
|
|||||||
Total comprehensive income available to Genworth Financial, Inc.’s common stockholders |
$ | $ | $ | |||||||||
|
|
|
|
|
|
Common stock |
Additional paid-in capital |
Accumulated other comprehensive income (loss) |
Retained earnings |
Treasury stock, at cost |
Total Genworth Financial, Inc.’s stockholders’ equity |
Noncontrolling interests |
Total equity |
|||||||||||||||||||||||||
Balances as of December 31, 2020 |
$ | $ |
$ |
$ |
$ |
( |
) | $ |
$ |
$ |
||||||||||||||||||||||
Cumulative effect of change in accounting, net of taxes |
( |
) | ( |
) | ( |
) | ( |
) | ||||||||||||||||||||||||
Initial sale of subsidiary shares to noncontrolling interests |
( |
) | ( |
) | ( |
) | ||||||||||||||||||||||||||
Sale of business that included noncontrolling interests |
( |
) | ( |
) | ||||||||||||||||||||||||||||
Comprehensive income: |
||||||||||||||||||||||||||||||||
Net income |
||||||||||||||||||||||||||||||||
Other comprehensive income, net of taxes |
||||||||||||||||||||||||||||||||
|
|
|
|
|
|
|||||||||||||||||||||||||||
Total comprehensive income |
||||||||||||||||||||||||||||||||
Dividends to noncontrolling interests |
( |
) | ( |
) | ||||||||||||||||||||||||||||
Stock-based compensation expense and exercises and other |
( |
) | ||||||||||||||||||||||||||||||
|
|
|
|
|
|
|
|
|
|
|
|
|
|
|
|
|||||||||||||||||
Balances as of December 31, 2021 (as adjusted) |
( |
) | ( |
) | ||||||||||||||||||||||||||||
|
|
|
|
|
|
|
|
|
|
|
|
|
|
|
|
|||||||||||||||||
Comprehensive income: |
||||||||||||||||||||||||||||||||
Net income |
||||||||||||||||||||||||||||||||
Other comprehensive income (loss), net of taxes |
( |
) | ||||||||||||||||||||||||||||||
|
|
|
|
|
|
|||||||||||||||||||||||||||
Total comprehensive income |
||||||||||||||||||||||||||||||||
Treasury stock acquired in connection with share repurchases |
( |
) | ( |
) | ( |
) | ||||||||||||||||||||||||||
Dividends to noncontrolling interests |
( |
) | ( |
) | ||||||||||||||||||||||||||||
Stock-based compensation expense and exercises and other |
( |
) | ||||||||||||||||||||||||||||||
|
|
|
|
|
|
|
|
|
|
|
|
|
|
|
|
|||||||||||||||||
Balances as of December 31, 2022 (as adjusted) |
( |
) | ( |
) | ||||||||||||||||||||||||||||
|
|
|
|
|
|
|
|
|
|
|
|
|
|
|
|
|||||||||||||||||
Repurchase of subsidiary shares |
( |
) | ( |
) | ||||||||||||||||||||||||||||
Comprehensive income : |
||||||||||||||||||||||||||||||||
Net income |
||||||||||||||||||||||||||||||||
Other comprehensive income, net of taxes |
||||||||||||||||||||||||||||||||
|
|
|
|
|
|
|||||||||||||||||||||||||||
Total comprehensive income |
||||||||||||||||||||||||||||||||
Treasury stock acquired in connection with share repurchases |
( |
) | ( |
) | ( |
) | ||||||||||||||||||||||||||
Dividends to noncontrolling interests |
( |
) | ( |
) | ||||||||||||||||||||||||||||
Stock-based compensation expense and exercises and other |
( |
) | ||||||||||||||||||||||||||||||
|
|
|
|
|
|
|
|
|
|
|
|
|
|
|
|
|||||||||||||||||
Balances as of December 31, 2023 |
$ | $ | $ | ( |
) | $ | $ | ( |
) | $ | $ | $ | ||||||||||||||||||||
|
|
|
|
|
|
|
|
|
|
|
|
|
|
|
|
Years ended December 31, |
||||||||||||
2023 |
2022 |
2021 |
||||||||||
(As adjusted) |
(As adjusted) |
|||||||||||
Cash flows from (used by) operating activities: |
||||||||||||
Net income |
$ |
$ |
$ |
|||||||||
Less income from discontinued operations, net of taxes |
( |
) | ||||||||||
Adjustments to reconcile net income to net cash from operating activities: |
||||||||||||
Amortization of fixed maturity securities discounts and premiums |
( |
) |
( |
) |
( |
) | ||||||
Net investment (gains) losses |
( |
) |
( |
) | ||||||||
Changes in fair value of market risk benefits and associated hedges |
( |
) |
( |
) |
( |
) | ||||||
Charges assessed to policyholders |
( |
) |
( |
) |
( |
) | ||||||
Acquisition costs deferred |
( |
) |
( |
) |
( |
) | ||||||
Amortization of deferred acquisition costs and intangibles |
||||||||||||
Deferred income taxes |
||||||||||||
Derivative instruments, limited partnerships and other |
( |
) |
( |
) |
( |
) | ||||||
Long-term incentive compensation expense |
||||||||||||
Change in certain assets and liabilities: |
||||||||||||
Accrued investment income and other assets |
( |
) |
( |
) |
( |
) | ||||||
Insurance reserves |
||||||||||||
Current tax liabilities |
( |
) |
( |
) | ||||||||
Other liabilities, policy and contract claims and other policy-related balances |
( |
) |
( |
) |
||||||||
Cash used by operating activities—discontinued operations |
( |
) |
( |
) |
( |
) | ||||||
|
|
|
|
|
|
|||||||
Net cash from operating activities |
||||||||||||
|
|
|
|
|
|
|||||||
Cash flows from (used by) investing activities: |
||||||||||||
Proceeds from maturities and repayments of investments: |
||||||||||||
Fixed maturity securities |
||||||||||||
Commercial mortgage loans |
||||||||||||
Limited partnerships and other invested assets |
||||||||||||
Proceeds from sales of investments: |
||||||||||||
Fixed maturity and equity securities |
||||||||||||
Purchases and originations of investments: |
||||||||||||
Fixed maturity and equity securities |
( |
) |
( |
) |
( |
) | ||||||
Commercial mortgage loans |
( |
) |
( |
) |
( |
) | ||||||
Limited partnerships and other invested assets |
( |
) |
( |
) |
( |
) | ||||||
Short-term investments, net |
( |
) |
||||||||||
Policy loans, net |
||||||||||||
Proceeds from sale of business, net of cash transferred |
||||||||||||
Other |
( |
) |
||||||||||
Cash used by investing activities—discontinued operations |
( |
) | ||||||||||
|
|
|
|
|
|
|||||||
Net cash from investing activities |
||||||||||||
|
|
|
|
|
|
|||||||
Cash flows from (used by) financing activities: |
|
|
| |||||||||
Deposits to universal life and investment contracts |
||||||||||||
Withdrawals from universal life and investment contracts |
( |
) |
( |
) |
( |
) | ||||||
Repayment and repurchase of long-term debt |
( |
) |
( |
) |
( |
) | ||||||
Proceeds from sale of subsidiary shares to noncontrolling interests |
||||||||||||
Repurchase of subsidiary shares |
( |
) |
||||||||||
Treasury stock acquired in connection with share repurchases |
( |
) |
( |
) |
||||||||
Dividends paid to noncontrolling interests |
( |
) |
( |
) |
( |
) | ||||||
Other, net |
( |
) |
||||||||||
|
|
|
|
|
|
|||||||
Net cash used by financing activities |
( |
) |
( |
) |
( |
) | ||||||
|
|
|
|
|
|
|||||||
Effect of exchange rate changes on cash, cash equivalents and restricted cash (includes $ , $ and $ ( ) related to discontinued operations for the years ended December 31, 2023, 2022 and 2021, respectively) |
||||||||||||
|
|
|
|
|
|
|||||||
Net change in cash, cash equivalents and restricted cash |
( |
) | ||||||||||
Cash, cash equivalents and restricted cash at beginning of period |
||||||||||||
|
|
|
|
|
|
|||||||
Cash, cash equivalents and restricted cash at end of period |
||||||||||||
Less cash, cash equivalents and restricted cash of discontinued operations at end of period |
||||||||||||
|
|
|
|
|
|
|||||||
Cash, cash equivalents and restricted cash of continuing operations at end of period |
$ |
$ |
$ |
|||||||||
|
|
|
|
|
|
• |
Enact. |
• |
Long-Term Care Insurance. |
• |
Life and Annuities. non-traditional life insurance (term, universal and term universal life insurance as well as corporate-owned life insurance and funding agreements), fixed annuities and variable annuities. |
• | Level 1—Quoted prices for identical instruments in active markets. |
• | Level 2—Quoted prices for similar instruments in active markets; quoted prices for identical or similar instruments in markets that are not active; and model-derived valuations for which inputs are observable or where those significant value drivers are observable. |
• | Level 3—Instruments for which significant value drivers are unobservable. |
(Amounts in millions) |
As originally reported |
Effect of adopting LDTI |
As adjusted |
|||||||||
Assets |
||||||||||||
Deferred acquisition costs |
$ | $ | $ | |||||||||
Intangible assets |
( |
) | ||||||||||
Reinsurance recoverable |
||||||||||||
Less: Allowance for credit losses |
( |
) | ( |
) | ( |
) | ||||||
|
|
|
|
|
|
|||||||
Reinsurance recoverable, net |
||||||||||||
Other assets |
||||||||||||
Deferred tax asset |
||||||||||||
Market risk benefit assets |
||||||||||||
Total assets |
||||||||||||
|
|
|
|
|
|
|
|
|
|
|
|
|
Liabilities and equity |
||||||||||||
Liabilities: |
||||||||||||
Future policy benefits |
||||||||||||
Policyholder account balances |
( |
) | ||||||||||
Market risk benefit liabilities |
||||||||||||
Liability for policy and contract claims |
( |
) | ||||||||||
Unearned premiums |
( |
) | ||||||||||
Other liabilities |
||||||||||||
Total liabilities |
||||||||||||
Equity: |
||||||||||||
Accumulated other comprehensive income (loss) |
( |
) | ( |
) | ( |
) | ||||||
Retained earnings |
( |
) | ||||||||||
Total Genworth Financial, Inc.’s stockholders’ equity |
( |
) | ||||||||||
Total equity |
( |
) | ||||||||||
Total liabilities and equity |
2022 |
2021 |
|||||||||||||||||||||||
(Amounts in millions, except per share amounts) |
As originally reported |
Effect of adopting LDTI |
As adjusted |
As originally reported |
Effect of adopting LDTI |
As adjusted |
||||||||||||||||||
Revenues: |
||||||||||||||||||||||||
Premiums |
$ | $ | ( |
) | $ | $ | $ | ( |
) | $ | ||||||||||||||
Net investment gains (losses) |
( |
) | ( |
) | ( |
) | ||||||||||||||||||
Policy fees and other income |
||||||||||||||||||||||||
Total revenues |
( |
) | ( |
) | ||||||||||||||||||||
Benefits and expenses: |
||||||||||||||||||||||||
Benefits and other changes in policy reserves |
||||||||||||||||||||||||
Liability remeasurement (gains) losses |
( |
) | ( |
) | ||||||||||||||||||||
Changes in fair value of market risk benefits and associated hedges |
( |
) | ( |
) | ( |
) | ( |
) | ||||||||||||||||
Interest credited |
||||||||||||||||||||||||
Acquisition and operating expenses, net of deferrals |
( |
) | ( |
) | ||||||||||||||||||||
Amortization of deferred acquisition costs and intangibles |
||||||||||||||||||||||||
Total benefits and expenses |
( |
) | ||||||||||||||||||||||
Income from continuing operations before income taxes |
( |
) | ||||||||||||||||||||||
Provision for income taxes |
( |
) | ||||||||||||||||||||||
Income from continuing operations |
( |
) | ||||||||||||||||||||||
Net income |
( |
) | ||||||||||||||||||||||
Net income available to Genworth Financial, Inc.’s common stockholders |
( |
) | ||||||||||||||||||||||
Income from continuing operations available to Genworth Financial, Inc.’s common stockholders |
( |
) | ||||||||||||||||||||||
Net income available to Genworth Financial, Inc.’s common stockholders |
( |
) | ||||||||||||||||||||||
Income from continuing operations available to Genworth Financial, Inc.’s common stockholders per share: |
||||||||||||||||||||||||
Basic |
( |
) | ||||||||||||||||||||||
Diluted |
( |
) | ||||||||||||||||||||||
Net income available to Genworth Financial, Inc.’s common stockholders per share: |
||||||||||||||||||||||||
Basic |
( |
) | ||||||||||||||||||||||
Diluted |
( |
) |
2022 |
2021 |
|||||||||||||||||||||||
(Amounts in millions) |
As originally reported |
Effect of adopting LDTI |
As adjusted |
As originally reported |
Effect of adopting LDTI |
As adjusted |
||||||||||||||||||
Cash flows from (used by) operating activities: |
||||||||||||||||||||||||
Net income |
$ | $ | $ | $ | $ | ( |
) | $ | ||||||||||||||||
Adjustments to reconcile net income to net cash from operating activities: |
||||||||||||||||||||||||
Net investment (gains) losses |
( |
) | ( |
) | ( |
) | ||||||||||||||||||
Changes in fair value of market risk benefits and associated hedges |
( |
) | ( |
) | ( |
) | ( |
) | ||||||||||||||||
Charges assessed to policyholders |
( |
) | ( |
) | ( |
) | ( |
) | ||||||||||||||||
Acquisition costs deferred |
( |
) | ( |
) | ( |
) | ( |
) | ( |
) | ||||||||||||||
Amortization of deferred acquisition costs and intangibles |
||||||||||||||||||||||||
Deferred income taxes |
( |
) | ||||||||||||||||||||||
Change in certain assets and liabilities: |
||||||||||||||||||||||||
Accrued investment income and other assets |
( |
) | ( |
) | ( |
) | ( |
) | ( |
) | ||||||||||||||
Insurance reserves |
||||||||||||||||||||||||
Other liabilities, policy and contract claims and other policy-related balances |
( |
) | ( |
) | ( |
) | ||||||||||||||||||
Net cash from operating activities |
Effect of adopting LDTI |
||||||||||||||||||||||||
(Amounts in millions) |
Balances as of December 31, 2020 (as reported) |
Eliminate shadow adjustments |
Changes in measurement of assets and liabilities |
Change in discount rate |
Recognize MRBs |
Balances as of January 1, 2021 (as adjusted) |
||||||||||||||||||
Assets |
||||||||||||||||||||||||
Total investments |
$ |
$ |
$ |
$ |
$ |
$ |
||||||||||||||||||
Cash, cash equivalents and restricted cash |
||||||||||||||||||||||||
Accrued investment income |
||||||||||||||||||||||||
Deferred acquisition costs |
||||||||||||||||||||||||
Intangible assets |
||||||||||||||||||||||||
Reinsurance recoverable |
( |
) |
||||||||||||||||||||||
Less: Allowance for credit losses |
( |
) |
( |
) | ||||||||||||||||||||
|
|
|
|
|
|
|
|
|
|
|
|
|||||||||||||
Reinsurance recoverable, net |
( |
) |
||||||||||||||||||||||
Other assets |
( |
) |
||||||||||||||||||||||
Deferred tax asset |
( |
) |
||||||||||||||||||||||
Market risk benefit assets |
||||||||||||||||||||||||
Separate account assets |
||||||||||||||||||||||||
Assets related to discontinued operations |
||||||||||||||||||||||||
|
|
|
|
|
|
|
|
|
|
|
|
|||||||||||||
Total assets |
$ |
$ |
( |
) |
$ |
$ |
$ |
$ |
||||||||||||||||
|
|
|
|
|
|
|
|
|
|
|
|
|||||||||||||
Liabilities and equity |
||||||||||||||||||||||||
Liabilities: |
||||||||||||||||||||||||
Future policy benefits |
$ |
$ |
( |
) |
$ |
$ |
$ |
$ |
||||||||||||||||
Policyholder account balances |
( |
) |
( |
) |
||||||||||||||||||||
Market risk benefit liabilities |
||||||||||||||||||||||||
Liability for policy and contract claims |
( |
) |
||||||||||||||||||||||
Unearned premiums |
( |
) |
||||||||||||||||||||||
Other liabilities |
||||||||||||||||||||||||
Long-term borrowings |
||||||||||||||||||||||||
Separate account liabilities |
||||||||||||||||||||||||
Liabilities related to discontinued operations |
||||||||||||||||||||||||
|
|
|
|
|
|
|
|
|
|
|
|
|||||||||||||
Total liabilities |
( |
) |
||||||||||||||||||||||
|
|
|
|
|
|
|
|
|
|
|
|
|||||||||||||
Commitments and contingencies |
||||||||||||||||||||||||
Equity: |
||||||||||||||||||||||||
Class A common stock |
||||||||||||||||||||||||
Additional paid-in capital |
||||||||||||||||||||||||
Accumulated other comprehensive income (loss) |
( |
) |
( |
) |
( |
) | ||||||||||||||||||
Retained earnings |
( |
) |
( |
) |
( |
) | ||||||||||||||||||
Treasury stock, at cost |
( |
) |
( |
) | ||||||||||||||||||||
|
|
|
|
|
|
|
|
|
|
|
|
|||||||||||||
Total Genworth Financial, Inc.’s stockholders’ equity |
( |
) |
( |
) |
( |
) |
||||||||||||||||||
Noncontrolling interests |
||||||||||||||||||||||||
|
|
|
|
|
|
|
|
|
|
|
|
|||||||||||||
Total equity |
( |
) |
( |
) |
( |
) |
||||||||||||||||||
|
|
|
|
|
|
|
|
|
|
|
|
|||||||||||||
Total liabilities and equity |
$ |
$ |
( |
) |
$ |
$ |
$ |
$ |
||||||||||||||||
|
|
|
|
|
|
|
|
|
|
|
|
(Amounts in millions) |
Accumulated other comprehensive income (loss) |
Retained earnings |
Total stockholders’ equity |
|||||||||
Deferred acquisition costs |
$ | $ | $ | |||||||||
Intangible assets |
||||||||||||
Reinsurance recoverable |
||||||||||||
Other assets |
||||||||||||
Future policy benefits |
( |
) | ( |
) | ( |
) | ||||||
Policyholder account balances |
||||||||||||
Market risk benefits, net |
( |
) | ( |
) | ( |
) | ||||||
Other liabilities |
( |
) | ( |
) | ||||||||
Deferred taxes |
||||||||||||
|
|
|
|
|
|
|||||||
Total |
$ | ( |
) | $ | ( |
) | $ | ( |
) | |||
|
|
|
|
|
|
(Amounts in millions) |
Long-term care insurance |
Life insurance |
Fixed annuities |
Variable annuities |
Total |
|||||||||||||||
Balances as of December 31, 2020 |
$ | $ | $ | $ | $ | |||||||||||||||
Adjustment for removal of related balances in accumulated other comprehensive income (loss) |
||||||||||||||||||||
|
|
|
|
|
|
|
|
|
|
|||||||||||
Adjusted balances as of January 1, 2021 |
$ | $ | $ | $ | ||||||||||||||||
|
|
|
|
|
|
|
|
|||||||||||||
Enact segment |
||||||||||||||||||||
|
|
|||||||||||||||||||
Total deferred acquisition costs as of January 1, 2021 |
$ | |||||||||||||||||||
|
|
(Amounts in millions) |
Life insurance |
Fixed annuities |
Variable annuities |
Total |
||||||||||||
Balances as of December 31, 2020 |
$ | $ | $ | $ | ||||||||||||
Adjustment for removal of related balances in accumulated other comprehensive income (loss) |
||||||||||||||||
|
|
|
|
|
|
|
|
|||||||||
Adjusted balances as of January 1, 2021 |
$ | $ | $ | $ | ||||||||||||
|
|
|
|
|
|
|
|
(Amounts in millions) |
Long-term care insurance |
Life insurance |
Fixed annuities |
Total |
||||||||||||
Balances as of December 31, 2020 |
$ | $ | $ | $ | ||||||||||||
Reclassify liability for policy and contract claims, unearned premiums and due premiums (1) |
||||||||||||||||
Change in discount rate assumptions |
||||||||||||||||
Change in cash flow assumptions (2) |
( |
) | ||||||||||||||
Change in cash flow assumptions, effect of increase (decrease) of the deferred profit liability (2) |
( |
) | ( |
) | ||||||||||||
Adjustment for removal of related balances in accumulated other comprehensive income (loss) |
( |
) | ( |
) | ( |
) | ||||||||||
|
|
|
|
|
|
|
|
|||||||||
Adjusted balances as of January 1, 2021 |
||||||||||||||||
Less: reinsurance recoverable |
||||||||||||||||
|
|
|
|
|
|
|
|
|||||||||
Adjusted balances as of January 1, 2021, net of reinsurance |
$ | $ | $ | $ | ||||||||||||
|
|
|
|
|
|
|
|
(1) |
Upon adopting LDTI, we elected to combine our previously disclosed liability for policy and contract claims, unearned premiums and due premiums, excluding amounts related to mortgage insurance and certain life and annuity products not subject to the new accounting guidance, within the liability for future policy benefits and present the aggregate liability as one line item in our consolidated balance sheets. |
(2) |
For limited-payment contracts, if the remeasured liability for future policy benefits under LDTI is (less) greater than the carrying value immediately before the Transition Date, the deferred profit liability is increased (decreased) with a corresponding (decrease) increase to the liability for future policy benefits. |
(Amounts in millions) |
Fixed indexed annuities |
Variable annuities |
Total |
|||||||||
Balances as of December 31, 2020 |
$ | $ | $ | |||||||||
Adjustment for the difference between carrying amount and fair value, except for the difference due to instrument-specific credit risk |
||||||||||||
Adjustment for the cumulative effect of changes in the instrument-specific credit risk since issuance |
||||||||||||
|
|
|
|
|
|
|||||||
Total adjustment for the difference between carrying amount and fair value |
||||||||||||
|
|
|
|
|
|
|||||||
Adjusted balances as of January 1, 2021 |
||||||||||||
Less: reinsurance recoverable |
||||||||||||
|
|
|
|
|
|
|||||||
Adjusted balances as of January 1, 2021, net of reinsurance |
$ | $ | $ | |||||||||
|
|
|
|
|
|
(Amounts in millions, except per share amounts) |
2023 |
2022 |
2021 |
|||||||||
Weighted-average common shares used in basic earnings per share calculations |
||||||||||||
Potentially dilutive securities: |
||||||||||||
Performance stock units, restricted stock units and other equity-based awards |
||||||||||||
|
|
|
|
|
|
|||||||
Weighted-average common shares used in diluted earnings per share calculations |
||||||||||||
|
|
|
|
|
|
|||||||
Income from continuing operations: |
||||||||||||
Income from continuing operations |
$ | $ | $ | |||||||||
Less: net income from continuing operations attributable to noncontrolling interests |
||||||||||||
|
|
|
|
|
|
|||||||
Income from continuing operations available to Genworth Financial, Inc.’s common stockholders |
$ | $ | $ | |||||||||
|
|
|
|
|
|
|||||||
Basic per share |
$ | $ | $ | |||||||||
|
|
|
|
|
|
|||||||
Diluted per share |
$ | $ | $ | |||||||||
|
|
|
|
|
|
|||||||
Income from discontinued operations: |
||||||||||||
Income from discontinued operations, net of taxes |
$ | $ | $ | |||||||||
Less: net income from discontinued operations attributable to noncontrolling interests |
||||||||||||
|
|
|
|
|
|
|||||||
Income from discontinued operations available to Genworth Financial, Inc.’s common stockholders |
$ | $ | $ | |||||||||
|
|
|
|
|
|
|||||||
Basic per share |
$ | $ | $ | |||||||||
|
|
|
|
|
|
|||||||
Diluted per share |
$ | $ | $ | |||||||||
|
|
|
|
|
|
|||||||
Net income: |
||||||||||||
Income from continuing operations |
$ | $ | $ | |||||||||
Income from discontinued operations, net of taxes |
||||||||||||
|
|
|
|
|
|
|||||||
Net income |
||||||||||||
Less: net income attributable to noncontrolling interests |
||||||||||||
|
|
|
|
|
|
|||||||
Net income available to Genworth Financial, Inc.’s common stockholders |
$ | $ | $ | |||||||||
|
|
|
|
|
|
|||||||
Basic per share (1) |
$ | $ | $ | |||||||||
|
|
|
|
|
|
|||||||
Diluted per share (1) |
$ | $ | $ | |||||||||
|
|
|
|
|
|
(1) |
May not total due to whole number calculation. |
(Amounts in millions) |
2023 |
2022 |
2021 |
|||||||||
Fixed maturity securities—taxable |
$ | $ | $ | |||||||||
Fixed maturity securities—non-taxable |
||||||||||||
Equity securities |
||||||||||||
Commercial mortgage loans |
||||||||||||
Policy loans |
||||||||||||
Limited partnerships |
||||||||||||
Other invested assets |
||||||||||||
Cash, cash equivalents, restricted cash and short-term investments |
||||||||||||
|
|
|
|
|
|
|||||||
Gross investment income before expenses and fees |
||||||||||||
Expenses and fees |
( |
) | ( |
) | ( |
) | ||||||
|
|
|
|
|
|
|||||||
Net investment income |
$ | $ | $ | |||||||||
|
|
|
|
|
|
(Amounts in millions) |
2023 |
2022 |
2021 |
|||||||||
Realized investment gains (losses): |
||||||||||||
Available-for-sale fixed maturity securities: |
||||||||||||
Realized gains |
$ | $ | $ | |||||||||
Realized losses |
( |
) | ( |
) | ( |
) | ||||||
|
|
|
|
|
|
|||||||
Net realized gains (losses) on available-for-sale fixed maturity securities |
( |
) | ( |
) | ||||||||
Net realized gains (losses) on equity securities sold |
( |
) | ( |
) | ||||||||
Net realized gains (losses) on limited partnerships |
||||||||||||
|
|
|
|
|
|
|||||||
Total net realized investment gains (losses) |
( |
) | ( |
) | ||||||||
|
|
|
|
|
|
|||||||
Net change in allowance for credit losses on available-for-sale fixed maturity securities |
( |
) | ( |
) | ||||||||
Write-down of available-for-sale fixed maturity securities (1) |
( |
) | ( |
) | ( |
) | ||||||
Net unrealized gains (losses) on equity securities still held |
( |
) | ||||||||||
Net unrealized gains (losses) on limited partnerships |
||||||||||||
Commercial mortgage loans |
( |
) | ( |
) | ||||||||
Derivative instruments (2) |
||||||||||||
Other |
( |
) | ||||||||||
|
|
|
|
|
|
|||||||
Net investment gains (losses) |
$ | $ | ( |
) | $ | |||||||
|
|
|
|
|
|
(1) |
Represents write-down of securities deemed uncollectible or that we intend to sell or will be required to sell prior to recovery of the amortized cost basis. |
(2) |
See note 6 for additional information on the impact of derivative instruments included in net investment gains (losses). |
2023 |
||||||||||||||||||||||||||||||||
(Amounts in millions) |
Beginning balance |
Increase from securities without allowance in previous periods |
Increase (decrease) from securities with allowance in previous periods |
Securities sold |
Decrease due to change in intent or requirement to sell |
Write- offs |
Recoveries |
Ending balance |
||||||||||||||||||||||||
Fixed maturity securities: |
||||||||||||||||||||||||||||||||
U.S. corporate |
$ | $ | $ | $ | ( |
) | $ | $ | ( |
) | $ | $ | ||||||||||||||||||||
Commercial mortgage-backed |
( |
) | ||||||||||||||||||||||||||||||
|
|
|
|
|
|
|
|
|
|
|
|
|
|
|
|
|||||||||||||||||
Total available-for-sale securities |
$ | $ | $ | $ | ( |
) | $ | $ | ( |
) | $ | $ | ||||||||||||||||||||
|
|
|
|
|
|
|
|
|
|
|
|
|
|
|
|
|||||||||||||||||
2021 |
||||||||||||||||||||||||||||||||
(Amounts in millions) |
Beginning balance |
Increase from securities without allowance in previous periods |
Increase (decrease) from securities with allowance in previous periods |
Securities sold |
Decrease due to change in intent or requirement to sell |
Write- offs |
Recoveries |
Ending balance |
||||||||||||||||||||||||
Fixed maturity securities: |
||||||||||||||||||||||||||||||||
Non-U.S. corporate |
$ | $ | |
$ |
|
$ | ( |
) | $ | $ | $ | $ | ||||||||||||||||||||
Commercial mortgage-backed |
( |
) | ||||||||||||||||||||||||||||||
|
|
|
|
|
|
|
|
|
|
|
|
|
|
|
|
|||||||||||||||||
Total available-for-sale fixed maturity securities |
$ | $ | $ |
|
$ | ( |
) | $ | $ | ( |
) | $ | $ | |||||||||||||||||||
|
|
|
|
|
|
|
|
|
|
|
|
|
|
|
|
(Amounts in millions) |
2023 |
2022 |
2021 |
|||||||||
Net unrealized gains (losses) on fixed maturity securities without an allowance for credit losses |
$ | ( |
) | $ | ( |
) | $ | |||||
Net unrealized gains (losses) on fixed maturity securities with an allowance for credit losses |
||||||||||||
Adjustments to policyholder contract balances |
( |
) | ||||||||||
Income taxes, net |
( |
) | ||||||||||
|
|
|
|
|
|
|||||||
Net unrealized investment gains (losses) |
( |
) | ( |
) | ||||||||
Less: net unrealized investment gains (losses) attributable to noncontrolling interests |
( |
) | ( |
) | ||||||||
|
|
|
|
|
|
|||||||
Net unrealized investment gains (losses) attributable to Genworth Financial, Inc. |
$ | ( |
) | $ | ( |
) | $ | |||||
|
|
|
|
|
|
(Amounts in millions) |
2023 |
2022 |
2021 |
|||||||||
Beginning balance |
$ | ( |
) | $ | $ | |||||||
Unrealized gains (losses) arising during the period: |
||||||||||||
Unrealized gains (losses) on fixed maturity securities |
( |
) | ( |
) | ||||||||
Adjustment to policyholder contract balances (1) |
( |
) | ||||||||||
Provision for income taxes |
( |
) | ||||||||||
|
|
|
|
|
|
|||||||
Change in unrealized gains (losses) on investment securities |
( |
) | ( |
) | ||||||||
Reclassification adjustments to net investment (gains) losses, net of taxes of $( |
( |
) | ||||||||||
|
|
|
|
|
|
|||||||
Change in net unrealized investment gains (losses) |
( |
) | ( |
) | ||||||||
Less: change in net unrealized investment gains (losses) attributable to noncontrolling interests |
( |
) | ( |
) | ||||||||
|
|
|
|
|
|
|||||||
Ending balance |
$ | ( |
) | $ | ( |
) | $ | |||||
|
|
|
|
|
|
(1) |
See note 12 for additional information. |
(Amounts in millions) |
Amortized cost or cost |
Gross unrealized gains |
Gross unrealized losses |
Allowance for credit losses |
Fair value |
|||||||||||||||
Fixed maturity securities: |
||||||||||||||||||||
U.S. government, agencies and government-sponsored enterprises |
$ | $ | $ | ( |
) | $ | $ | |||||||||||||
State and political subdivisions |
( |
) | ||||||||||||||||||
Non-U.S. government |
( |
) | ||||||||||||||||||
U.S. corporate: |
||||||||||||||||||||
Utilities |
( |
) | ||||||||||||||||||
Energy |
( |
) | ||||||||||||||||||
Finance and insurance |
( |
) | ||||||||||||||||||
Consumer—non-cyclical |
( |
) | ||||||||||||||||||
Technology and communications |
( |
) | ||||||||||||||||||
Industrial |
( |
) | ||||||||||||||||||
Capital goods |
( |
) | ||||||||||||||||||
Consumer—cyclical |
( |
) | ||||||||||||||||||
Transportation |
( |
) | ||||||||||||||||||
Other |
( |
) | ||||||||||||||||||
|
|
|
|
|
|
|
|
|
|
|||||||||||
Total U.S. corporate |
( |
) | ||||||||||||||||||
|
|
|
|
|
|
|
|
|
|
|||||||||||
Non-U.S. corporate: |
||||||||||||||||||||
Utilities |
( |
) | ||||||||||||||||||
Energy |
( |
) | ||||||||||||||||||
Finance and insurance |
( |
) | ||||||||||||||||||
Consumer—non-cyclical |
( |
) | ||||||||||||||||||
Technology and communications |
( |
) | ||||||||||||||||||
Industrial |
( |
) | ||||||||||||||||||
Capital goods |
( |
) | ||||||||||||||||||
Consumer—cyclical |
( |
) | ||||||||||||||||||
Transportation |
( |
) | ||||||||||||||||||
Other |
( |
) | ||||||||||||||||||
|
|
|
|
|
|
|
|
|
|
|||||||||||
Total non-U.S. corporate |
( |
) | ||||||||||||||||||
|
|
|
|
|
|
|
|
|
|
|||||||||||
Residential mortgage-backed |
( |
) | ||||||||||||||||||
Commercial mortgage-backed |
( |
) | ( |
) | ||||||||||||||||
Other asset-backed |
( |
) | ||||||||||||||||||
|
|
|
|
|
|
|
|
|
|
|||||||||||
Total available-for-sale securities |
$ | $ | $ | ( |
) | $ | ( |
) | $ | |||||||||||
|
|
|
|
|
|
|
|
|
|
(Amounts in millions) |
Amortized cost or cost |
Gross unrealized gains |
Gross unrealized losses |
Allowance for credit losses |
Fair value |
|||||||||||||||
Fixed maturity securities: |
||||||||||||||||||||
U.S. government, agencies and government-sponsored enterprises |
$ | $ | $ | ( |
) | $ | $ | |||||||||||||
State and political subdivisions |
( |
) | ||||||||||||||||||
Non-U.S. government |
( |
) | ||||||||||||||||||
U.S. corporate: |
||||||||||||||||||||
Utilities |
( |
) | ||||||||||||||||||
Energy |
( |
) | ||||||||||||||||||
Finance and insurance |
( |
) | ||||||||||||||||||
Consumer—non-cyclical |
( |
) | ||||||||||||||||||
Technology and communications |
( |
) | ||||||||||||||||||
Industrial |
( |
) | ||||||||||||||||||
Capital goods |
( |
) | ||||||||||||||||||
Consumer—cyclical |
( |
) | ||||||||||||||||||
Transportation |
( |
) | ||||||||||||||||||
Other |
( |
) | ||||||||||||||||||
|
|
|
|
|
|
|
|
|
|
|||||||||||
Total U.S. corporate |
( |
) | ||||||||||||||||||
|
|
|
|
|
|
|
|
|
|
|||||||||||
Non-U.S. corporate: |
||||||||||||||||||||
Utilities |
( |
) | ||||||||||||||||||
Energy |
( |
) | ||||||||||||||||||
Finance and insurance |
( |
) | ||||||||||||||||||
Consumer—non-cyclical |
( |
) | ||||||||||||||||||
Technology and communications |
( |
) | ||||||||||||||||||
Industrial |
( |
) | ||||||||||||||||||
Capital goods |
( |
) | ||||||||||||||||||
Consumer—cyclical |
( |
) | ||||||||||||||||||
Transportation |
( |
) | ||||||||||||||||||
Other |
( |
) | ||||||||||||||||||
|
|
|
|
|
|
|
|
|
|
|||||||||||
Total non-U.S. corporate |
( |
) | ||||||||||||||||||
|
|
|
|
|
|
|
|
|
|
|||||||||||
Residential mortgage-backed |
( |
) | ||||||||||||||||||
Commercial mortgage-backed |
( |
) | ||||||||||||||||||
Other asset-backed |
( |
) | ||||||||||||||||||
|
|
|
|
|
|
|
|
|
|
|||||||||||
Total available-for-sale |
$ | $ | $ | ( |
) | $ | $ | |||||||||||||
|
|
|
|
|
|
|
|
|
|
Less than 12 months |
12 months or more |
Total |
||||||||||||||||||||||||||||||||||
(Dollar amounts in millions) |
Fair value |
Gross unrealized losses |
Number of securities |
Fair value |
Gross unrealized losses |
Number of securities |
Fair value |
Gross unrealized losses |
Number of securities |
|||||||||||||||||||||||||||
Description of Securities |
||||||||||||||||||||||||||||||||||||
Fixed maturity securities: |
||||||||||||||||||||||||||||||||||||
U.S. government, agencies and government-sponsored enterprises |
$ | $ | ( |
) | $ | $ | ( |
) | $ | $ | ( |
) | ||||||||||||||||||||||||
State and political subdivisions |
( |
) | ( |
) | ( |
) | ||||||||||||||||||||||||||||||
Non-U.S. government |
( |
) | ( |
) | ||||||||||||||||||||||||||||||||
U.S. corporate |
( |
) | ( |
) | ( |
) | ||||||||||||||||||||||||||||||
Non-U.S. corporate |
( |
) | ( |
) | ( |
) | ||||||||||||||||||||||||||||||
Residential mortgage-backed |
( |
) | ( |
) | ( |
) | ||||||||||||||||||||||||||||||
Commercial mortgage-backed |
( |
) | ( |
) | ( |
) | ||||||||||||||||||||||||||||||
Other asset-backed |
( |
) | ( |
) | ||||||||||||||||||||||||||||||||
|
|
|
|
|
|
|
|
|
|
|
|
|
|
|
|
|
|
|||||||||||||||||||
Total for fixed maturity securities in an unrealized loss position |
$ | $ | ( |
) | $ | $ | ( |
) | $ | $ | ( |
) | ||||||||||||||||||||||||
|
|
|
|
|
|
|
|
|
|
|
|
|
|
|
|
|
|
|||||||||||||||||||
% Below cost: |
||||||||||||||||||||||||||||||||||||
<20% Below cost |
$ | $ | ( |
) | $ | $ | ( |
) | $ | $ | ( |
) | ||||||||||||||||||||||||
20%-50% Below cost |
( |
) | ( |
) | ( |
) | ||||||||||||||||||||||||||||||
|
|
|
|
|
|
|
|
|
|
|
|
|
|
|
|
|
|
|||||||||||||||||||
Total for fixed maturity securities in an unrealized loss position |
$ | $ | ( |
) | $ | $ | ( |
) | $ | $ | ( |
) | ||||||||||||||||||||||||
|
|
|
|
|
|
|
|
|
|
|
|
|
|
|
|
|
|
|||||||||||||||||||
Investment grade |
$ | $ | ( |
) | $ | $ | ( |
) | $ | $ | ( |
) | ||||||||||||||||||||||||
Below investment grade |
( |
) | ( |
) | ||||||||||||||||||||||||||||||||
|
|
|
|
|
|
|
|
|
|
|
|
|
|
|
|
|
|
|||||||||||||||||||
Total for in an unrealized loss position |
$ | $ | ( |
) | $ | $ | ( |
) | $ | $ | ( |
) | ||||||||||||||||||||||||
|
|
|
|
|
|
|
|
|
|
|
|
|
|
|
|
|
|
Less than 12 months |
12 months or more |
Total |
||||||||||||||||||||||||||||||||||
(Dollar amounts in millions) |
Fair value |
Gross unrealized losses |
Number of securities |
Fair value |
Gross unrealized losses |
Number of securities |
Fair value |
Gross unrealized losses |
Number of securities |
|||||||||||||||||||||||||||
Description of Securities |
||||||||||||||||||||||||||||||||||||
U.S. corporate: |
||||||||||||||||||||||||||||||||||||
Utilities |
$ | $ | ( |
) | $ | $ | ( |
) | $ | $ | ( |
) | ||||||||||||||||||||||||
Energy |
( |
) | ( |
) | ( |
) | ||||||||||||||||||||||||||||||
Finance and insurance |
( |
) | ( |
) | ( |
) | ||||||||||||||||||||||||||||||
Consumer—non-cyclical |
( |
) | ( |
) | ( |
) | ||||||||||||||||||||||||||||||
Technology and communications |
( |
) | ( |
) | ( |
) | ||||||||||||||||||||||||||||||
Industrial |
( |
) | ( |
) | ( |
) | ||||||||||||||||||||||||||||||
Capital goods |
( |
) | ( |
) | ||||||||||||||||||||||||||||||||
Consumer—cyclical |
( |
) | ( |
) | ( |
) | ||||||||||||||||||||||||||||||
Transportation |
( |
) | ( |
) | ( |
) | ||||||||||||||||||||||||||||||
Other |
( |
) | ( |
) | ||||||||||||||||||||||||||||||||
|
|
|
|
|
|
|
|
|
|
|
|
|
|
|
|
|
|
|||||||||||||||||||
Subtotal, U.S. corporate securities |
( |
) | ( |
) | ( |
) | ||||||||||||||||||||||||||||||
|
|
|
|
|
|
|
|
|
|
|
|
|
|
|
|
|
|
|||||||||||||||||||
Non-U.S. corporate: |
||||||||||||||||||||||||||||||||||||
Utilities |
( |
) | ( |
) | ||||||||||||||||||||||||||||||||
Energy |
( |
) | ( |
) | ( |
) | ||||||||||||||||||||||||||||||
Finance and insurance |
( |
) | ( |
) | ( |
) | ||||||||||||||||||||||||||||||
Consumer—non-cyclical |
( |
) | ( |
) | ||||||||||||||||||||||||||||||||
Technology and communications |
( |
) | ( |
) | ||||||||||||||||||||||||||||||||
Industrial |
( |
) | ( |
) | ( |
) | ||||||||||||||||||||||||||||||
Capital goods |
( |
) | ( |
) | ||||||||||||||||||||||||||||||||
Consumer—cyclical |
( |
) | ( |
) | ||||||||||||||||||||||||||||||||
Transportation |
( |
) | ( |
) | ||||||||||||||||||||||||||||||||
Other |
( |
) | ( |
) | ||||||||||||||||||||||||||||||||
Subtotal, non-U.S. corporate securities |
( |
) | ( |
) | ( |
) | ||||||||||||||||||||||||||||||
|
|
|
|
|
|
|
|
|
|
|
|
|
|
|
|
|
|
|||||||||||||||||||
Total for in an unrealized loss position |
$ | $ | ( |
) | $ | $ | ( |
) | $ | $ | ( |
) | ||||||||||||||||||||||||
|
|
|
|
|
|
|
|
|
|
|
|
|
|
|
|
|
|
Less than 12 months |
12 months or more |
Total |
||||||||||||||||||||||||||||||||||
(Dollar amounts in millions) |
Fair value |
Gross unrealized losses |
Number of securities |
Fair value |
Gross unrealized losses |
Number of securities |
Fair value |
Gross unrealized losses |
Number of securities |
|||||||||||||||||||||||||||
Description of Securities |
||||||||||||||||||||||||||||||||||||
Fixed maturity securities: |
||||||||||||||||||||||||||||||||||||
U.S. government, agencies and government-sponsored enterprises |
$ | $ | ( |
) | $ | $ | ( |
) | $ | $ | ( |
) | ||||||||||||||||||||||||
State and political subdivisions |
( |
) | ( |
) | ( |
) | ||||||||||||||||||||||||||||||
Non-U.S. government |
( |
) | ( |
) | ( |
) | ||||||||||||||||||||||||||||||
U.S. corporate |
( |
) | ( |
) | ( |
) | ||||||||||||||||||||||||||||||
Non-U.S. corporate |
( |
) | ( |
) | ( |
) | ||||||||||||||||||||||||||||||
Residential mortgage-backed |
( |
) | ( |
) | ( |
) | ||||||||||||||||||||||||||||||
Commercial mortgage-backed |
( |
) | ( |
) | ( |
) | ||||||||||||||||||||||||||||||
Other asset-backed |
( |
) | ( |
) | ( |
) | ||||||||||||||||||||||||||||||
|
|
|
|
|
|
|
|
|
|
|
|
|
|
|
|
|
|
|||||||||||||||||||
Total for fixed maturity securities in an unrealized loss position |
$ | $ | ( |
) | $ | $ | ( |
) | $ | $ | ( |
) | ||||||||||||||||||||||||
|
|
|
|
|
|
|
|
|
|
|
|
|
|
|
|
|
|
|||||||||||||||||||
% Below cost: |
||||||||||||||||||||||||||||||||||||
<20% Below cost |
$ | $ | ( |
) | $ | $ | ( |
) | $ | $ | ( |
) | ||||||||||||||||||||||||
20%-50% Below cost |
( |
) | ( |
) | ( |
) | ||||||||||||||||||||||||||||||
>50% Below cost |
( |
) | ( |
) | ||||||||||||||||||||||||||||||||
|
|
|
|
|
|
|
|
|
|
|
|
|
|
|
|
|
|
|||||||||||||||||||
Total for fixed maturity securities in an unrealized loss position |
$ | $ | ( |
) | $ | $ | ( |
) | $ | $ | ( |
) | ||||||||||||||||||||||||
|
|
|
|
|
|
|
|
|
|
|
|
|
|
|
|
|
|
|||||||||||||||||||
Investment grade |
$ | $ | ( |
) | $ | $ | ( |
) | $ | $ | ( |
) | ||||||||||||||||||||||||
Below investment grade |
( |
) | ( |
) | ( |
) | ||||||||||||||||||||||||||||||
|
|
|
|
|
|
|
|
|
|
|
|
|
|
|
|
|
|
|||||||||||||||||||
Total for in an unrealized loss position |
$ | $ | ( |
) | $ | $ | ( |
) | $ | $ | ( |
) | ||||||||||||||||||||||||
|
|
|
|
|
|
|
|
|
|
|
|
|
|
|
|
|
|
Less than 12 months |
12 months or more |
Total |
||||||||||||||||||||||||||||||||||
(Dollar amounts in millions) |
Fair value |
Gross unrealized losses |
Number of securities |
Fair value |
Gross unrealized losses |
Number of securities |
Fair value |
Gross unrealized losses |
Number of securities |
|||||||||||||||||||||||||||
Description of Securities |
||||||||||||||||||||||||||||||||||||
U.S. corporate: |
||||||||||||||||||||||||||||||||||||
Utilities |
$ | $ | ( |
) | $ | $ | ( |
) | $ | $ | ( |
) | ||||||||||||||||||||||||
Energy |
( |
) | ( |
) | ( |
) | ||||||||||||||||||||||||||||||
Finance and insurance |
( |
) | ( |
) | ( |
) | ||||||||||||||||||||||||||||||
Consumer—non-cyclical |
( |
) | ( |
) | ( |
) | ||||||||||||||||||||||||||||||
Technology and communications |
( |
) | ( |
) | ( |
) | ||||||||||||||||||||||||||||||
Industrial |
( |
) | ( |
) | ( |
) | ||||||||||||||||||||||||||||||
Capital goods |
( |
) | ( |
) | ( |
) | ||||||||||||||||||||||||||||||
Consumer—cyclical |
( |
) | ( |
) | ( |
) | ||||||||||||||||||||||||||||||
Transportation |
( |
) | ( |
) | ( |
) | ||||||||||||||||||||||||||||||
Other |
( |
) | ( |
) | ( |
) | ||||||||||||||||||||||||||||||
|
|
|
|
|
|
|
|
|
|
|
|
|
|
|
|
|
|
|||||||||||||||||||
Subtotal, U.S. corporate securities |
( |
) | ( |
) | ( |
) | ||||||||||||||||||||||||||||||
|
|
|
|
|
|
|
|
|
|
|
|
|
|
|
|
|
|
|||||||||||||||||||
Non-U.S. corporate: |
||||||||||||||||||||||||||||||||||||
Utilities |
( |
) | ( |
) | ( |
) | ||||||||||||||||||||||||||||||
Energy |
( |
) | ( |
) | ( |
) | ||||||||||||||||||||||||||||||
Finance and insurance |
( |
) | ( |
) | ( |
) | ||||||||||||||||||||||||||||||
Consumer—non-cyclical |
( |
) | ( |
) | ( |
) | ||||||||||||||||||||||||||||||
Technology and communications |
( |
) | ( |
) | ( |
) | ||||||||||||||||||||||||||||||
Industrial |
( |
) | ( |
) | ( |
) | ||||||||||||||||||||||||||||||
Capital goods |
( |
) | ( |
) | ( |
) | ||||||||||||||||||||||||||||||
Consumer—cyclical |
( |
) | ( |
) | ( |
) | ||||||||||||||||||||||||||||||
Transportation |
( |
) | ( |
) | ( |
) | ||||||||||||||||||||||||||||||
Other |
( |
) | ( |
) | ( |
) | ||||||||||||||||||||||||||||||
|
|
|
|
|
|
|
|
|
|
|
|
|
|
|
|
|
|
|||||||||||||||||||
Subtotal, non-U.S. corporate securities |
( |
) | ( |
) | ( |
) | ||||||||||||||||||||||||||||||
|
|
|
|
|
|
|
|
|
|
|
|
|
|
|
|
|
|
|||||||||||||||||||
Total for in an unrealized loss position |
$ | $ | ( |
) | $ | $ | ( |
) | $ | $ | ( |
) | ||||||||||||||||||||||||
|
|
|
|
|
|
|
|
|
|
|
|
|
|
|
|
|
|
(Amounts in millions) |
Amortized cost or cost |
Fair value |
||||||
Due one year or less |
$ | $ | ||||||
Due after one year through five years |
||||||||
Due after five years through ten years |
||||||||
Due after ten years |
||||||||
|
|
|
|
|||||
Subtotal |
||||||||
Residential mortgage-backed |
||||||||
Commercial mortgage-backed |
||||||||
Other asset-backed |
||||||||
|
|
|
|
|||||
Total |
$ | $ | ||||||
|
|
|
|
2023 |
2022 |
|||||||||||||||
(Amounts in millions) |
Carrying value |
% of total |
Carrying value |
% of total |
||||||||||||
Property type: |
||||||||||||||||
Retail |
$ | % | $ | % | ||||||||||||
Office |
||||||||||||||||
Industrial |
||||||||||||||||
Apartments |
||||||||||||||||
Mixed use |
||||||||||||||||
Other |
||||||||||||||||
|
|
|
|
|
|
|
|
|||||||||
Subtotal |
% | % | ||||||||||||||
|
|
|
|
|||||||||||||
Allowance for credit losses |
( |
) | ( |
) | ||||||||||||
|
|
|
|
|||||||||||||
Total |
$ | $ | ||||||||||||||
|
|
|
|
2023 |
2022 |
|||||||||||||||
(Amounts in millions) |
Carrying value |
% of total |
Carrying value |
% of total |
||||||||||||
Geographic region: |
||||||||||||||||
South Atlantic |
$ | % | $ | % | ||||||||||||
Pacific |
||||||||||||||||
Mountain |
||||||||||||||||
Middle Atlantic |
||||||||||||||||
West South Central |
||||||||||||||||
East North Central |
||||||||||||||||
West North Central |
||||||||||||||||
East South Central |
||||||||||||||||
New England |
||||||||||||||||
|
|
|
|
|
|
|
|
|||||||||
Subtotal |
% | % | ||||||||||||||
|
|
|
|
|||||||||||||
Allowance for credit losses |
( |
) | ( |
) | ||||||||||||
|
|
|
|
|||||||||||||
Total |
$ | $ | ||||||||||||||
|
|
|
|
(Amounts in millions) |
2023 |
2022 |
2021 |
|||||||||
Allowance for credit losses: |
||||||||||||
Beginning balance |
$ | $ | $ | |||||||||
Provision |
( |
) | ||||||||||
Write-offs |
( |
) | ||||||||||
Recoveries |
||||||||||||
|
|
|
|
|
|
|||||||
Ending balance |
$ | $ | $ | |||||||||
|
|
|
|
|
|
(Amounts in millions) |
2023 |
2022 |
2021 |
2020 |
2019 |
2018 and prior |
Total |
|||||||||||||||||||||
Debt-to-value: |
||||||||||||||||||||||||||||
0%–50% |
$ | $ | $ | $ | $ | $ | $ | |||||||||||||||||||||
51%–60% |
||||||||||||||||||||||||||||
61%–75% |
||||||||||||||||||||||||||||
76%–100% |
||||||||||||||||||||||||||||
Greater than 100% |
||||||||||||||||||||||||||||
|
|
|
|
|
|
|
|
|
|
|
|
|
|
|||||||||||||||
Total amortized cost |
$ | $ | $ | $ | $ | $ | $ | |||||||||||||||||||||
|
|
|
|
|
|
|
|
|
|
|
|
|
|
|||||||||||||||
Debt service coverage ratio: |
||||||||||||||||||||||||||||
Less than 1.00 |
$ | $ | $ | $ | $ | $ | $ | |||||||||||||||||||||
1.00–1.25 |
||||||||||||||||||||||||||||
1.26–1.50 |
||||||||||||||||||||||||||||
1.51–2.00 |
||||||||||||||||||||||||||||
Greater than 2.00 |
||||||||||||||||||||||||||||
|
|
|
|
|
|
|
|
|
|
|
|
|
|
|||||||||||||||
Total amortized cost |
$ | $ | $ | $ | $ | $ | $ | |||||||||||||||||||||
|
|
|
|
|
|
|
|
|
|
|
|
|
|
2023 |
||||||||||||||||||||||||
(Amounts in millions) |
0%–50% |
51%–60% |
61%–75% |
76%–100% |
Greater than 100% |
Total |
||||||||||||||||||
Property type: |
||||||||||||||||||||||||
Retail |
$ | $ | $ | $ | $ | $ | ||||||||||||||||||
Office |
||||||||||||||||||||||||
Industrial |
||||||||||||||||||||||||
Apartments |
||||||||||||||||||||||||
Mixed use |
||||||||||||||||||||||||
Other |
||||||||||||||||||||||||
|
|
|
|
|
|
|
|
|
|
|
|
|||||||||||||
Total amortized cost |
$ | $ | $ | $ | $ | $ | ||||||||||||||||||
|
|
|
|
|
|
|
|
|
|
|
|
|||||||||||||
% of total |
% | % | % | % | % | % | ||||||||||||||||||
|
|
|
|
|
|
|
|
|
|
|
|
|||||||||||||
Weighted-average debt service coverage ratio |
||||||||||||||||||||||||
|
|
|
|
|
|
|
|
|
|
|
|
2022 |
||||||||||||||||||||||||
(Amounts in millions) |
0%–50% |
51%–60% |
61%–75% |
76%–100% |
Greater than 100% |
Total |
||||||||||||||||||
Property type: |
||||||||||||||||||||||||
Retail |
$ | $ | $ | $ | $ | $ | ||||||||||||||||||
Office |
||||||||||||||||||||||||
Industrial |
||||||||||||||||||||||||
Apartments |
||||||||||||||||||||||||
Mixed use |
||||||||||||||||||||||||
Other |
||||||||||||||||||||||||
|
|
|
|
|
|
|
|
|
|
|
|
|||||||||||||
Total amortized cost |
$ | $ | $ | $ | $ | $ | ||||||||||||||||||
|
|
|
|
|
|
|
|
|
|
|
|
|||||||||||||
% of total |
% | % | % | % | % | % | ||||||||||||||||||
|
|
|
|
|
|
|
|
|
|
|
|
|||||||||||||
Weighted-average debt service coverage ratio |
||||||||||||||||||||||||
|
|
|
|
|
|
|
|
|
|
|
|
2023 |
||||||||||||||||||||||||
(Amounts in millions) |
Less than 1.00 |
1.00–1.25 |
1.26–1.50 |
1.51–2.00 |
Greater than 2.00 |
Total |
||||||||||||||||||
Property type: |
||||||||||||||||||||||||
Retail |
$ | $ | $ | $ | $ | $ | ||||||||||||||||||
Office |
||||||||||||||||||||||||
Industrial |
||||||||||||||||||||||||
Apartments |
||||||||||||||||||||||||
Mixed use |
||||||||||||||||||||||||
Other |
||||||||||||||||||||||||
|
|
|
|
|
|
|
|
|
|
|
|
|||||||||||||
Total amortized cost |
$ | $ | $ | $ | $ | $ | ||||||||||||||||||
|
|
|
|
|
|
|
|
|
|
|
|
|||||||||||||
% of total |
% | % | % | % | % | % | ||||||||||||||||||
|
|
|
|
|
|
|
|
|
|
|
|
|||||||||||||
Weighted-average debt-to-value |
% | % | % | % | % | % | ||||||||||||||||||
|
|
|
|
|
|
|
|
|
|
|
|
2022 |
||||||||||||||||||||||||
(Amounts in millions) |
Less than 1.00 |
1.00–1.25 |
1.26–1.50 |
1.51–2.00 |
Greater than 2.00 |
Total |
||||||||||||||||||
Property type: |
||||||||||||||||||||||||
Retail |
$ | $ | $ | $ | $ | $ | ||||||||||||||||||
Office |
||||||||||||||||||||||||
Industrial |
||||||||||||||||||||||||
Apartments |
||||||||||||||||||||||||
Mixed use |
||||||||||||||||||||||||
Other |
||||||||||||||||||||||||
|
|
|
|
|
|
|
|
|
|
|
|
|||||||||||||
Total amortized cost |
$ | $ | $ | $ | $ | $ | ||||||||||||||||||
|
|
|
|
|
|
|
|
|
|
|
|
|||||||||||||
% of total |
% | % | % | % | % | % | ||||||||||||||||||
|
|
|
|
|
|
|
|
|
|
|
|
|||||||||||||
Weighted-average debt-to-value |
% | % | % | % | % | % | ||||||||||||||||||
|
|
|
|
|
|
|
|
|
|
|
|
Derivative assets |
Derivative liabilities |
|||||||||||||||||||||||
Balance sheet classification |
Fair value |
Balance sheet classification |
Fair value |
|||||||||||||||||||||
(Amounts in millions) |
2023 |
2022 |
2023 |
2022 |
||||||||||||||||||||
Derivatives designated as hedges |
||||||||||||||||||||||||
Cash flow hedges: |
||||||||||||||||||||||||
Interest rate swaps |
|
Other invested assets | |
$ | $ | |
Other liabilities | |
$ | $ | ||||||||||||||
Foreign currency swaps |
|
Other invested assets | |
|
Other liabilities | |
||||||||||||||||||
Forward bond purchase commitments |
|
Other invested assets | |
|
Other liabilities | |
||||||||||||||||||
|
|
|
|
|
|
|
|
|
|
|
|
|||||||||||||
Total cash flow hedges |
|
|
|
|
||||||||||||||||||||
|
|
|
|
|
|
|
|
|
|
|
|
|||||||||||||
Total derivatives designated as hedges |
|
|
|
|
||||||||||||||||||||
|
|
|
|
|
|
|
|
|
|
|
|
|||||||||||||
Derivatives not designated as hedges |
|
|
|
|
||||||||||||||||||||
Equity index options |
|
Other invested assets | |
|
Other liabilities | |
||||||||||||||||||
Financial futures (1) |
|
Other invested assets | |
|
Other liabilities | |
||||||||||||||||||
Forward bond purchase commitments |
|
Other invested assets | |
|
Other liabilities | |
||||||||||||||||||
Fixed indexed annuity embedded derivatives |
|
Other assets | |
|
Policyholder account balances (2) |
|
||||||||||||||||||
Indexed universal life embedded derivatives |
|
Reinsurance recoverable |
|
|
Policyholder account balances (3) |
|
||||||||||||||||||
|
|
|
|
|
|
|
|
|
|
|
|
|||||||||||||
Total derivatives not designated as hedges |
|
|
|
|
||||||||||||||||||||
|
|
|
|
|
|
|
|
|
|
|
|
|||||||||||||
Total derivatives |
|
|
$ | $ | |
|
$ | $ | ||||||||||||||||
|
|
|
|
|
|
|
|
|
|
|
|
(1) |
The period end valuations of financial futures were zero as a result of settling the margins on these contracts on a daily basis. |
(2) |
Represents the embedded derivatives associated with our fixed indexed annuity liabilities. |
(3) |
Represents the embedded derivatives associated with our indexed universal life liabilities. |
(Notional in millions) |
Measurement |
December 31, 2022 |
Additions |
Maturities/ terminations |
December 31, 2023 |
|||||||||||||||
Derivatives designated as hedges |
||||||||||||||||||||
Cash flow hedges: |
||||||||||||||||||||
Interest rate swaps |
Notional | $ | $ | $ | ( |
) | $ | |||||||||||||
Foreign currency swaps |
Notional | ( |
) | |||||||||||||||||
Forward bond purchase commitments |
Notional | |||||||||||||||||||
|
|
|
|
|
|
|
|
|||||||||||||
Total cash flow hedges |
( |
) | ||||||||||||||||||
|
|
|
|
|
|
|
|
|||||||||||||
Total derivatives designated as hedges |
( |
) | ||||||||||||||||||
|
|
|
|
|
|
|
|
|||||||||||||
Derivatives not designated as hedges |
||||||||||||||||||||
Equity index options |
Notional | ( |
) | |||||||||||||||||
Financial futures |
Notional | ( |
) | |||||||||||||||||
Forward bond purchase commitments |
Notional | |||||||||||||||||||
|
|
|
|
|
|
|
|
|||||||||||||
Total derivatives not designated as hedges |
( |
) | ||||||||||||||||||
|
|
|
|
|
|
|
|
|||||||||||||
Total derivatives |
$ | $ | $ | ( |
) | $ | ||||||||||||||
|
|
|
|
|
|
|
|
(Number of policies) |
Measurement |
December 31, 2022 |
Additions |
Maturities/ terminations |
December 31, 2023 |
|||||||||||||||
Derivatives not designated as hedges |
||||||||||||||||||||
Fixed indexed annuity embedded derivatives |
Policies | ( |
) | |||||||||||||||||
Indexed universal life embedded derivatives |
Policies | ( |
) |
(Amounts in millions) |
Gain (loss) recognized in OCI |
Gain (loss) reclassified into net income from OCI |
Classification of gain (loss) reclassified into net income |
Gain (loss) recognized in net income |
Classification of gain (loss) recognized in net income | |||||||||||
Interest rate swaps hedging assets |
$ | ( |
) | $ | Net investment income | $ | Net investment gains (losses) | |||||||||
Interest rate swaps hedging assets |
Net investment gains (losses) | Net investment gains (losses) | ||||||||||||||
Interest rate swaps hedging |
( |
) | Interest expense | Net investment gains (losses) | ||||||||||||
Interest rate swaps hedging liabilities |
Net investment gains (losses) | Net investment gains (losses) | ||||||||||||||
Forward bond purchase |
Net investment gains (losses) | Net investment gains (losses) | ||||||||||||||
Foreign currency swaps |
( |
) | Net investment income | Net investment gains (losses) | ||||||||||||
Foreign currency swaps |
Net investment gains (losses) | Net investment gains (losses) | ||||||||||||||
|
|
|
|
|
|
|||||||||||
Total |
$ | ( |
) | $ | $ | |||||||||||
|
|
|
|
|
|
(Amounts in millions) |
Gain (loss) recognized in OCI |
Gain (loss) reclassified into net income from OCI |
Classification of gain (loss) reclassified into net income |
Gain (loss) recognized in net income |
Classification of gain (loss) recognized in net income | |||||||||||
Interest rate swaps hedging assets |
$ | ( |
) | $ | Net investment income | $ | Net investment gains (losses) | |||||||||
Interest rate swaps hedging assets |
Net investment gains (losses) | Net investment gains (losses) | ||||||||||||||
Interest rate swaps hedging |
( |
) | Interest expense | Net investment gains (losses) | ||||||||||||
Foreign currency swaps |
Net investment income | Net investment gains (losses) | ||||||||||||||
|
|
|
|
|
|
|||||||||||
Total |
$ | ( |
) | $ | $ | |||||||||||
|
|
|
|
|
|
(Amounts in millions) |
Gain (loss) recognized in OCI |
Gain (loss) reclassified into net income from OCI |
Classification of gain (loss) reclassified into net income |
Gain (loss) recognized in net income |
Classification of gain (loss) recognized in net income | |||||||||||
Interest rate swaps hedging assets |
$ | ( |
) | $ | Net investment income | $ | Net investment gains (losses) | |||||||||
Interest rate swaps hedging assets |
Net investment gains (losses) | Net investment gains (losses) | ||||||||||||||
Interest rate swaps hedging liabilities |
( |
) | Interest expense | Net investment gains (losses) | ||||||||||||
Foreign currency swaps |
Net investment income | Net investment gains (losses) | ||||||||||||||
|
|
|
|
|
|
|||||||||||
Total |
$ | ( |
) | $ | $ | |||||||||||
|
|
|
|
|
|
(Amounts in millions) |
2023 |
2022 |
2021 |
|||||||||
Derivatives qualifying as effective accounting hedges as of January 1 |
$ | $ | $ | |||||||||
Current period increases (decreases) in fair value, net of deferred taxes of $ |
( |
) | ( |
) | ( |
) | ||||||
Reclassification to net (income), net of deferred taxes of $ |
( |
) | ( |
) | ( |
) | ||||||
|
|
|
|
|
|
|||||||
Derivatives qualifying as effective accounting hedges as of December 31 |
$ | $ | $ | |||||||||
|
|
|
|
|
|
(Amounts in millions) |
2023 |
2022 |
2021 |
Classification of gain (loss) recognized in net income | ||||||||||
Interest rate swaps |
$ | $ | $ | Net investment gains (losses) | ||||||||||
Equity index options |
( |
) | Net investment gains (losses) | |||||||||||
Financial futures |
( |
) | ( |
) | ( |
) | Changes in fair value of market risk benefits and associated hedges | |||||||
Forward bond purchase commitments |
( |
) | Net investment gains (losses) | |||||||||||
Fixed indexed annuity embedded derivatives |
( |
) | ( |
) | Net investment gains (losses) | |||||||||
Indexed universal life embedded derivatives |
Net investment gains (losses) | |||||||||||||
|
|
|
|
|
|
|||||||||
Total derivatives not designated as hedges |
$ | ( |
) | $ | ( |
) | $ | ( |
) | |||||
|
|
|
|
|
|
2023 |
2022 |
|||||||||||||||||||||||
(Amounts in millions) |
Derivative assets (1) |
Derivative liabilities (1) |
Net derivatives |
Derivative assets (1) |
Derivative liabilities (1) |
Net derivatives |
||||||||||||||||||
Amounts presented in the balance sheet: |
||||||||||||||||||||||||
Gross amounts recognized |
$ | $ | $ | ( |
) | $ | $ | $ | ( |
) | ||||||||||||||
Gross amounts offset in the balance sheet |
||||||||||||||||||||||||
|
|
|
|
|
|
|
|
|
|
|
|
|||||||||||||
Net amounts presented in the balance sheet |
( |
) | ( |
) | ||||||||||||||||||||
Gross amounts not offset in the balance sheet: |
||||||||||||||||||||||||
Financial instruments (2) |
( |
) | ( |
) | ( |
) | ( |
) | ||||||||||||||||
Collateral received |
( |
) | ( |
) | ( |
) | ( |
) | ||||||||||||||||
Collateral pledged |
( |
) | ( |
) | ||||||||||||||||||||
Over collateralization |
( |
) | ( |
) | ||||||||||||||||||||
|
|
|
|
|
|
|
|
|
|
|
|
|||||||||||||
Net amount |
$ | $ | $ | $ | $ | $ | ||||||||||||||||||
|
|
|
|
|
|
|
|
|
|
|
|
(1) |
Does not include amounts related to embedded derivatives as of December 31, 2023 and 2022. |
(2) |
Amounts represent derivative assets and/or liabilities that are presented gross within the balance sheet but are held with the same counterparty where we have a master netting arrangement. This adjustment results in presenting the net asset and net liability position for each counterparty. |
December 31, 2023 |
||||||||||||||||||||
(Amounts in millions) |
Long-term care insurance |
Life insurance |
Fixed annuities |
Variable annuities |
Total |
|||||||||||||||
Balance as of January 1 |
$ | $ | $ | $ | $ | |||||||||||||||
Costs deferred |
||||||||||||||||||||
Amortization |
( |
) | ( |
) | ( |
) | ( |
) | ( |
) | ||||||||||
|
|
|
|
|
|
|
|
|
|
|||||||||||
Balance as of December 31 |
$ | $ | $ | $ | ||||||||||||||||
|
|
|
|
|
|
|
|
|||||||||||||
Enact segment |
||||||||||||||||||||
|
|
|||||||||||||||||||
Total deferred acquisition costs |
$ | |||||||||||||||||||
|
|
December 31, 2022 |
||||||||||||||||||||
(Amounts in millions) |
Long-term care insurance |
Life insurance |
Fixed annuities |
Variable annuities |
Total |
|||||||||||||||
Balance as of January 1 |
$ | $ | $ | $ | $ | |||||||||||||||
Costs deferred |
||||||||||||||||||||
Amortization |
( |
) | ( |
) | ( |
) | ( |
) | ( |
) | ||||||||||
|
|
|
|
|
|
|
|
|
|
|||||||||||
Balance as of December 31 |
$ | $ | $ | $ | ||||||||||||||||
|
|
|
|
|
|
|
|
|||||||||||||
Enact segment |
||||||||||||||||||||
|
|
|||||||||||||||||||
Total deferred acquisition costs |
$ | |||||||||||||||||||
|
|
December 31, 2021 |
||||||||||||||||||||
(Amounts in millions) |
Long-term care insurance |
Life insurance |
Fixed annuities |
Variable annuities |
Total |
|||||||||||||||
Balance as of January 1 |
$ | $ | $ | $ | $ | |||||||||||||||
Costs deferred |
||||||||||||||||||||
Amortization |
( |
) | ( |
) | ( |
) | ( |
) | ( |
) | ||||||||||
|
|
|
|
|
|
|
|
|
|
|||||||||||
Balance as of December 31 |
$ | $ | $ | $ | ||||||||||||||||
|
|
|
|
|
|
|
|
|||||||||||||
Enact segment |
||||||||||||||||||||
|
|
|||||||||||||||||||
Total deferred acquisition costs |
$ | |||||||||||||||||||
|
|
2023 |
2022 |
|||||||||||||||
(Amounts in millions) |
Gross carrying amount |
Accumulated amortization |
Gross carrying amount |
Accumulated amortization |
||||||||||||
PVFP |
$ | $ | ( |
) | $ | $ | ( |
) | ||||||||
Capitalized software |
( |
) | ( |
) | ||||||||||||
Deferred sales inducements to contractholders |
( |
) | ( |
) | ||||||||||||
Other |
( |
) | ( |
) | ||||||||||||
|
|
|
|
|
|
|
|
|||||||||
Total |
$ | $ | ( |
) | $ | $ | ( |
) | ||||||||
|
|
|
|
|
|
|
|
(Amounts in millions) |
2023 |
2022 |
2021 |
|||||||||
Beginning balance as of January 1 |
$ | $ | $ | |||||||||
Costs deferred |
||||||||||||
Amortization |
( |
) | ( |
) | ( |
) | ||||||
|
|
|
|
|
|
|||||||
Ending balance |
$ | $ | $ | |||||||||
|
|
|
|
|
|
2024 |
% | |||
2025 |
% | |||
2026 |
% | |||
2027 |
% | |||
2028 |
% |
(Amounts in millions) |
2023 |
2022 |
2021 |
|||||||||
Direct life insurance in-force |
$ | $ | $ | |||||||||
Amounts assumed from other companies |
||||||||||||
Amounts ceded to other companies (1) |
( |
) | ( |
) | ( |
) | ||||||
|
|
|
|
|
|
|||||||
Net life insurance in-force |
$ | $ | $ | |||||||||
|
|
|
|
|
|
|||||||
Percentage of amount assumed to net |
% | % | % | |||||||||
|
|
|
|
|
|
(1) |
Includes amounts accounted for under the deposit method. |
Written |
Earned |
|||||||||||||||||||||||
(Amounts in millions) |
2023 |
2022 |
2021 |
2023 |
2022 |
2021 |
||||||||||||||||||
Direct: |
||||||||||||||||||||||||
Life insurance |
$ | $ | $ | $ | $ | $ | ||||||||||||||||||
Accident and health insurance (1) |
||||||||||||||||||||||||
Mortgage insurance |
||||||||||||||||||||||||
|
|
|
|
|
|
|
|
|
|
|
|
|||||||||||||
Total direct |
||||||||||||||||||||||||
|
|
|
|
|
|
|
|
|
|
|
|
|||||||||||||
Assumed: |
||||||||||||||||||||||||
Life insurance |
||||||||||||||||||||||||
Accident and health insurance (1) |
||||||||||||||||||||||||
Mortgage insurance |
||||||||||||||||||||||||
|
|
|
|
|
|
|
|
|
|
|
|
|||||||||||||
Total assumed |
||||||||||||||||||||||||
|
|
|
|
|
|
|
|
|
|
|
|
|||||||||||||
Ceded: |
||||||||||||||||||||||||
Life insurance (2) |
( |
) | ( |
) | ( |
) | ( |
) | ( |
) | ( |
) | ||||||||||||
Accident and health insurance (1) |
( |
) | ( |
) | ( |
) | ( |
) | ( |
) | ( |
) | ||||||||||||
Mortgage insurance |
( |
) | ( |
) | ( |
) | ( |
) | ( |
) | ( |
) | ||||||||||||
|
|
|
|
|
|
|
|
|
|
|
|
|||||||||||||
Total ceded |
( |
) | ( |
) | ( |
) | ( |
) | ( |
) | ( |
) | ||||||||||||
|
|
|
|
|
|
|
|
|
|
|
|
|||||||||||||
Net premiums |
$ | $ | $ | $ | $ | $ | ||||||||||||||||||
|
|
|
|
|
|
|
|
|
|
|
|
|||||||||||||
Percentage of amount assumed to net |
% | % | % | |||||||||||||||||||||
|
|
|
|
|
|
(1) |
Accident and health insurance is comprised of our long-term care insurance products. |
(2) |
Effective December 1, 2021 and included in the year ended December 31, 2021, we entered into a reinsurance agreement with SCOR Global Life USA Reinsurance Company, under which we ceded premiums of $ |
(Amounts in millions) |
2023 |
2022 |
2021 |
|||||||||
Allowance for credit losses: |
||||||||||||
Beginning balance |
$ | $ | $ | |||||||||
Provision |
||||||||||||
Write-offs |
( |
) | ||||||||||
Recoveries |
||||||||||||
|
|
|
|
|
|
|||||||
Ending balance |
$ | $ | $ | |||||||||
|
|
|
|
|
|
2023 |
||||||||||||
(Amounts in millions) |
Collateralized |
Non-collateralized |
Total |
|||||||||
Credit rating: |
||||||||||||
A++ |
$ | $ | $ | |||||||||
A+ |
||||||||||||
A |
||||||||||||
Not rated (1) |
||||||||||||
|
|
|
|
|
|
|||||||
Total reinsurance recoverable |
$ | $ | $ | |||||||||
|
|
|
|
|
|
2022 |
||||||||||||
(Amounts in millions) |
Collateralized |
Non-collateralized |
Total |
|||||||||
Credit rating: |
||||||||||||
A++ |
$ | $ | $ | |||||||||
A+ |
||||||||||||
A |
||||||||||||
Not rated (1) |
||||||||||||
|
|
|
|
|
|
|||||||
Total reinsurance recoverable |
$ | $ | $ | |||||||||
|
|
|
|
|
|
(1) |
Primarily relates to amounts associated with UFLIC, which is not rated. However, UFLIC has trust accounts and a guarantee from its parent, as discussed above, and is sufficiently collateralized and fully collectible; accordingly, no allowance for credit losses was recorded as of December 31, 2023 and 2022. |
(Amounts in millions) |
2023 |
2022 |
||||||
Long-term care insurance |
$ | $ | ||||||
Life insurance |
||||||||
Fixed annuities |
||||||||
|
|
|
|
|||||
Total long-duration insurance contracts |
||||||||
|
|
|
|
|||||
Deferred profit liability |
||||||||
Cost of reinsurance |
||||||||
|
|
|
|
|||||
Total future policy benefits |
$ | $ | ||||||
|
|
|
|
2023 |
||||||||||||
(Dollar amounts in millions) |
Long-term care insurance |
Life insurance |
Fixed annuities |
|||||||||
Present value of expected net premiums: |
||||||||||||
Beginning balance as of January 1 |
$ | $ | $ | |||||||||
Beginning balance, at original discount rate |
$ | $ | $ | |||||||||
Effect of changes in cash flow assumptions |
( |
) | ||||||||||
Effect of actual variances from expected experience |
( |
) | ||||||||||
|
|
|
|
|
|
|||||||
Adjusted beginning balance |
||||||||||||
Issuances |
||||||||||||
Interest accretion |
||||||||||||
Net premiums collected (1) |
( |
) | ( |
) | ( |
) | ||||||
Derecognition (lapses and withdrawals) |
||||||||||||
Other |
||||||||||||
|
|
|
|
|
|
|||||||
Ending balance, at original discount rate |
||||||||||||
Effect of changes in discount rate assumptions |
||||||||||||
|
|
|
|
|
|
|||||||
Ending balance as of December 31 |
$ | $ | $ | |||||||||
|
|
|
|
|
|
|||||||
Present value of expected future policy benefits: |
||||||||||||
Beginning balance as of January 1 |
$ | $ | $ | |||||||||
Beginning balance, at original discount rate |
$ | $ | $ | |||||||||
Effect of changes in cash flow assumptions |
( |
) | ( |
) | ||||||||
Effect of actual variances from expected experience |
( |
) | ( |
) | ||||||||
|
|
|
|
|
|
|||||||
Adjusted beginning balance |
||||||||||||
Issuances |
||||||||||||
Interest accretion |
||||||||||||
Benefit payments |
( |
) | ( |
) | ( |
) | ||||||
Derecognition (lapses and withdrawals) |
||||||||||||
Other |
( |
) | ( |
) | ||||||||
|
|
|
|
|
|
|||||||
Ending balance, at original discount rate |
||||||||||||
Effect of changes in discount rate assumptions |
||||||||||||
|
|
|
|
|
|
|||||||
Ending balance as of December 31 |
$ | $ | $ | |||||||||
|
|
|
|
|
|
|||||||
Net liability for future policy benefits, before flooring adjustments |
$ | $ | $ | |||||||||
Flooring adjustments (2) |
||||||||||||
|
|
|
|
|
|
|||||||
Net liability for future policy benefits |
||||||||||||
Less: reinsurance recoverable |
||||||||||||
|
|
|
|
|
|
|||||||
Net liability for future policy benefits, net of reinsurance recoverable |
$ | $ | $ | |||||||||
|
|
|
|
|
|
|||||||
Weighted-average liability duration (years) |
(1) |
Net premiums collected represents the portion of gross premiums collected from policyholders that is used to fund expected benefit payments. |
(2) |
See note 2 for a discussion of flooring adjustments. |
2022 |
||||||||||||
(Dollar amounts in millions) |
Long-term care insurance |
Life insurance |
Fixed annuities |
|||||||||
Present value of expected net premiums: |
||||||||||||
Beginning balance as of January 1 |
$ | $ | $ | |||||||||
Beginning balance, at original discount rate |
$ | $ | $ | |||||||||
Effect of changes in cash flow assumptions |
||||||||||||
Effect of actual variances from expected experience |
||||||||||||
|
|
|
|
|
|
|||||||
Adjusted beginning balance |
||||||||||||
Issuances |
||||||||||||
Interest accretion |
||||||||||||
Net premiums collected (1) |
( |
) | ( |
) | ( |
) | ||||||
Derecognition (lapses and withdrawals) |
||||||||||||
Other |
||||||||||||
|
|
|
|
|
|
|||||||
Ending balance, at original discount rate |
||||||||||||
Effect of changes in discount rate assumptions |
( |
) | ||||||||||
|
|
|
|
|
|
|||||||
Ending balance as of December 31 |
$ | $ | $ | |||||||||
|
|
|
|
|
|
|||||||
Present value of expected future policy benefits: |
||||||||||||
Beginning balance as of January 1 |
$ | $ | $ | |||||||||
Beginning balance, at original discount rate |
$ | $ | $ | |||||||||
Effect of changes in cash flow assumptions |
( |
) | ||||||||||
Effect of actual variances from expected experience |
( |
) | ( |
) | ||||||||
|
|
|
|
|
|
|||||||
Adjusted beginning balance |
||||||||||||
Issuances |
||||||||||||
Interest accretion |
||||||||||||
Benefit payments |
( |
) | ( |
) | ( |
) | ||||||
Derecognition (lapses and withdrawals) |
||||||||||||
Reinsurance transactions (2) |
( |
) | ||||||||||
Other |
||||||||||||
|
|
|
|
|
|
|||||||
Ending balance, at original discount rate |
||||||||||||
Effect of changes in discount rate assumptions |
||||||||||||
|
|
|
|
|
|
|||||||
Ending balance as of December 31 |
$ | $ | $ | |||||||||
|
|
|
|
|
|
|||||||
Net liability for future policy benefits, before flooring adjustments |
$ | $ | $ | |||||||||
Flooring adjustments (3) |
||||||||||||
|
|
|
|
|
|
|||||||
Net liability for future policy benefits |
||||||||||||
Less: reinsurance recoverable |
||||||||||||
|
|
|
|
|
|
|||||||
Net liability for future policy benefits, net of reinsurance recoverable |
$ | $ | $ | |||||||||
|
|
|
|
|
|
|||||||
Weighted-average liability duration (years) |
(1) |
Net premiums collected represents the portion of gross premiums collected from policyholders that is used to fund expected benefit payments. |
(2) |
Related to a third-party recapture of certain single premium immediate annuity contracts in 2022. |
(3) |
See note 2 for a discussion of flooring adjustments. |
2021 |
||||||||||||
(Dollar amounts in millions) |
Long-term care insurance |
Life insurance |
Fixed annuities |
|||||||||
Present value of expected net premiums: |
||||||||||||
Beginning balance as of January 1 |
$ | $ | $ | |||||||||
Beginning balance, at original discount rate |
$ | $ | $ | |||||||||
Effect of changes in cash flow assumptions |
||||||||||||
Effect of actual variances from expected experience |
( |
) | ||||||||||
|
|
|
|
|
|
|||||||
Adjusted beginning balance |
||||||||||||
Issuances |
||||||||||||
Interest accretion |
||||||||||||
Net premiums collected (1) |
( |
) | ( |
) | ( |
) | ||||||
Derecognition (lapses and withdrawals) |
||||||||||||
Other |
||||||||||||
|
|
|
|
|
|
|||||||
Ending balance, at original discount rate |
||||||||||||
Effect of changes in discount rate assumptions |
||||||||||||
|
|
|
|
|
|
|||||||
Ending balance as of December 31 |
$ | $ | $ | |||||||||
|
|
|
|
|
|
|||||||
Present value of expected future policy benefits: |
||||||||||||
Beginning balance as of January 1 |
$ | $ | $ | |||||||||
Beginning balance, at original discount rate |
$ | $ | $ | |||||||||
Effect of changes in cash flow assumptions |
||||||||||||
Effect of actual variances from expected experience |
( |
) | ( |
) | ||||||||
|
|
|
|
|
|
|||||||
Adjusted beginning balance |
||||||||||||
Issuances |
||||||||||||
Interest accretion |
||||||||||||
Benefit payments |
( |
) | ( |
) | ( |
) | ||||||
Derecognition (lapses and withdrawals) |
||||||||||||
Other |
( |
) | ( |
) | ||||||||
|
|
|
|
|
|
|||||||
Ending balance, at original discount rate |
||||||||||||
Effect of changes in discount rate assumptions |
||||||||||||
|
|
|
|
|
|
|||||||
Ending balance as of December 31 |
$ | $ | $ | |||||||||
|
|
|
|
|
|
|||||||
Net liability for future policy benefits, before flooring adjustments |
$ | $ | $ | |||||||||
Flooring adjustments (2) |
||||||||||||
|
|
|
|
|
|
|||||||
Net liability for future policy benefits |
||||||||||||
Less: reinsurance recoverable |
||||||||||||
|
|
|
|
|
|
|||||||
Net liability for future policy benefits, net of reinsurance recoverable |
$ | $ | $ | |||||||||
|
|
|
|
|
|
|||||||
Weighted-average liability duration (years) |
(1) |
Net premiums collected represents the portion of gross premiums collected from policyholders that is used to fund expected benefit payments. |
(2) |
See note 2 for a discussion on flooring adjustments. |
2023 |
2022 |
2021 |
||||||||||
Long-term care insurance |
||||||||||||
Interest accretion (locked-in) rate |
% | % | % | |||||||||
Current discount rate |
% | % | % | |||||||||
Life insurance |
||||||||||||
Interest accretion (locked-in) rate |
% | % | % | |||||||||
Current discount rate |
% | % | % | |||||||||
Fixed annuities |
||||||||||||
Interest accretion (locked-in) rate |
% | % | % | |||||||||
Current discount rate |
% | % | % |
2023 |
2022 |
2021 |
||||||||||||||||||||||
(Amounts in millions) |
Undiscounted |
Discounted |
Undiscounted |
Discounted |
Undiscounted |
Discounted |
||||||||||||||||||
Long-term care insurance |
||||||||||||||||||||||||
Expected future gross premiums |
$ | $ | $ | $ | $ | $ | ||||||||||||||||||
Expected future benefit payments |
$ | $ | $ | $ | $ | $ | ||||||||||||||||||
Life insurance |
||||||||||||||||||||||||
Expected future gross premiums |
$ | $ | $ | $ | $ | $ | ||||||||||||||||||
Expected future benefit payments |
$ | $ | $ | $ | $ | $ | ||||||||||||||||||
Fixed annuities |
||||||||||||||||||||||||
Expected future gross premiums |
$ | $ | $ | $ | $ | $ | ||||||||||||||||||
Expected future benefit payments |
$ | $ | $ | $ | $ | $ |
2023 |
2022 |
2021 |
||||||||||||||||||||||
(Amounts in millions) |
Gross premiums |
Interest accretion (1) |
Gross premiums |
Interest accretion (1) |
Gross premiums |
Interest accretion (1) |
||||||||||||||||||
Long-term care insurance |
$ | $ | $ | $ | $ | $ | ||||||||||||||||||
Life insurance |
||||||||||||||||||||||||
Fixed annuities |
||||||||||||||||||||||||
|
|
|
|
|
|
|
|
|
|
|
|
|||||||||||||
Total |
$ | $ | $ | $ | $ | $ | ||||||||||||||||||
|
|
|
|
|
|
|
|
|
|
|
|
(1) |
Amounts for interest accretion are included in benefits and other changes in policy reserves in the consolidated statements of income. |
(Amounts in millions) |
2023 |
2022 |
||||||
Life insurance (1) |
$ | $ | ||||||
Fixed annuities |
||||||||
Variable annuities |
||||||||
Fixed indexed annuity embedded derivatives (2) |
||||||||
Indexed universal life embedded derivatives (2) |
||||||||
Additional insurance liabilities (3) |
||||||||
Other |
||||||||
|
|
|
|
|||||
Total policyholder account balances |
$ | $ | ||||||
|
|
|
|
(1) |
Includes funding agreements . |
(2) |
See note 6 for additional information. |
(3) |
Represents additional liabilities related to death or other insurance benefits that are recorded within policyholder account balances and are considered long-duration insurance contracts. See note 12 for additional information. |
2023 |
||||||||||||
(Dollar amounts in millions) |
Life insurance |
Fixed annuities |
Variable annuities |
|||||||||
Beginning balance as of January 1 |
$ | $ | $ | |||||||||
Issuances |
||||||||||||
Premiums received |
||||||||||||
Policy charges |
( |
) | ( |
) | ( |
) | ||||||
Surrenders and withdrawals |
( |
) | ( |
) | ( |
) | ||||||
Benefit payments |
( |
) | ( |
) | ( |
) | ||||||
Net transfers from separate accounts |
||||||||||||
Interest credited |
||||||||||||
Other |
( |
) | ||||||||||
|
|
|
|
|
|
|||||||
Ending balance as of December 31 |
$ | $ | $ | |||||||||
|
|
|
|
|
|
|||||||
Weighted-average crediting rate |
% | % | % | |||||||||
Net amount at risk (1) |
$ | $ | $ | |||||||||
Cash surrender value |
$ | $ | $ |
(1) |
|
2022 |
||||||||||||
(Dollar amounts in millions) |
Life insurance |
Fixed annuities |
Variable annuities |
|||||||||
Beginning balance as of January 1 |
$ | $ | $ | |||||||||
Issuances |
||||||||||||
Premiums received |
||||||||||||
Policy charges |
( |
) | ( |
) | ( |
) | ||||||
Surrenders and withdrawals |
( |
) | ( |
) | ( |
) | ||||||
Benefit payments |
( |
) | ( |
) | ( |
) | ||||||
Net transfers from separate accounts |
||||||||||||
Interest credited |
||||||||||||
Other |
( |
) | ||||||||||
|
|
|
|
|
|
|||||||
Ending balance as of December 31 |
$ | $ | $ | |||||||||
|
|
|
|
|
|
|||||||
Weighted-average crediting rate |
% | % | % | |||||||||
Net amount at risk (1) |
$ | $ | $ | |||||||||
Cash surrender value |
$ | $ | $ |
(1) |
The net amount at risk presented for fixed and variable annuity products contains both general and separate accounts, including amounts related to annuitization and other insurance benefits classified as MRBs. |
2021 |
||||||||||||
Life |
Fixed |
Variable |
||||||||||
(Dollar amounts in millions) |
insurance |
annuities |
annuities |
|||||||||
Beginning balance as of January 1 |
$ | $ | $ | |||||||||
Issuances |
||||||||||||
Premiums received |
||||||||||||
Policy charges |
( |
) | ( |
) | ( |
) | ||||||
Surrenders and withdrawals |
( |
) | ( |
) | ( |
) | ||||||
Benefit payments |
( |
) | ( |
) | ( |
) | ||||||
Net transfers from separate accounts |
||||||||||||
Interest credited |
||||||||||||
Other |
( |
) | ||||||||||
|
|
|
|
|
|
|||||||
Ending balance as of December 31 |
$ | $ | $ | |||||||||
|
|
|
|
|
|
|||||||
Weighted-average crediting rate |
% | % | % | |||||||||
Net amount at risk (1) |
$ | $ | $ | |||||||||
Cash surrender value |
$ | $ | $ |
(1) |
The net amount at risk presented for fixed and variable annuity products contains both general and separate accounts, including amounts related to annuitization and other insurance benefits classified as MRBs. |
2023 |
||||||||||||||||||||
(Amounts in millions) |
At guaranteed minimum |
points above |
points above |
Greater than points above |
Total (1) |
|||||||||||||||
Less than |
$ |
$ |
$ |
$ |
$ |
|||||||||||||||
|
||||||||||||||||||||
|
||||||||||||||||||||
|
||||||||||||||||||||
|
|
|
|
|
|
|
|
|
|
|||||||||||
Total |
$ |
$ |
$ |
$ |
$ |
|||||||||||||||
|
|
|
|
|
|
|
|
|
|
(1) |
Excludes universal life insurance and investment contracts of approximately $ million that have a market component to their crediting strategy. |
2022 |
||||||||||||||||||||
(Amounts in millions) |
At guaranteed minimum |
points above |
points above |
Greater than points above |
Total (1) |
|||||||||||||||
Less than |
$ |
$ |
$ |
$ |
$ |
|||||||||||||||
|
||||||||||||||||||||
|
||||||||||||||||||||
|
||||||||||||||||||||
|
|
|
|
|
|
|
|
|
|
|||||||||||
Total |
$ |
$ |
$ |
$ |
$ |
|||||||||||||||
|
|
|
|
|
|
|
|
|
|
(1) |
|
(Dollar amounts in millions) |
2023 |
2022 |
2021 |
|||||||||
Beginning balance as of January 1 |
$ | $ | $ | |||||||||
Beginning balance before shadow accounting adjustments |
$ | $ | $ | |||||||||
Effect of changes in cash flow assumptions |
( |
) | ||||||||||
Effect of actual variances from expected experience |
( |
) | ||||||||||
|
|
|
|
|
|
|||||||
Adjusted beginning balance |
||||||||||||
Issuances |
||||||||||||
Interest accretion |
||||||||||||
Assessments collected |
||||||||||||
Benefit payments |
( |
) | ( |
) | ( |
) | ||||||
Derecognition (lapses and withdrawals) |
||||||||||||
Other (flooring adjustment) |
||||||||||||
|
|
|
|
|
|
|||||||
Ending balance before shadow accounting adjustments |
||||||||||||
Effect of shadow accounting adjustments |
( |
) | ( |
) | ||||||||
|
|
|
|
|
|
|||||||
Ending balance |
||||||||||||
Less: reinsurance recoverable |
||||||||||||
|
|
|
|
|
|
|||||||
Additional insurance liabilities, net of reinsurance recoverable |
$ | $ | $ | |||||||||
|
|
|
|
|
|
|||||||
Weighted-average liability duration (years) |
2023 |
2022 |
2021 |
||||||||||
Interest accretion rate (1) |
% | % | % | |||||||||
Projected crediting rate (2) |
% | % | % |
(1) |
The interest accretion rate is determined by using the weighted-average policyholder crediting rates for the underlying policies over the period in-force, and based on the adjusted beginning balance, is used to measure the amount of interest accretion. |
(2) |
The projected crediting rate is determined by using a future crediting rate curve that utilizes a portfolio approach reflecting anticipated reinvestment activity and runoff of existing assets over the projection period. The projected crediting rate is used to discount future assessments and excess benefits. |
(Amounts in millions) |
2023 |
2022 |
2021 |
|||||||||
Gross assessments |
$ | $ | $ | |||||||||
Interest accretion (1) |
$ | $ | $ |
(1) |
Amounts for interest accretion are included in benefits and other changes in policy reserves in the consolidated statements of income. |
2023 |
2022 |
|||||||||||||||||||||||
(Amounts in millions) |
Asset |
Liability |
Net liability |
Asset |
Liability |
Net liability |
||||||||||||||||||
Fixed indexed annuities |
$ | $ | $ | $ | $ | $ | ||||||||||||||||||
Variable annuities |
||||||||||||||||||||||||
|
|
|
|
|
|
|
|
|
|
|
|
|||||||||||||
Total market risk benefits |
$ | $ | $ | $ | $ | $ | ||||||||||||||||||
|
|
|
|
|
|
|
|
|
|
|
|
2023 |
||||||||||||
(Dollar amounts in millions) |
Fixed indexed annuities |
Variable annuities |
Reinsurance recoverable (1) |
|||||||||
Beginning balance as of January 1 |
$ | $ | $ | |||||||||
Beginning balance before effect of changes in instrument-specific credit risk |
$ | $ | $ | |||||||||
Issuances |
||||||||||||
Interest accretion |
||||||||||||
Attributed fees collected |
||||||||||||
Benefit payments |
( |
) | ( |
) | ||||||||
Effect of changes in interest rates |
( |
) | ( |
) | ( |
) | ||||||
Effect of changes in equity markets |
( |
) | ( |
) | ( |
) | ||||||
Actual policyholder behavior different from expected behavior |
( |
) | ||||||||||
Effect of changes in future expected policyholder behavior |
||||||||||||
Effect of changes in other future expected assumptions |
||||||||||||
Other |
( |
) | ||||||||||
|
|
|
|
|
|
|||||||
Ending balance before effect of changes in instrument-specific credit risk |
||||||||||||
Effect of changes in instrument-specific credit risk |
||||||||||||
|
|
|
|
|
|
|||||||
Ending balance as of December 31 |
$ | |||||||||||
|
|
|||||||||||
Less: reinsurance recoverable |
||||||||||||
|
|
|
|
|||||||||
Market risk benefits, net of reinsurance recoverable |
$ | $ | ||||||||||
|
|
|
|
|||||||||
Weighted-average attained age of contractholders |
||||||||||||
Net amount at risk (2) |
(1) |
Represents the net reinsured asset related to our variable annuity MRBs. |
(2) |
See note 11 for additional information on the net amount at risk. |
2022 |
||||||||||||
(Dollar amounts in millions) |
Fixed indexed annuities |
Variable annuities |
Reinsurance recoverable (1) |
|||||||||
Beginning balance as of January 1 |
$ | $ | $ | |||||||||
Beginning balance before effect of changes in instrument-specific credit |
$ | $ | $ | |||||||||
Issuances |
||||||||||||
Interest accretion |
||||||||||||
Attributed fees collected |
||||||||||||
Benefit payments |
( |
) | ( |
) | ||||||||
Effect of changes in interest rates |
( |
) | ( |
) | ( |
) | ||||||
Effect of changes in equity markets |
||||||||||||
Actual policyholder behavior different from expected behavior |
( |
) | ||||||||||
Effect of changes in future expected policyholder behavior |
||||||||||||
Effect of changes in other future expected assumptions |
||||||||||||
Other |
||||||||||||
|
|
|
|
|
|
|||||||
Ending balance before effect of changes in instrument-specific credit risk |
||||||||||||
Effect of changes in instrument-specific credit risk |
||||||||||||
|
|
|
|
|
|
|||||||
Ending balance as of December 31 |
$ | |||||||||||
|
|
|||||||||||
Less: reinsurance recoverable |
||||||||||||
|
|
|
|
|||||||||
Market risk benefits, net of reinsurance recoverable |
$ | $ | ||||||||||
|
|
|
|
|||||||||
Weighted-average attained age of contractholders |
||||||||||||
Net amount at risk (2) |
(1) |
Represents the net reinsured asset related to our variable annuity MRBs. |
(2) |
See note 11 for additional information on the net amount at risk. |
2021 |
||||||||||||
(Dollar amounts in millions) |
Fixed indexed annuities |
Variable annuities |
Reinsurance recoverable (1) |
|||||||||
Beginning balance as of January 1 |
$ | $ | $ | |||||||||
Beginning balance before effect of changes in instrument-specific credit |
$ | $ | $ | |||||||||
Issuances |
||||||||||||
Interest accretion |
||||||||||||
Attributed fees collected |
||||||||||||
Benefit payments |
( |
) | ( |
) | ||||||||
Effect of changes in interest rates |
( |
) | ( |
) | ( |
) | ||||||
Effect of changes in equity markets |
( |
) | ( |
) | ( |
) | ||||||
Actual policyholder behavior different from expected behavior |
( |
) | ||||||||||
Effect of changes in future expected policyholder behavior |
||||||||||||
Effect of changes in other future expected assumptions |
||||||||||||
Other |
( |
) | ||||||||||
Ending balance before effect of changes in instrument-specific credit risk |
||||||||||||
Effect of changes in instrument-specific credit risk |
||||||||||||
Ending balance as of December 31 |
$ | |||||||||||
Less: reinsurance recoverable |
||||||||||||
Market risk benefits, net of reinsurance recoverable |
$ | $ | ||||||||||
Weighted-average attained age of contractholders |
||||||||||||
Net amount at risk (2) |
(1) |
Represents the net reinsured asset related to our variable annuity MRBs. |
(2) |
See note 11 for additional information on the net amount at risk. |
(Amounts in millions) |
December 31, 2023 |
December 31, 2022 |
December 31, 2021 |
|||||||||
Beginning balance as of January 1 |
$ | $ | $ | |||||||||
Premiums and deposits |
||||||||||||
Policy charges |
( |
) | ( |
) | ( |
) | ||||||
Surrenders and withdrawals |
( |
) | ( |
) | ( |
) | ||||||
Benefit payments |
( |
) | ( |
) | ( |
) | ||||||
Investment performance |
( |
) | ||||||||||
Net transfers to general account |
( |
) | ( |
) | ( |
) | ||||||
Other charges |
( |
) | ( |
) | ( |
) | ||||||
Ending balance |
$ | $ | $ | |||||||||
Cash surrender value (1) |
$ | $ | $ |
(1) |
Cash surrender value represents the amount of the contractholders’ account balances that was distributable less certain surrender charges. |
(Amounts in millions) |
December 31, 2023 |
December 31, 2022 |
||||||
Equity funds |
$ | $ | ||||||
Balanced funds |
||||||||
Bond funds |
||||||||
Money market funds |
||||||||
Total |
$ | $ | ||||||
(Amounts in millions) |
2023 |
2022 |
||||||
Enact segment |
$ | $ | ||||||
Life and Annuities segment (1) |
||||||||
Other mortgage insurance business |
||||||||
Total liability for policy and contract claims |
$ | $ | ||||||
(1) |
Primarily includes balances related to our universal and term universal life insurance products. |
(Amounts in millions) |
2023 |
2022 |
2021 |
|||||||||
Beginning balance as of January 1 |
$ | $ | $ |
|||||||||
Less reinsurance recoverable |
( |
) | ( |
) | ( |
) | ||||||
Net beginning balance |
||||||||||||
Incurred related to insured events of: |
||||||||||||
Current year |
||||||||||||
Prior years |
( |
) | ( |
) | ||||||||
Total incurred |
||||||||||||
Paid related to insured events of: |
||||||||||||
Current year |
( |
) | ( |
) | ( |
) | ||||||
Prior years |
( |
) | ( |
) | ( |
) | ||||||
Total paid |
( |
) | ( |
) | ( |
) | ||||||
Foreign currency translation |
||||||||||||
Net ending balance |
||||||||||||
Add reinsurance recoverable |
||||||||||||
Ending balance as of December 31 |
$ | $ | $ |
|||||||||
Incurred claims and allocated claim adjustment expenses, net of reinsurance |
Total of IBNR liabilities including expected development on reported claims as of December 31, 2023 |
Number of reported delinquencies (2) |
||||||||||||||||||||||||||||||||||||||||||||||
(Dollar amounts in millions) |
For the years ended December 31, |
|||||||||||||||||||||||||||||||||||||||||||||||
Accident year (1) |
2014 |
2015 |
2016 |
2017 |
2018 |
2019 |
2020 |
2021 |
2022 |
2023 |
||||||||||||||||||||||||||||||||||||||
Unaudited |
||||||||||||||||||||||||||||||||||||||||||||||||
2014 |
$ |
$ |
$ |
$ |
$ |
$ |
$ |
$ |
$ |
$ |
$ |
|||||||||||||||||||||||||||||||||||||
2015 |
||||||||||||||||||||||||||||||||||||||||||||||||
2016 |
||||||||||||||||||||||||||||||||||||||||||||||||
2017 |
||||||||||||||||||||||||||||||||||||||||||||||||
2018 |
||||||||||||||||||||||||||||||||||||||||||||||||
2019 |
||||||||||||||||||||||||||||||||||||||||||||||||
2020 |
||||||||||||||||||||||||||||||||||||||||||||||||
2021 |
||||||||||||||||||||||||||||||||||||||||||||||||
2022 |
||||||||||||||||||||||||||||||||||||||||||||||||
2023 |
||||||||||||||||||||||||||||||||||||||||||||||||
Total incurred |
$ |
|||||||||||||||||||||||||||||||||||||||||||||||
(1) |
Represents the year in which first monthly mortgage payments have been missed by the borrower. |
(2) |
Represents reported and outstanding delinquencies less actual cures as of December 31 for each respective accident year. |
(Amounts in millions) |
Cumulative paid claims and allocated claim adjustment expenses, net of reinsurance |
|||||||||||||||||||||||||||||||||||||||
Accident year (1) |
2014 |
2015 |
2016 |
2017 |
2018 |
2019 |
2020 |
2021 |
2022 |
2023 |
||||||||||||||||||||||||||||||
Unaudited |
||||||||||||||||||||||||||||||||||||||||
2014 |
$ |
$ |
$ |
$ |
$ |
$ |
$ |
$ |
$ |
$ |
||||||||||||||||||||||||||||||
2015 |
||||||||||||||||||||||||||||||||||||||||
2016 |
||||||||||||||||||||||||||||||||||||||||
2017 |
||||||||||||||||||||||||||||||||||||||||
2018 |
||||||||||||||||||||||||||||||||||||||||
2019 |
||||||||||||||||||||||||||||||||||||||||
2020 |
||||||||||||||||||||||||||||||||||||||||
2021 |
||||||||||||||||||||||||||||||||||||||||
2022 |
||||||||||||||||||||||||||||||||||||||||
2023 |
||||||||||||||||||||||||||||||||||||||||
Total paid |
$ |
|||||||||||||||||||||||||||||||||||||||
Total incurred |
$ |
|||||||||||||||||||||||||||||||||||||||
Total paid |
||||||||||||||||||||||||||||||||||||||||
All outstanding liabilities before 2014 |
||||||||||||||||||||||||||||||||||||||||
Reinsurance recoverable |
||||||||||||||||||||||||||||||||||||||||
Liability for policy and contract claims |
$ |
|||||||||||||||||||||||||||||||||||||||
(1) |
Represents the year in which first monthly mortgage payments have been missed by the borrower. |
Average annual percentage payout of incurred claims by age |
||||||||||||||||||||||||||||||||||||||||
Years |
1 |
2 |
3 |
4 |
5 |
6 |
7 |
8 |
9 |
10 |
||||||||||||||||||||||||||||||
Unaudited |
||||||||||||||||||||||||||||||||||||||||
Percentage of payout |
% | % | % | % | % | % | % | % | % | % |
(Amounts in millions) |
2023 |
2022 |
||||||
Genworth Holdings |
||||||||
|
$ | $ | ||||||
Floating Rate Junior Subordinated Notes, due |
||||||||
|
|
|
|
|||||
Subtotal |
||||||||
Bond consent fees |
( |
) | ( |
) | ||||
Deferred borrowing charges |
( |
) | ( |
) | ||||
|
|
|
|
|||||
Total Genworth Holdings |
||||||||
|
|
|
|
|||||
Enact Holdings |
||||||||
|
||||||||
Deferred borrowing charges |
( |
) | ( |
) | ||||
|
|
|
|
|||||
Total Enact Holdings |
||||||||
|
|
|
|
|||||
Total |
$ | $ | ||||||
|
|
|
|
(Amounts in millions) |
||||
2024 |
$ | |||
2025 |
||||
2026 |
||||
2027 |
||||
2028 and thereafter |
||||
|
|
|||
Total |
$ | |||
|
|
(Amounts in millions) |
2023 |
2022 |
2021 |
|||||||||
Domestic |
$ | $ | $ | |||||||||
Foreign |
( |
) | ||||||||||
|
|
|
|
|
|
|||||||
Income from continuing operations before income taxes |
$ | $ | $ | |||||||||
|
|
|
|
|
|
(Amounts in millions) |
2023 |
2022 |
2021 |
|||||||||
Current federal income taxes |
$ | $ | $ | ( |
) | |||||||
Deferred federal income taxes |
||||||||||||
|
|
|
|
|
|
|||||||
Total federal income taxes |
||||||||||||
|
|
|
|
|
|
|||||||
Current state income taxes |
||||||||||||
Deferred state income taxes |
( |
) | ( |
) | ||||||||
|
|
|
|
|
|
|||||||
Total state income taxes |
( |
) | ||||||||||
|
|
|
|
|
|
|||||||
Current foreign income taxes |
||||||||||||
Deferred foreign income taxes |
||||||||||||
|
|
|
|
|
|
|||||||
Total foreign income taxes |
||||||||||||
|
|
|
|
|
|
|||||||
Total provision for income taxes |
$ | $ | $ | |||||||||
|
|
|
|
|
|
2023 |
2022 |
2021 |
||||||||||
|
|
|
|
|
|
|
|
|
| |||
Statutory U.S. federal income tax rate |
% | % | % | |||||||||
Increase (reduction) in rate resulting from: |
||||||||||||
Tax on income from terminated swaps |
||||||||||||
Reduction in uncertain tax positions |
( |
) | ||||||||||
Non-deductible expenses |
||||||||||||
State income tax, net of federal income tax effect |
( |
) | ||||||||||
Other, net |
( |
) |
( |
) | ||||||||
|
|
|
|
|
|
|||||||
Effective rate |
% | % | % | |||||||||
|
|
|
|
|
|
(Amounts in millions) |
2023 |
2022 |
||||||
Assets: |
||||||||
Foreign tax credit carryforwards |
$ | $ | ||||||
Net operating loss carryforwards |
||||||||
Capital loss carryforwards |
||||||||
State income taxes |
||||||||
Insurance reserves |
||||||||
DAC |
||||||||
Accrued commission and general expenses |
||||||||
Liabilities associated with discontinued operations |
||||||||
Net unrealized losses on investment securities |
||||||||
Net unrealized losses on derivatives |
||||||||
Net effect of change in discount rate for future policy benefits |
||||||||
Net effect of change in fair value of MRBs attributable to instrument-specific credit risk |
||||||||
Other |
||||||||
|
|
|
|
|||||
Gross deferred income tax assets |
||||||||
Valuation allowance |
( |
) | ( |
) | ||||
|
|
|
|
|||||
Total deferred income tax assets |
||||||||
|
|
|
|
|||||
Liabilities: |
||||||||
DAC |
||||||||
PVFP and other intangibles |
||||||||
Insurance reserves transition adjustment |
||||||||
Investments |
||||||||
Other |
||||||||
|
|
|
|
|||||
Total deferred income tax liabilities |
||||||||
|
|
|
|
|||||
Net deferred income tax asset |
$ | $ | ||||||
|
|
|
|
(Amounts in millions) |
2023 |
2022 |
2021 |
|||||||||
Balance as of January 1 |
$ | $ | $ | |||||||||
Tax positions related to the current period: |
||||||||||||
Gross additions |
||||||||||||
Gross reductions |
( |
) | ( |
) | ( |
) | ||||||
Tax positions related to the prior years: |
||||||||||||
Gross additions |
||||||||||||
Gross reductions |
( |
) | ( |
) | ||||||||
|
|
|
|
|
|
|||||||
Balance as of December 31 |
$ | $ | $ | |||||||||
|
|
|
|
|
|
2023 |
2022 |
2021 |
||||||||||
Valuation-date stock price |
$ | $ | $ | |||||||||
Volatility |
% | % | % | |||||||||
Dividend yield |
% | % | % | |||||||||
Risk-free rate |
% | % | % | |||||||||
Valuation maximum |
|
date stock price |
|
date stock price |
|
date stock price |
RSUs |
PSUs |
DSUs |
SARs |
|||||||||||||||||||||||||||||
(Awards in thousands) |
Number of awards |
Weighted- average grant date fair value |
Number of awards |
Weighted- average fair value |
Number of awards |
Weighted- average fair value |
Number of awards |
Weighted- average grant date fair value |
||||||||||||||||||||||||
Balance as of January 1, 2022 |
$ |
$ |
$ |
$ |
||||||||||||||||||||||||||||
Granted |
$ |
$ |
$ |
$ |
||||||||||||||||||||||||||||
Performance adjustment (1) |
$ |
$ |
$ |
$ |
||||||||||||||||||||||||||||
Exercised |
( |
) |
$ |
( |
) |
$ |
( |
) |
$ |
$ |
||||||||||||||||||||||
Terminated |
( |
) |
$ |
( |
) |
$ |
$ |
( |
) |
$ |
||||||||||||||||||||||
|
|
|
|
|
|
|
|
|||||||||||||||||||||||||
Balance as of January 1, 2023 |
$ |
$ |
$ |
$ |
||||||||||||||||||||||||||||
Granted |
$ |
$ |
$ |
$ |
||||||||||||||||||||||||||||
Performance adjustment (1) |
$ |
$ |
$ |
$ |
||||||||||||||||||||||||||||
Exercised |
( |
) |
$ |
( |
) |
$ |
( |
) |
$ |
$ |
||||||||||||||||||||||
Terminated |
( |
) |
$ |
$ |
$ |
( |
) |
$ |
||||||||||||||||||||||||
|
|
|
|
|
|
|
|
|||||||||||||||||||||||||
Balance as of December 31, 2023 |
$ |
$ |
$ |
$ |
||||||||||||||||||||||||||||
|
|
|
|
|
|
|
|
(1) |
The performance adjustment relates to additional awards expected to be earned through the achievement of certain performance metrics. |
Cash settled RSUs |
Time-based cash awards |
|||||||||||
(Awards in thousands) |
Number of awards |
Weighted- average fair value |
Number of awards |
|||||||||
Balance as of January 1, 2022 |
$ | |||||||||||
Granted |
$ | |||||||||||
Performance adjustment |
$ | |||||||||||
Vested |
( |
) | $ | ( |
) | |||||||
Forfeited |
( |
) | $ | ( |
) | |||||||
|
|
|
|
|||||||||
Balance as of January 1, 2023 |
$ | |||||||||||
Granted |
$ | |||||||||||
Performance adjustment |
$ | |||||||||||
Vested |
( |
) | $ | ( |
) | |||||||
Forfeited |
( |
) | $ | ( |
) | |||||||
|
|
|
|
|||||||||
Balance as of December 31, 2023 |
$ | |||||||||||
|
|
|
|
RSUs |
PSUs |
DSUs |
||||||||||||||||||||||
(Awards in thousands) |
Number of awards |
Weighted- average fair value |
Number of awards |
Weighted- average fair value |
Number of awards |
Weighted- average fair value |
||||||||||||||||||
Balance as of January 1, 2022 |
$ | $ | $ | |||||||||||||||||||||
Granted |
$ | $ | $ | |||||||||||||||||||||
Dividend equivalents |
$ | $ | $ | |||||||||||||||||||||
Vested |
( |
) | $ | $ | $ | |||||||||||||||||||
Terminated |
( |
) | $ | $ | $ | |||||||||||||||||||
|
|
|
|
|
|
|||||||||||||||||||
Balance as of January 1, 2023 |
$ | $ | $ | |||||||||||||||||||||
Granted |
$ | $ | $ | |||||||||||||||||||||
Dividend equivalents |
$ | $ | $ | |||||||||||||||||||||
Vested |
( |
) | $ | $ | $ | |||||||||||||||||||
Terminated |
( |
) | $ | $ | $ | |||||||||||||||||||
|
|
|
|
|
|
|||||||||||||||||||
Balance as of December 31, 2023 |
$ | $ | $ | |||||||||||||||||||||
|
|
|
|
|
|
• | Third-party pricing services: |
(Amounts in millions) |
Fair value |
Primary methodologies |
Significant inputs | |||||
U.S. government, agencies and government-sponsored enterprises |
$ |
|||||||
State and political subdivisions |
$ |
|||||||
Non-U.S. government |
$ |
|||||||
U.S. corporate |
$ |
|||||||
Non-U.S. corporate |
$ |
|||||||
Residential mortgage-backed |
$ |
|||||||
Commercial mortgage-backed |
$ |
|||||||
Other asset-backed |
$ |
• |
Internal models: |
• |
Broker quotes: |
• |
Internal models: |
2023 |
||||||||||||||||||||
(Amounts in millions) |
Total |
Level 1 |
Level 2 |
Level 3 |
NAV (1) |
|||||||||||||||
Assets |
||||||||||||||||||||
Investments: |
||||||||||||||||||||
Fixed maturity securities: |
||||||||||||||||||||
U.S. government, agencies and government-sponsored enterprises |
$ |
$ |
$ |
$ |
$ |
|||||||||||||||
State and political subdivisions |
||||||||||||||||||||
Non-U.S. government |
||||||||||||||||||||
U.S. corporate: |
||||||||||||||||||||
Utilities |
||||||||||||||||||||
Energy |
||||||||||||||||||||
Finance and insurance |
||||||||||||||||||||
Consumer—non-cyclical |
||||||||||||||||||||
Technology and communications |
||||||||||||||||||||
Industrial |
||||||||||||||||||||
Capital goods |
||||||||||||||||||||
Consumer—cyclical |
||||||||||||||||||||
Transportation |
||||||||||||||||||||
Other |
||||||||||||||||||||
|
|
|
|
|
|
|
|
|
|
|||||||||||
Total U.S. corporate |
||||||||||||||||||||
|
|
|
|
|
|
|
|
|
|
|||||||||||
Non-U.S. corporate: |
||||||||||||||||||||
Utilities |
||||||||||||||||||||
Energy |
||||||||||||||||||||
Finance and insurance |
||||||||||||||||||||
Consumer—non-cyclical |
||||||||||||||||||||
Technology and communications |
||||||||||||||||||||
Industrial |
||||||||||||||||||||
Capital goods |
||||||||||||||||||||
Consumer—cyclical |
||||||||||||||||||||
Transportation |
||||||||||||||||||||
Other |
||||||||||||||||||||
|
|
|
|
|
|
|
|
|
|
|||||||||||
Total non-U.S. corporate |
||||||||||||||||||||
|
|
|
|
|
|
|
|
|
|
|||||||||||
Residential mortgage-backed |
||||||||||||||||||||
Commercial mortgage-backed |
||||||||||||||||||||
Other asset-backed |
||||||||||||||||||||
|
|
|
|
|
|
|
|
|
|
|||||||||||
Total fixed maturity securities |
||||||||||||||||||||
|
|
|
|
|
|
|
|
|
|
|||||||||||
Equity securities |
||||||||||||||||||||
Limited partnerships |
||||||||||||||||||||
Other invested assets: |
||||||||||||||||||||
Derivative assets: |
||||||||||||||||||||
Interest rate swaps |
||||||||||||||||||||
Foreign currency swaps |
||||||||||||||||||||
Equity index options |
||||||||||||||||||||
Forward bond purchase commitments |
||||||||||||||||||||
|
|
|
|
|
|
|
|
|
|
|||||||||||
Total derivative assets |
||||||||||||||||||||
|
|
|
|
|
|
|
|
|
|
|||||||||||
Short-term investments |
||||||||||||||||||||
|
|
|
|
|
|
|
|
|
|
|||||||||||
Total other invested assets |
||||||||||||||||||||
|
|
|
|
|
|
|
|
|
|
|||||||||||
Separate account assets |
||||||||||||||||||||
|
|
|
|
|
|
|
|
|
|
|||||||||||
Total assets |
$ |
$ |
$ |
$ |
$ |
|||||||||||||||
|
|
|
|
|
|
|
|
|
|
(1) |
Limited partnerships that are measured at fair value using the NAV per share (or its equivalent) practical expedient have not been categorized in the fair value hierarchy. |
2022 |
||||||||||||||||||||
(Amounts in millions) |
Total |
Level 1 |
Level 2 |
Level 3 |
NAV (1) |
|||||||||||||||
Assets |
||||||||||||||||||||
Investments: |
||||||||||||||||||||
Fixed maturity securities: |
||||||||||||||||||||
U.S. government, agencies and government-sponsored enterprises |
$ |
$ |
$ |
$ |
$ |
|||||||||||||||
State and political subdivisions |
||||||||||||||||||||
Non-U.S. government |
||||||||||||||||||||
U.S. corporate: |
||||||||||||||||||||
Utilities |
||||||||||||||||||||
Energy |
||||||||||||||||||||
Finance and insurance |
||||||||||||||||||||
Consumer—non-cyclical |
||||||||||||||||||||
Technology and communications |
||||||||||||||||||||
Industrial |
||||||||||||||||||||
Capital goods |
||||||||||||||||||||
Consumer—cyclical |
||||||||||||||||||||
Transportation |
||||||||||||||||||||
Other |
||||||||||||||||||||
|
|
|
|
|
|
|
|
|
|
|||||||||||
Total U.S. corporate |
||||||||||||||||||||
|
|
|
|
|
|
|
|
|
|
|||||||||||
Non-U.S. corporate: |
||||||||||||||||||||
Utilities |
||||||||||||||||||||
Energy |
||||||||||||||||||||
Finance and insurance |
||||||||||||||||||||
Consumer—non-cyclical |
||||||||||||||||||||
Technology and communications |
||||||||||||||||||||
Industrial |
||||||||||||||||||||
Capital goods |
||||||||||||||||||||
Consumer—cyclical |
||||||||||||||||||||
Transportation |
||||||||||||||||||||
Other |
||||||||||||||||||||
|
|
|
|
|
|
|
|
|
|
|||||||||||
Total non-U.S. corporate |
||||||||||||||||||||
|
|
|
|
|
|
|
|
|
|
|||||||||||
Residential mortgage-backed |
||||||||||||||||||||
Commercial mortgage-backed |
||||||||||||||||||||
Other asset-backed |
||||||||||||||||||||
|
|
|
|
|
|
|
|
|
|
|||||||||||
Total fixed maturity securities |
||||||||||||||||||||
|
|
|
|
|
|
|
|
|
|
|||||||||||
Equity securities |
||||||||||||||||||||
Limited partnerships |
||||||||||||||||||||
Other invested assets: |
||||||||||||||||||||
Derivative assets: |
||||||||||||||||||||
Interest rate swaps |
||||||||||||||||||||
Foreign currency swaps |
||||||||||||||||||||
Equity index options |
||||||||||||||||||||
|
|
|
|
|
|
|
|
|
|
|||||||||||
Total derivative assets |
||||||||||||||||||||
|
|
|
|
|
|
|
|
|
|
|||||||||||
Short-term investments |
||||||||||||||||||||
|
|
|
|
|
|
|
|
|
|
|||||||||||
Total other invested assets |
||||||||||||||||||||
|
|
|
|
|
|
|
|
|
|
|||||||||||
Separate account assets |
||||||||||||||||||||
|
|
|
|
|
|
|
|
|
|
|||||||||||
Total assets |
$ |
$ |
$ |
$ |
$ |
|||||||||||||||
|
|
|
|
|
|
|
|
|
|
(1) |
Limited partnerships that are measured at fair value using the NAV per share (or its equivalent) practical expedient have not been categorized in the fair value hierarchy. |
Beginning balance as of January 1, 2023 |
Total realized and unrealized gains (losses) |
Ending balance as of December 31, 2023 |
Total gains (losses) attributable to assets still held |
|||||||||||||||||||||||||||||||||||||||||||||
(Amounts in millions) |
Included in net income |
Included in OCI |
Purchases |
Sales |
Issuances |
Settlements |
Transfer into Level 3 (1) |
Transfer out of Level 3 (1) |
Included in net income |
Included in OCI |
||||||||||||||||||||||||||||||||||||||
Fixed maturity securities: |
||||||||||||||||||||||||||||||||||||||||||||||||
and |
$ |
$ |
$ |
$ |
$ |
$ |
$ |
$ |
$ |
$ |
$ |
$ |
||||||||||||||||||||||||||||||||||||
Non-U.S. government |
( |
|||||||||||||||||||||||||||||||||||||||||||||||
U.S. corporate: |
||||||||||||||||||||||||||||||||||||||||||||||||
Utilities |
( |
( |
( |
|||||||||||||||||||||||||||||||||||||||||||||
Energy |
( |
( |
( |
|||||||||||||||||||||||||||||||||||||||||||||
Finance and insurance |
( |
( |
||||||||||||||||||||||||||||||||||||||||||||||
Consumer—non-cyclical |
( |
|||||||||||||||||||||||||||||||||||||||||||||||
Technology and communications |
( |
|||||||||||||||||||||||||||||||||||||||||||||||
Industrial |
||||||||||||||||||||||||||||||||||||||||||||||||
Capital goods |
||||||||||||||||||||||||||||||||||||||||||||||||
Consumer—cyclical |
( |
|||||||||||||||||||||||||||||||||||||||||||||||
Transportation |
( |
|||||||||||||||||||||||||||||||||||||||||||||||
Other |
( |
|||||||||||||||||||||||||||||||||||||||||||||||
|
|
|
|
|
|
|
|
|
|
|
|
|
|
|
|
|
|
|
|
|
|
|
|
|||||||||||||||||||||||||
Total U.S. corporate |
( |
( |
( |
|||||||||||||||||||||||||||||||||||||||||||||
|
|
|
|
|
|
|
|
|
|
|
|
|
|
|
|
|
|
|
|
|
|
|
|
|||||||||||||||||||||||||
Non-U.S. corporate: |
||||||||||||||||||||||||||||||||||||||||||||||||
Utilities |
( |
( |
||||||||||||||||||||||||||||||||||||||||||||||
Energy |
( |
|||||||||||||||||||||||||||||||||||||||||||||||
Finance and insurance |
||||||||||||||||||||||||||||||||||||||||||||||||
Consumer—non-cyclical |
( |
|||||||||||||||||||||||||||||||||||||||||||||||
Technology and communications |
( |
|||||||||||||||||||||||||||||||||||||||||||||||
Industrial |
( |
|||||||||||||||||||||||||||||||||||||||||||||||
Capital goods |
( |
( |
||||||||||||||||||||||||||||||||||||||||||||||
Consumer—cyclical |
( |
( |
||||||||||||||||||||||||||||||||||||||||||||||
Transportation |
||||||||||||||||||||||||||||||||||||||||||||||||
Other |
||||||||||||||||||||||||||||||||||||||||||||||||
|
|
|
|
|
|
|
|
|
|
|
|
|
|
|
|
|
|
|
|
|
|
|
|
|||||||||||||||||||||||||
Total non-U.S. corporate |
( |
( |
( |
|||||||||||||||||||||||||||||||||||||||||||||
|
|
|
|
|
|
|
|
|
|
|
|
|
|
|
|
|
|
|
|
|
|
|
|
|||||||||||||||||||||||||
Residential mortgage-backed |
( |
( |
||||||||||||||||||||||||||||||||||||||||||||||
Commercial mortgage-backed |
( |
|||||||||||||||||||||||||||||||||||||||||||||||
Other asset-backed |
( |
( |
||||||||||||||||||||||||||||||||||||||||||||||
|
|
|
|
|
|
|
|
|
|
|
|
|
|
|
|
|
|
|
|
|
|
|
|
|||||||||||||||||||||||||
Total fixed maturity securities |
( |
( |
( |
|||||||||||||||||||||||||||||||||||||||||||||
|
|
|
|
|
|
|
|
|
|
|
|
|
|
|
|
|
|
|
|
|
|
|
|
|||||||||||||||||||||||||
Equity securities |
( |
|||||||||||||||||||||||||||||||||||||||||||||||
Limited partnerships |
( |
( |
( |
|||||||||||||||||||||||||||||||||||||||||||||
Other invested assets: |
||||||||||||||||||||||||||||||||||||||||||||||||
Derivative assets: |
||||||||||||||||||||||||||||||||||||||||||||||||
Equity index options |
( |
|||||||||||||||||||||||||||||||||||||||||||||||
Forward bond purchase commitments |
||||||||||||||||||||||||||||||||||||||||||||||||
|
|
|
|
|
|
|
|
|
|
|
|
|
|
|
|
|
|
|
|
|
|
|
|
|||||||||||||||||||||||||
Total derivative assets |
( |
|||||||||||||||||||||||||||||||||||||||||||||||
Short-term investments |
||||||||||||||||||||||||||||||||||||||||||||||||
|
|
|
|
|
|
|
|
|
|
|
|
|
|
|
|
|
|
|
|
|
|
|
|
|||||||||||||||||||||||||
Total other invested assets |
( |
|||||||||||||||||||||||||||||||||||||||||||||||
|
|
|
|
|
|
|
|
|
|
|
|
|
|
|
|
|
|
|
|
|
|
|
|
|||||||||||||||||||||||||
Total Level 3 assets |
$ |
$ |
$ |
$ |
$( |
$ |
$( |
$ |
$( |
$ |
$ |
$ |
||||||||||||||||||||||||||||||||||||
|
|
|
|
|
|
|
|
|
|
|
|
|
|
|
|
|
|
|
|
|
|
|
|
(1) |
The transfers into and out of Level 3 for fixed maturity securities were related to changes in the primary pricing source and changes in the observability of external information used in determining the fair value, such as external ratings or credit spreads, as well as changes in the industry sectors assigned to specific securities . |
Beginning balance as of January 1, 2022 |
Total realized and unrealized gains (losses) |
Ending balance as of December 31, 2022 |
Total gains (losses) attributable to assets still held |
|||||||||||||||||||||||||||||||||||||||||||||
(Amounts in millions) |
Included in net income |
Included in OCI |
Purchases |
Sales |
Issuances |
Settlements |
Transfer into Level 3 (1) |
Transfer out of Level 3 (1) |
Included in net income |
Included in OCI |
||||||||||||||||||||||||||||||||||||||
: |
||||||||||||||||||||||||||||||||||||||||||||||||
State and political subdivisions |
$ |
$ |
$( |
$ |
$ |
$ |
$ |
$ |
$ |
$ |
$ |
$( |
||||||||||||||||||||||||||||||||||||
- . |
( |
( |
||||||||||||||||||||||||||||||||||||||||||||||
U.S. corporate: |
||||||||||||||||||||||||||||||||||||||||||||||||
Utilities |
( |
( |
( |
( |
||||||||||||||||||||||||||||||||||||||||||||
Energy |
( |
( |
( |
|||||||||||||||||||||||||||||||||||||||||||||
Finance and insurance |
( |
( |
( |
( |
||||||||||||||||||||||||||||||||||||||||||||
Consumer—non-cyclical |
( |
( |
( |
|||||||||||||||||||||||||||||||||||||||||||||
Technology and communications |
( |
( |
||||||||||||||||||||||||||||||||||||||||||||||
Industrial |
( |
( |
( |
|||||||||||||||||||||||||||||||||||||||||||||
Capital goods |
( |
( |
( |
|||||||||||||||||||||||||||||||||||||||||||||
Consumer—cyclical |
( |
( |
( |
|||||||||||||||||||||||||||||||||||||||||||||
Transportation |
( |
( |
( |
( |
||||||||||||||||||||||||||||||||||||||||||||
Other |
( |
( |
( |
( |
( |
|||||||||||||||||||||||||||||||||||||||||||
|
|
|
|
|
|
|
|
|
|
|
|
|
|
|
|
|
|
|
|
|
|
|
|
|||||||||||||||||||||||||
Total U.S. corporate |
( |
( |
( |
( |
( |
|||||||||||||||||||||||||||||||||||||||||||
|
|
|
|
|
|
|
|
|
|
|
|
|
|
|
|
|
|
|
|
|
|
|
|
|||||||||||||||||||||||||
Non-U.S. corporate: |
||||||||||||||||||||||||||||||||||||||||||||||||
Utilities |
( |
( |
( |
|||||||||||||||||||||||||||||||||||||||||||||
Energy |
( |
( |
( |
( |
||||||||||||||||||||||||||||||||||||||||||||
Finance and insurance |
( |
( |
||||||||||||||||||||||||||||||||||||||||||||||
Consumer—non-cyclical |
( |
( |
( |
|||||||||||||||||||||||||||||||||||||||||||||
Technology and communications |
( |
( |
||||||||||||||||||||||||||||||||||||||||||||||
Industrial |
( |
( |
( |
( |
||||||||||||||||||||||||||||||||||||||||||||
Capital goods |
( |
( |
( |
( |
||||||||||||||||||||||||||||||||||||||||||||
Consumer—cyclical |
( |
( |
( |
|||||||||||||||||||||||||||||||||||||||||||||
Transportation |
( |
( |
( |
|||||||||||||||||||||||||||||||||||||||||||||
Other |
( |
( |
||||||||||||||||||||||||||||||||||||||||||||||
|
|
|
|
|
|
|
|
|
|
|
|
|
|
|
|
|
|
|
|
|
|
|
|
|||||||||||||||||||||||||
Total non-U.S. corporate |
( |
( |
( |
( |
( |
|||||||||||||||||||||||||||||||||||||||||||
|
|
|
|
|
|
|
|
|
|
|
|
|
|
|
|
|
|
|
|
|
|
|
|
|||||||||||||||||||||||||
Residential mortgage-backed |
( |
( |
( |
( |
||||||||||||||||||||||||||||||||||||||||||||
Commercial mortgage-backed |
( |
( |
||||||||||||||||||||||||||||||||||||||||||||||
Other asset-backed |
( |
( |
( |
( |
( |
|||||||||||||||||||||||||||||||||||||||||||
|
|
|
|
|
|
|
|
|
|
|
|
|
|
|
|
|
|
|
|
|
|
|
|
|||||||||||||||||||||||||
Total fixed maturity securities |
( |
( |
( |
( |
( |
|||||||||||||||||||||||||||||||||||||||||||
|
|
|
|
|
|
|
|
|
|
|
|
|
|
|
|
|
|
|
|
|
|
|
|
|||||||||||||||||||||||||
Equity securities |
( |
( |
||||||||||||||||||||||||||||||||||||||||||||||
Limited partnerships |
( |
( |
||||||||||||||||||||||||||||||||||||||||||||||
Other invested assets: |
||||||||||||||||||||||||||||||||||||||||||||||||
Derivative assets: |
||||||||||||||||||||||||||||||||||||||||||||||||
Equity index options |
( |
( |
( |
|||||||||||||||||||||||||||||||||||||||||||||
|
|
|
|
|
|
|
|
|
|
|
|
|
|
|
|
|
|
|
|
|
|
|
|
|||||||||||||||||||||||||
Total derivative assets |
( |
( |
( |
|||||||||||||||||||||||||||||||||||||||||||||
|
|
|
|
|
|
|
|
|
|
|
|
|
|
|
|
|
|
|
|
|
|
|
|
|||||||||||||||||||||||||
Total other invested assets |
( |
( |
( |
|||||||||||||||||||||||||||||||||||||||||||||
|
|
|
|
|
|
|
|
|
|
|
|
|
|
|
|
|
|
|
|
|
|
|
|
|||||||||||||||||||||||||
Total Level 3 assets |
$ |
$( |
$( |
$ |
$( |
$ |
$( |
$ |
$( |
$ |
$( |
$( |
||||||||||||||||||||||||||||||||||||
|
|
|
|
|
|
|
|
|
|
|
|
|
|
|
|
|
|
|
|
|
|
|
|
(1) |
The transfers into and out of Level 3 for fixed maturity securities were related to changes in the primary pricing source and changes in the observability of external information used in determining the fair value, such as external ratings or credit spreads, as well as changes in the industry sectors assigned to specific securities. |
Beginning balance as of January 1, 2021 |
Total realized and unrealized gains (losses) |
Ending balance as of December 31, 2021 |
Total gains (losses) attributable to assets still held |
|||||||||||||||||||||||||||||||||||||||||||||
(Amounts in millions) |
Included in net income |
Included in OCI |
Purchases |
Sales |
Issuances |
Settlements |
Transfer into Level 3 (1) |
Transfer out of Level 3 (1) |
Included in net income |
Included in OCI |
||||||||||||||||||||||||||||||||||||||
Fixed maturity securities: |
||||||||||||||||||||||||||||||||||||||||||||||||
State and political subdivisions |
$ |
$ |
$ |
$ |
$ |
$ |
$ |
$ |
$ |
$ |
$ |
$ |
||||||||||||||||||||||||||||||||||||
Non-U.S. government |
||||||||||||||||||||||||||||||||||||||||||||||||
U.S. corporate: |
||||||||||||||||||||||||||||||||||||||||||||||||
Utilities |
( |
( |
||||||||||||||||||||||||||||||||||||||||||||||
Energy |
( |
( |
||||||||||||||||||||||||||||||||||||||||||||||
Finance and insurance |
( |
( |
( |
( |
||||||||||||||||||||||||||||||||||||||||||||
Consumer—non-cyclical |
( |
( |
( |
( |
||||||||||||||||||||||||||||||||||||||||||||
Technology and communications |
( |
( |
( |
|||||||||||||||||||||||||||||||||||||||||||||
Industrial |
( |
( |
||||||||||||||||||||||||||||||||||||||||||||||
Capital goods |
( |
( |
( |
|||||||||||||||||||||||||||||||||||||||||||||
Consumer—cyclical |
( |
( |
||||||||||||||||||||||||||||||||||||||||||||||
Transportation |
( |
( |
( |
|||||||||||||||||||||||||||||||||||||||||||||
Other |
( |
( |
( |
|||||||||||||||||||||||||||||||||||||||||||||
Total U.S. corporate |
( |
( |
( |
( |
||||||||||||||||||||||||||||||||||||||||||||
Non-U.S. corporate: |
||||||||||||||||||||||||||||||||||||||||||||||||
Utilities |
( |
( |
( |
( |
||||||||||||||||||||||||||||||||||||||||||||
Energy |
( |
( |
||||||||||||||||||||||||||||||||||||||||||||||
Finance and insurance |
( |
( |
( |
( |
( |
|||||||||||||||||||||||||||||||||||||||||||
Consumer—non-cyclical |
( |
( |
( |
|||||||||||||||||||||||||||||||||||||||||||||
Technology and communications |
( |
|||||||||||||||||||||||||||||||||||||||||||||||
Industrial |
( |
( |
( |
|||||||||||||||||||||||||||||||||||||||||||||
Capital goods |
( |
|||||||||||||||||||||||||||||||||||||||||||||||
Consumer—cyclical |
( |
|||||||||||||||||||||||||||||||||||||||||||||||
Transportation |
( |
( |
( |
|||||||||||||||||||||||||||||||||||||||||||||
Other |
( |
( |
( |
( |
||||||||||||||||||||||||||||||||||||||||||||
Total non-U.S. corporate |
( |
( |
( |
( |
( |
|||||||||||||||||||||||||||||||||||||||||||
Residential mortgage-backed |
( |
|||||||||||||||||||||||||||||||||||||||||||||||
Commercial mortgage-backed |
( |
( |
( |
|||||||||||||||||||||||||||||||||||||||||||||
Other asset-backed |
( |
( |
||||||||||||||||||||||||||||||||||||||||||||||
Total fixed maturity securities |
( |
( |
( |
( |
( |
|||||||||||||||||||||||||||||||||||||||||||
Equity securities |
( |
( |
||||||||||||||||||||||||||||||||||||||||||||||
Limited partnerships |
||||||||||||||||||||||||||||||||||||||||||||||||
Other invested assets: |
||||||||||||||||||||||||||||||||||||||||||||||||
Derivative assets: |
||||||||||||||||||||||||||||||||||||||||||||||||
Equity index options |
( |
|||||||||||||||||||||||||||||||||||||||||||||||
Total derivative assets |
( |
|||||||||||||||||||||||||||||||||||||||||||||||
Total other invested assets |
( |
|||||||||||||||||||||||||||||||||||||||||||||||
Total Level 3 assets |
$ |
$ |
$( |
$ |
$( |
$ |
$( |
$ |
$( |
$ |
$ |
$( |
||||||||||||||||||||||||||||||||||||
(1) |
The transfers into and out of Level 3 for fixed maturity securities were related to changes in the primary pricing source and changes in the observability of external information used in determining the fair value, such as external ratings or credit spreads, as well as changes in the industry sectors assigned to specific securities. |
(Amounts in millions) |
2023 |
2022 |
2021 |
|||||||||
(losses) included in : |
||||||||||||
Net investment income |
$ |
$ | $ | |||||||||
Net investment gains (losses) |
( |
) | ||||||||||
Total |
$ | $ | ( |
) | $ | |||||||
Total gains (losses) included in net income attributable to assets still held: |
||||||||||||
$ | $ | $ | ||||||||||
(losses) |
( |
) | ||||||||||
$ | $ | ( |
) | $ | ||||||||
(Amounts in millions) |
Valuation technique |
Fair value |
Unobservable input |
Range |
Weighted-average (1) |
|||||||||||||||
Fixed maturity securities: |
||||||||||||||||||||
U.S. corporate: |
||||||||||||||||||||
Utilities |
$ |
Credit spreads |
||||||||||||||||||
Energy |
Credit spreads |
|||||||||||||||||||
Finance and insurance |
Credit spreads |
|||||||||||||||||||
Consumer—non-cyclical |
Credit spreads |
|||||||||||||||||||
Technology and communications |
Credit spreads |
|||||||||||||||||||
Industrial |
Credit spreads |
|||||||||||||||||||
Capital goods |
Credit spreads |
|||||||||||||||||||
Consumer—cyclical |
Credit spreads |
|||||||||||||||||||
Transportation |
Credit spreads |
|||||||||||||||||||
Other |
Credit spreads |
|||||||||||||||||||
Total U.S. corporate |
$ |
Credit spreads |
||||||||||||||||||
Non-U.S. corporate: |
||||||||||||||||||||
Utilities |
$ |
Credit spreads |
||||||||||||||||||
Energy |
Credit spreads |
|||||||||||||||||||
Finance and insurance |
Credit spreads |
|||||||||||||||||||
Consumer—non-cyclical |
Credit spreads |
|||||||||||||||||||
Technology and communications |
Credit spreads |
|||||||||||||||||||
Industrial |
Credit spreads |
|||||||||||||||||||
Capital goods |
Credit spreads |
|||||||||||||||||||
Transportation |
Credit spreads |
|||||||||||||||||||
Other |
Credit spreads |
|||||||||||||||||||
Total non-U.S. corporate |
$ |
Credit spreads |
||||||||||||||||||
Derivative assets: |
||||||||||||||||||||
Equity index options |
flows |
$ |
Equity index volatility |
|||||||||||||||||
Forward bond purchase commitments |
flows |
$ | Counterparty financing spreads |
Not applicable |
||||||||||||||||
Lapse rate |
||||||||||||||||||||
Non-performance risk (counterparty credit risk) |
||||||||||||||||||||
Other assets (2) |
$ |
Equity index volatility |
(1) |
Unobservable inputs weighted by the relative fair value of the associated instrument for fixed maturity securities, notional for derivative assets and the policyholder account balances associated with the instrument for the net reinsured portion of our variable annuity MRBs. |
(2) |
Represents the net reinsured portion of our variable annuity MRBs. |
2023 |
||||||||||||||||
(Amounts in millions) |
Total |
Level 1 |
Level 2 |
Level 3 |
||||||||||||
Liabilities |
||||||||||||||||
Policyholder account balances: |
||||||||||||||||
Fixed indexed annuity embedded derivatives |
$ | $ | $ | $ | ||||||||||||
Indexed universal life embedded derivatives |
||||||||||||||||
Total policyholder account balances |
||||||||||||||||
Derivative liabilities: |
||||||||||||||||
Interest rate swaps |
||||||||||||||||
Foreign currency swaps |
||||||||||||||||
Forward bond purchase commitments |
||||||||||||||||
Total derivative liabilities |
||||||||||||||||
Total liabilities |
$ | $ | $ | $ | ||||||||||||
2022 |
||||||||||||||||
(Amounts in millions) |
Total |
Level 1 |
Level 2 |
Level 3 |
||||||||||||
Liabilities |
||||||||||||||||
Policyholder account balances: |
||||||||||||||||
Fixed indexed annuity embedded derivatives |
$ | $ | $ | $ | ||||||||||||
Indexed universal life embedded derivatives |
||||||||||||||||
Total policyholder account balances |
||||||||||||||||
Derivative liabilities: |
||||||||||||||||
Interest rate swaps |
||||||||||||||||
Total derivative liabilities |
||||||||||||||||
Total liabilities |
$ | $ | $ | $ | ||||||||||||
(Amounts in millions) |
Beginning balance as of January 1, 2023 |
Total realized and unrealized (gains) losses |
Purchases |
Sales |
Issuances |
Settlements |
Transfer into Level 3 |
Transfer out of Level 3 |
Ending balance as of December 31, 2023 |
Total (gains) losses attributable to liabilities still held |
||||||||||||||||||||||||||||||||||||||
Included in net (income) |
Included in OCI |
Included in net (income) |
Included in OCI |
|||||||||||||||||||||||||||||||||||||||||||||
Policyholder account balances: |
||||||||||||||||||||||||||||||||||||||||||||||||
Fixed indexed annuity embedded derivatives |
$ |
$ |
$ |
$ |
$ |
$ |
$ |
( |
) |
$ |
$ |
( |
) |
$ |
$ |
$ |
||||||||||||||||||||||||||||||||
Indexed universal life embedded derivatives |
( |
) |
( |
) |
||||||||||||||||||||||||||||||||||||||||||||
Total policyholder account balances |
( |
) |
( |
) |
||||||||||||||||||||||||||||||||||||||||||||
Derivative liabilities: |
||||||||||||||||||||||||||||||||||||||||||||||||
Forward bond purchase commitments |
||||||||||||||||||||||||||||||||||||||||||||||||
Total derivative liabilities |
||||||||||||||||||||||||||||||||||||||||||||||||
Total Level 3 liabilities |
$ |
$ |
$ |
$ |
$ |
$ |
$ |
( |
) |
$ |
$ |
( |
) |
$ |
$ |
$ |
||||||||||||||||||||||||||||||||
(Amounts in millions) |
Beginning balance as of January 1, 2022 |
Total realized and unrealized (gains) losses |
Purchases |
Sales |
Issuances |
Settlements |
Transfer into Level 3 |
Transfer out of Level 3 |
Ending balance as of December 31, 2022 |
Total (gains) losses attributable to liabilities still held |
||||||||||||||||||||||||||||||||||||||
Included in net (income) |
Included in OCI |
Included in net (income) |
Included in OCI |
|||||||||||||||||||||||||||||||||||||||||||||
Policyholder account balances: |
||||||||||||||||||||||||||||||||||||||||||||||||
Fixed indexed annuity embedded derivatives |
$ |
$ |
( |
) |
$ |
$ |
$ |
$ |
$ |
( |
) |
$ |
$ |
( |
) |
$ |
$ |
( |
) |
$ |
||||||||||||||||||||||||||||
Indexed universal life embedded derivatives |
( |
) |
( |
) |
||||||||||||||||||||||||||||||||||||||||||||
Total policyholder account balances |
( |
) |
( |
) |
( |
) |
( |
) |
||||||||||||||||||||||||||||||||||||||||
Total Level 3 liabilities |
$ |
$ |
( |
) |
$ |
$ |
$ |
$ |
$ |
( |
) |
$ |
$ |
( |
) |
$ |
$ |
( |
) |
$ |
||||||||||||||||||||||||||||
(Amounts in millions) |
Beginning balance as of January 1, 2021 |
Total realized and unrealized (gains) losses |
Purchases |
Sales |
Issuances |
Settlements |
Transfer into Level 3 |
Transfer out of Level 3 |
Ending balance as of December 31, 2021 |
Total (gains) losses attributable to liabilities still held |
||||||||||||||||||||||||||||||||||||||
Included in net (income) |
Included in OCI |
Included in net (income) |
Included in OCI |
|||||||||||||||||||||||||||||||||||||||||||||
Policyholder account balances: |
||||||||||||||||||||||||||||||||||||||||||||||||
Fixed indexed annuity embedded derivatives |
$ |
$ |
$ |
$ |
$ |
$ |
$ |
( |
) |
$ |
$ |
( |
) |
$ |
$ |
$ |
||||||||||||||||||||||||||||||||
Indexed universal life embedded derivatives |
( |
) |
( |
) |
||||||||||||||||||||||||||||||||||||||||||||
Total policyholder account balances |
( |
) |
( |
) |
||||||||||||||||||||||||||||||||||||||||||||
Total Level 3 liabilities |
$ |
$ |
$ |
$ |
$ |
$ |
$ |
( |
) |
$ |
$ |
( |
) |
$ |
$ |
$ |
||||||||||||||||||||||||||||||||
(Amounts in millions) |
2023 |
2022 |
2021 |
|||||||||
Total realized and unrealized (gains) losses included in net (income): |
||||||||||||
$ |
$ |
$ |
||||||||||
( |
) |
|||||||||||
$ |
$ |
( |
) |
$ |
||||||||
Total (gains) losses included in net (income) attributable to liabilities still held: |
||||||||||||
$ |
$ |
$ |
||||||||||
( |
) |
|||||||||||
$ |
$ |
( |
) |
$ |
||||||||
(Amounts in millions) |
Valuation technique |
Fair value |
Unobservable input |
Range |
Weighted- average (1) | |||||||
Policyholder account balances: |
||||||||||||
Fixed indexed annuity embedded derivatives |
method |
$ |
Expected future interest credited |
|||||||||
Indexed universal life embedded derivatives |
method |
$ |
Expected future interest credited |
|||||||||
Market risk benefits (2) : |
||||||||||||
GMWB utilization rate |
||||||||||||
Non-performance risk (credit spreads) |
||||||||||||
Fixed indexed annuities |
model |
$ |
Expected future interest credited |
|||||||||
Lapse rate |
||||||||||||
GMWB utilization rate |
||||||||||||
Non-performance risk (credit spreads) |
||||||||||||
Variable annuities |
model |
$ |
Equity index volatility |
|||||||||
Derivative liabilities: |
||||||||||||
Forward bond purchase commitments |
cash flows |
$ |
Counterparty financing spreads |
Not applicable |
(1) |
Unobservable inputs weighted by the policyholder account balances associated with the instrument. |
(2) |
Refer to note 13 for additional details related to MRBs. |
2023 |
||||||||||||||||||||||||
(Amounts in millions) |
Notional amount |
Carrying amount |
Fair value |
|||||||||||||||||||||
Total |
Level 1 |
Level 2 |
Level 3 |
|||||||||||||||||||||
Assets: |
||||||||||||||||||||||||
Commercial mortgage loans, net |
(1 |
) |
$ | $ | $ | $ | $ | |||||||||||||||||
Bank loan investments |
(1 |
) |
||||||||||||||||||||||
Liabilities: |
||||||||||||||||||||||||
Long-term borrowings (2) |
(1 |
) |
||||||||||||||||||||||
Investment contracts |
(1 |
) |
||||||||||||||||||||||
Commitments to fund investments: |
||||||||||||||||||||||||
Bank loan investments |
$ | |||||||||||||||||||||||
Private placement investments |
||||||||||||||||||||||||
Commercial mortgage loans |
(1) |
These financial instruments do not have notional amounts. |
(2) |
See note 17 for additional information related to borrowings. |
2022 |
||||||||||||||||||||||||
Notional amount |
Carrying amount |
Fair value |
||||||||||||||||||||||
(Amounts in millions) |
Total |
Level 1 |
Level 2 |
Level 3 |
||||||||||||||||||||
Assets: |
||||||||||||||||||||||||
Commercial mortgage loans, net |
(1 |
) |
$ | $ | $ | $ | $ | |||||||||||||||||
Bank loan investments |
(1 |
) |
||||||||||||||||||||||
Liabilities: |
||||||||||||||||||||||||
Long-term borrowings (2) |
(1 |
) |
||||||||||||||||||||||
Investment contracts |
(1 |
) |
||||||||||||||||||||||
Commitments to fund investments: |
||||||||||||||||||||||||
Bank loan investments |
$ | |||||||||||||||||||||||
Private placement investments |
||||||||||||||||||||||||
Commercial mortgage loans |
(1) |
These financial instruments do not have notional amounts. |
(2) |
See note 17 for additional information related to borrowings. |
2023 |
2022 |
|||||||||||||||
(Amounts in millions) |
Carrying value |
Commitments to fund |
Carrying value |
Commitments to fund |
||||||||||||
Limited partnerships accounted for at NAV: |
||||||||||||||||
Private equity funds (1) |
$ | $ | $ | $ | ||||||||||||
Real estate funds (2) |
||||||||||||||||
Infrastructure funds (3) |
||||||||||||||||
Total limited partnerships accounted for at NAV |
||||||||||||||||
Limited partnerships accounted for at fair value |
||||||||||||||||
Limited partnerships accounted for under the equity method of accounting |
||||||||||||||||
Total |
$ | $ | $ | $ | ||||||||||||
(1) |
This class employs various investment strategies such as leveraged buyout, growth equity, venture capital and mezzanine financing, generally investing in debt or equity positions directly in companies or assets of various sizes across diverse industries globally, primarily concentrated in North America. |
(2) |
This class invests in real estate in North America, Europe and Asia via direct property ownership, joint ventures, mortgages and investments in debt and equity instruments. |
(3) |
This class invests in the debt or equity of cash flow generating assets diversified across a variety of industries, including transportation, energy infrastructure, renewable power, social infrastructure, power generation, water, telecommunications and other regulated entities globally. |
• | In 2023 and 2022, River Lake VI had a permitted accounting practice from the State of Delaware to carry its excess of loss reinsurance agreements with The Canada Life Assurance Company for its universal and term life insurance business assumed from Genworth Life and Annuity Insurance Company (“GLAIC”) as an admitted asset. |
• | In 2023 and 2022, River Lake X had a permitted accounting practice from the State of Vermont to carry its excess of loss reinsurance agreement with Hannover Life Reassurance Company of America for its term life insurance business assumed from GLAIC as an admitted asset. |
Years ended December 31, |
||||||||||||
(Amounts in millions) |
2023 |
2022 |
2021 |
|||||||||
Combined statutory net income (loss): |
||||||||||||
Life insurance subsidiaries, excluding captive life reinsurance |
$ | $ | $ | |||||||||
Mortgage insurance subsidiaries |
||||||||||||
Combined statutory net income, excluding captive |
||||||||||||
Captive life reinsurance subsidiaries |
( |
) | ||||||||||
Combined statutory net income (loss) |
$ | $ | $ | ( |
) | |||||||
As of December 31, |
||||||||
(Amounts in millions) |
2023 |
2022 |
||||||
Combined statutory capital and surplus: |
||||||||
Life insurance subsidiaries, excluding captive life reinsurance subsidiaries |
$ | $ | ||||||
Mortgage insurance subsidiaries |
||||||||
Combined statutory capital and surplus |
$ | $ | ||||||
2023 |
||||||||||||||||||||
(Amounts in millions) |
Enact |
Long-Term Care Insurance |
Life and Annuities |
Corporate and Other |
Total |
|||||||||||||||
Revenues: |
||||||||||||||||||||
Premiums |
$ | $ | $ | $ | $ | |||||||||||||||
Net investment income |
||||||||||||||||||||
Net investment gains (losses) |
( |
) |
( |
) | ( |
) | ||||||||||||||
Policy fees and other income |
( |
) | ||||||||||||||||||
|
|
|
|
|
|
|
|
|
|
|||||||||||
Total revenues |
( |
) | ||||||||||||||||||
|
|
|
|
|
|
|
|
|
|
|||||||||||
Benefits and expenses: |
||||||||||||||||||||
Benefits and other changes in policy reserves |
( |
) | ||||||||||||||||||
Liability remeasurement (gains) losses |
||||||||||||||||||||
Changes in fair value of market risk benefits and associated hedges |
( |
) | ( |
) | ||||||||||||||||
Interest credited |
||||||||||||||||||||
Acquisition and operating expenses, net of deferrals |
||||||||||||||||||||
Amortization of deferred acquisition costs and intangibles |
||||||||||||||||||||
Interest expense |
||||||||||||||||||||
|
|
|
|
|
|
|
|
|
|
|||||||||||
Total benefits and expenses |
||||||||||||||||||||
|
|
|
|
|
|
|
|
|
|
|||||||||||
Income (loss) from continuing operations before income taxes |
( |
) |
( |
) |
( |
) |
||||||||||||||
Provision (benefit) for income taxes |
( |
) | ( |
) | ( |
) | ||||||||||||||
|
|
|
|
|
|
|
|
|
|
|||||||||||
Income (loss) from continuing operations |
( |
) | ( |
) | ( |
) | ||||||||||||||
Income from discontinued operations, net of taxes |
||||||||||||||||||||
|
|
|
|
|
|
|
|
|
|
|||||||||||
Net income (loss) |
( |
) | ( |
) | ( |
) | ||||||||||||||
Less: net income from continuing operations attributable to noncontrolling interests |
||||||||||||||||||||
Less: net income from discontinued operations attributable to noncontrolling interests |
||||||||||||||||||||
|
|
|
|
|
|
|
|
|
|
|||||||||||
Net income (loss) available to Genworth Financial, Inc.’s common stockholders |
$ | $ | ( |
) | $ | ( |
) | $ | ( |
) | $ | |||||||||
|
|
|
|
|
|
|
|
|
|
|||||||||||
Net income (loss) available to Genworth Financial, Inc.’s common stockholders: |
||||||||||||||||||||
Income (loss) from continuing operations available to Genworth Financial, Inc.’s common stockholders |
$ | $ | ( |
) | $ | ( |
) | $ | ( |
) | $ | |||||||||
Income from discontinued operations available to Genworth Financial, Inc.’s common stockholders |
||||||||||||||||||||
|
|
|
|
|
|
|
|
|
|
|||||||||||
Net income (loss) available to Genworth Financial, Inc.’s common stockholders |
$ | $ | ( |
) | $ | ( |
) | $ | ( |
) | $ | |||||||||
|
|
|
|
|
|
|
|
|
|
|||||||||||
Total assets |
$ | $ | $ | $ | $ | |||||||||||||||
|
|
|
|
|
|
|
|
|
|
2022 |
||||||||||||||||||||
(Amounts in millions) |
Enact |
Long-Term Care Insurance |
Life and Annuities |
Corporate and Other |
Total |
|||||||||||||||
Revenues: |
||||||||||||||||||||
Premiums |
$ | $ | $ | $ | $ | |||||||||||||||
Net investment income |
||||||||||||||||||||
Net investment gains (losses) |
( |
) | ( |
) | ( |
) | ( |
) | ||||||||||||
Policy fees and other income |
||||||||||||||||||||
|
|
|
|
|
|
|
|
|
|
|||||||||||
Total revenues |
( |
) | ||||||||||||||||||
|
|
|
|
|
|
|
|
|
|
|||||||||||
Benefits and expenses: |
||||||||||||||||||||
Benefits and other changes in policy reserves |
( |
) | ( |
) | ||||||||||||||||
Liability remeasurement (gains) losses |
( |
) | ( |
) | ||||||||||||||||
Changes in fair value of market risk benefits and associated hedges |
( |
) | ( |
) | ||||||||||||||||
Interest credited |
||||||||||||||||||||
Acquisition and operating expenses, net of deferrals |
||||||||||||||||||||
Amortization of deferred acquisition costs and intangibles |
||||||||||||||||||||
Interest expense |
||||||||||||||||||||
|
|
|
|
|
|
|
|
|
|
|||||||||||
Total benefits and expenses |
||||||||||||||||||||
|
|
|
|
|
|
|
|
|
|
|||||||||||
Income (loss) from continuing operations before income taxes |
( |
) | ||||||||||||||||||
Provision (benefit) for income taxes |
( |
) | ||||||||||||||||||
|
|
|
|
|
|
|
|
|
|
|||||||||||
Income (loss) from continuing operations |
( |
) | ||||||||||||||||||
Income from discontinued operations, net of taxes |
||||||||||||||||||||
|
|
|
|
|
|
|
|
|
|
|||||||||||
Net income (loss) |
( |
) | ||||||||||||||||||
Less: net income from continuing operations attributable to noncontrolling interests |
||||||||||||||||||||
Less: net income from discontinued operations attributable to noncontrolling interests |
||||||||||||||||||||
|
|
|
|
|
|
|
|
|
|
|||||||||||
Net income (loss) available to Genworth Financial, Inc.’s common stockholders |
$ | $ | $ | $ | ( |
) | $ | |||||||||||||
|
|
|
|
|
|
|
|
|
|
|||||||||||
Net income (loss) available to Genworth Financial, Inc.’s common stockholders: |
||||||||||||||||||||
Income (loss) from continuing operations available to Genworth Financial, Inc.’s common stockholders |
$ | $ | $ | $ | ( |
) | $ | |||||||||||||
Income from discontinued operations available to Genworth Financial, Inc.’s common stockholders |
||||||||||||||||||||
|
|
|
|
|
|
|
|
|
|
|||||||||||
Net income (loss) available to Genworth Financial, Inc.’s common stockholders |
$ | $ | $ | $ | ( |
) | $ | |||||||||||||
|
|
|
|
|
|
|
|
|
|
|||||||||||
Total assets |
$ | $ | $ | $ | $ | |||||||||||||||
|
|
|
|
|
|
|
|
|
|
2021 |
||||||||||||||||||||
(Amounts in millions) |
Enact |
Long-Term Care Insurance |
Life and Annuities |
Corporate and Other |
Total |
|||||||||||||||
Revenues: |
||||||||||||||||||||
Premiums |
$ | $ | $ | ( |
) | $ | $ | |||||||||||||
Net investment income |
||||||||||||||||||||
Net investment gains (losses) |
( |
) | ( |
) | ||||||||||||||||
Policy fees and other income |
||||||||||||||||||||
|
|
|
|
|
|
|
|
|
|
|||||||||||
Total revenues |
||||||||||||||||||||
|
|
|
|
|
|
|
|
|
|
|||||||||||
Benefits and expenses: |
||||||||||||||||||||
Benefits and other changes in policy reserves |
( |
) | ||||||||||||||||||
Liability remeasurement (gains) losses |
||||||||||||||||||||
Changes in fair value of market risk benefits and associated hedges |
( |
) | ( |
) | ||||||||||||||||
Interest credited |
||||||||||||||||||||
Acquisition and operating expenses, net of deferrals |
||||||||||||||||||||
Amortization of deferred acquisition costs and intangibles |
||||||||||||||||||||
Interest expense |
||||||||||||||||||||
|
|
|
|
|
|
|
|
|
|
|||||||||||
Total benefits and expenses |
||||||||||||||||||||
|
|
|
|
|
|
|
|
|
|
|||||||||||
Income (loss) from continuing operations before income taxes |
( |
) | ||||||||||||||||||
Provision (benefit) for income taxes |
( |
) | ||||||||||||||||||
|
|
|
|
|
|
|
|
|
|
|||||||||||
Income (loss) from continuing operations |
( |
) | ||||||||||||||||||
Income from discontinued operations, net of taxes |
||||||||||||||||||||
|
|
|
|
|
|
|
|
|
|
|||||||||||
Net income (loss) |
( |
) | ||||||||||||||||||
Less: net income from continuing operations attributable to noncontrolling interests |
||||||||||||||||||||
Less: net income from discontinued operations attributable to noncontrolling interests |
||||||||||||||||||||
|
|
|
|
|
|
|
|
|
|
|||||||||||
Net income (loss) available to Genworth Financial, Inc.’s common stockholders |
$ | $ | $ | $ | ( |
) | $ | |||||||||||||
|
|
|
|
|
|
|
|
|
|
|||||||||||
Net income (loss) available to Genworth Financial, Inc.’s common stockholders: |
||||||||||||||||||||
Income (loss) from continuing operations available to Genworth Financial, Inc.’s common stockholders |
$ | $ | $ | $ | ( |
) | $ | |||||||||||||
Income from discontinued operations available to Genworth Financial, Inc.’s common stockholders |
||||||||||||||||||||
|
|
|
|
|
|
|
|
|
|
|||||||||||
Net income (loss) available to Genworth Financial, Inc.’s common stockholders |
$ | $ | $ | $ | ( |
) | $ | |||||||||||||
|
|
|
|
|
|
|
|
|
|
(Amounts in millions) |
2023 |
2022 |
2021 |
|||||||||
Revenues: |
||||||||||||
Enact segment |
$ |
$ |
$ |
|||||||||
Long-Term Care Insurance segment |
||||||||||||
Life and Annuities segment: |
||||||||||||
Life insurance |
||||||||||||
Fixed annuities |
||||||||||||
Variable annuities |
||||||||||||
Life and Annuities segment |
||||||||||||
Corporate and Other |
( |
) |
( |
) |
||||||||
Total revenues |
$ |
$ |
$ |
|||||||||
(Amounts in millions) |
2023 |
2022 |
2021 |
|||||||||
Net income available to Genworth Financial, Inc.’s common stockholders |
$ |
$ |
$ |
|||||||||
Add: net income from continuing operations attributable to noncontrolling interests |
||||||||||||
Add: net income from discontinued operations attributable to noncontrolling interests |
||||||||||||
Net income |
||||||||||||
Less: income from discontinued operations, net of taxes |
||||||||||||
Income from continuing operations |
||||||||||||
Less: net income from continuing operations attributable to noncontrolling interests |
||||||||||||
Income from continuing operations available to Genworth Financial, Inc.’s common stockholders |
||||||||||||
Adjustments to income from continuing operations available to Genworth Financial, Inc.’s common stockholders: |
||||||||||||
Net investment (gains) losses, net (1) |
( |
) |
( |
) | ||||||||
Changes in fair value of market risk benefits attributable to interest rates, equity markets and associated hedges (2) |
( |
) |
( |
) |
( |
) | ||||||
(Gains) losses on early extinguishment of debt (3) |
( |
) |
||||||||||
Expenses related to restructuring |
||||||||||||
Pension plan termination costs |
||||||||||||
Taxes on adjustments |
||||||||||||
Adjusted operating income available to Genworth Financial, Inc.’s common stockholders |
$ |
$ |
$ |
|||||||||
(1) |
For the year ended December 31, 2023, net investment (gains) losses were adjusted for the portion attributable to noncontrolling interests of $ |
(2) |
Changes in fair value of market risk benefits and associated hedges were adjusted to exclude changes in reserves, attributed fees and benefit payments of $( |
(3) |
See note 17 for additional information on (gains) losses on early extinguishment of debt during 2023 and 2022. During 2021, we paid pre-tax make-whole premiums of $ |
(Amounts in millions) |
2023 |
2022 |
2021 |
|||||||||
Adjusted operating income (loss) available to Genworth Financial, Inc.’s common stockholders: |
||||||||||||
Enact segment |
$ | $ | $ | |||||||||
Long-Term Care Insurance segment |
( |
) | ||||||||||
Life and Annuities segment: |
||||||||||||
Life insurance |
( |
) | ( |
) | ( |
) | ||||||
Fixed annuities |
||||||||||||
Variable annuities |
||||||||||||
Life and Annuities segment |
( |
) | ( |
) | ( |
) | ||||||
Corporate and Other |
( |
) | ( |
) | ( |
) | ||||||
Adjusted operating income available to Genworth Financial, Inc.’s common stockholders |
$ | $ | $ | |||||||||
2023 |
||||||||||||
(Amounts in millions) |
United States |
International (1) |
Total |
|||||||||
Total revenues |
$ | $ | $ | |||||||||
Income from continuing operations |
$ | $ | $ | |||||||||
Net income |
$ | $ | $ | |||||||||
Total assets |
$ | $ | $ | |||||||||
2022 |
||||||||||||
(Amounts in millions) |
United States |
International (1) |
Total |
|||||||||
Total revenues |
$ | $ | $ | |||||||||
Income from continuing operations |
$ | $ | $ | |||||||||
Net income |
$ | $ | $ | |||||||||
Total assets |
$ | $ | $ | |||||||||
2021 |
||||||||||||
(Amounts in millions) |
United States |
International (1) |
Total |
|||||||||
Total revenues |
$ | $ | $ | |||||||||
Income (loss) from continuing operations |
$ | $ | ( |
) | $ | |||||||
Net income (loss) |
$ | $ | ( |
) | $ | |||||||
(1) |
Predominantly comprised of operations in Mexico. |
Three months ended |
||||||||||||||||
(Amounts in millions, except per share amounts) |
March 31, 2023 |
June 30, 2023 |
September 30, 2023 |
December 31, 2023 |
||||||||||||
Total revenues (1) |
$ | $ | $ | $ | ||||||||||||
Total benefits and expenses (2), (3), (4) |
$ | $ | $ | $ | ||||||||||||
Income (loss) from continuing operations (1), (2), (3), (4) |
$ | $ | $ | $ | ( |
) | ||||||||||
Income (loss) from discontinued operations, net of taxes |
$ | $ | $ | $ | ( |
) | ||||||||||
Net income (loss) (1), (2), (3), (4) |
$ | $ | $ | $ | ( |
) | ||||||||||
Net income from continuing operations attributable to noncontrolling interests |
$ | $ | $ | $ | ||||||||||||
Net income from discontinued operations attributable to noncontrolling interests |
$ | $ | $ | $ | ||||||||||||
Net income (loss) available to Genworth Financial, Inc.’s common stockholders (1), (2), (3), (4) |
$ | $ | $ | $ | ( |
) | ||||||||||
Net income (loss) available to Genworth Financial, Inc.’s common stockholders: |
||||||||||||||||
Income (loss) from continuing operations available to Genworth Financial, Inc.’s common stockholders |
$ | $ | $ | $ | ( |
) | ||||||||||
Income (loss) from discontinued operations available to Genworth Financial, Inc.’s common stockholders |
( |
) | ||||||||||||||
Net income (loss) available to Genworth Financial, Inc.’s common stockholders |
$ | $ | $ | $ | ( |
) | ||||||||||
Income (loss) from continuing operations available to Genworth Financial, Inc.’s common stockholders per share: |
||||||||||||||||
Basic |
$ | $ | $ | $ | ( |
) | ||||||||||
Diluted |
$ | $ | $ | $ | ( |
) | ||||||||||
Net income (loss) available to Genworth Financial, Inc.’s common stockholders per share: |
||||||||||||||||
Basic |
$ | $ | $ | $ | ( |
) | ||||||||||
Diluted |
$ | $ | $ | $ | ( |
) | ||||||||||
Weighted-average common shares outstanding: |
||||||||||||||||
Basic |
||||||||||||||||
Diluted (5) |
(1) |
Pre-tax net investment gains of $million associated wi th limited partnerships and changes in the fair value of equity securities resulted in an increase in total revenues in the fourth quarter of 2023. |
(2) |
In the fourth quarter of 2023, our long-term care insurance business had a pre-tax liability remeasurement loss of $million that included adverse pre-tax cash flow assumption updates of $million driven mostly by unfavorable updates to our healthy life assumptions to better reflect near-term experience related to cost of care, mortality, incidence and lapse, partially offset by a favorable update to our disabled life mortality assumptions to reflect an expectation that mortality will continue at elevated levels in the near term post COVID-19. The liability remeasurement loss also included pre-tax unfavorable actual versus expected experience of $million due primarily to higher claims and unfavorable timing impacts related to a second legal settlement. |
(3) |
In the fourth quarter of 2023, our life insurance products included adverse pre-tax cash flow assumption updates of $million reflecting unfavorable persistency and mortality assumption updates. |
(4) |
In the fourth quarter of 2023, our Enact segment recorded a favorable pre-tax reserve release of $million primarily related to cure performance on delinquencies from 2022 and earlier, including those related to COVID-19. |
(5) |
Under applicable accounting guidance, companies in a loss position are required to use basic weighted-average common shares outstanding in the calculation of diluted loss per share. Therefore, as a result of our loss from continuing operations available to Genworth Financial, Inc.’s common stockholders for the three months ended December 31, 2023, we were required to use basic weighted-average common shares outstanding in the calculation of diluted loss per share as the inclusion of shares for PSUs , RSUs and other equity-based awards of |
Three months ended |
||||||||||||||||
(Amounts in millions, except per share amounts) |
March 31, 2022 |
June 30, 2022 |
September 30, 2022 |
December 31, 2022 |
||||||||||||
Total revenues |
$ | $ | $ | $ | ||||||||||||
Total benefits and expenses (1), (2) |
$ | $ | $ | $ | ||||||||||||
Income from continuing operations (1), (2) |
$ | $ | $ | $ | ||||||||||||
Income (loss) from discontinued operations, net of taxes |
$ | ( |
) | $ | ( |
) | $ | $ | ( |
) | ||||||
Net income (1), (2) |
$ | $ | $ | $ | ||||||||||||
Net income from continuing operations attributable to noncontrolling |
$ | $ | $ | $ | ||||||||||||
Net income from discontinued operations attributable to noncontrolling interests |
$ | $ | $ | $ | ||||||||||||
Net income available to Genworth Financial, Inc.’s common stockholders (1), (2) |
$ | $ | $ | $ | ||||||||||||
Net income available to Genworth Financial, Inc.’s common stockholders: |
||||||||||||||||
Income from continuing operations available to Genworth Financial, Inc.’s common stockholders |
$ | $ | $ | $ | ||||||||||||
Income (loss) from discontinued operations available to Genworth Financial, Inc.’s common stockholders |
( |
) | ( |
) | ( |
) | ||||||||||
Net income available to Genworth Financial, Inc.’s common stockholders |
$ | $ | $ | $ | ||||||||||||
Income from continuing operations available to Genworth Financial, Inc.’s common stockholders per share: |
||||||||||||||||
Basic |
$ | $ | $ | $ | ||||||||||||
Diluted |
$ | $ | $ | $ | ||||||||||||
Net income available to Genworth Financial, Inc.’s common stockholders per share: |
||||||||||||||||
Basic |
$ | $ | $ | $ | ||||||||||||
Diluted |
$ | $ | $ | $ | ||||||||||||
Weighted-average common shares outstanding: |
||||||||||||||||
Basic |
||||||||||||||||
Diluted |
(1) | In the fourth quarter of 2022, our long-term care insurance business had a pre-tax liability remeasurement gain of $million primarily from favorable pre-tax cash flow assumption updates o f $which reflected an expected reserve reduction, net of estimated settlement payments, attributable to the inclusion of a second legal settlement. This settlement primarily impacted older, unprofitable capped cohorts. |
(2) |
In the fourth quarter of 2022, our Enact segment recorded a net favorable pre-tax reserve release of $ |
(Amounts in millions) |
Net unrealized investment gains (losses) |
Derivatives qualifying as hedges (1) |
Change in the discount rate used to measure future policy benefits |
Change in instrument- specific credit risk of market risk benefits |
Foreign currency translation and other adjustments |
Total |
||||||||||||||||||
Balances as of January 1, 2023 |
$ | ( |
) | $ | $ | ( |
) | $ | ( |
) | $ | $ | ( |
) | ||||||||||
OCI before reclassifications |
( |
) | ( |
) | ||||||||||||||||||||
Amounts reclassified from OCI |
( |
) | ( |
) | ||||||||||||||||||||
|
|
|
|
|
|
|
|
|
|
|
|
|||||||||||||
Current period OCI |
( |
) | ( |
) | ||||||||||||||||||||
|
|
|
|
|
|
|
|
|
|
|
|
|||||||||||||
Balances as of December 31, 2023 before noncontrolling interests |
( |
) | ( |
) | ( |
) | ( |
) | ||||||||||||||||
Less: change in OCI attributable to noncontrolling interests |
||||||||||||||||||||||||
|
|
|
|
|
|
|
|
|
|
|
|
|||||||||||||
Balances as of December 31, 2023 |
$ | ( |
) | $ | $ | ( |
) | $ | ( |
) | $ | $ | ( |
) | ||||||||||
|
|
|
|
|
|
|
|
|
|
|
|
(1) |
See note 6 for additional information. |
(Amounts in millions) |
Net unrealized investment gains (losses) |
Derivatives qualifying as hedges (1) |
Change in the discount rate used to measure future policy benefits |
Change in instrument- specific credit risk of market risk benefits |
Foreign currency translation and other adjustments |
Total |
||||||||||||||||||
Balances as of January 1, 2022 |
$ | $ | $ | ( |
) | $ | ( |
) | $ | ( |
) | $ | ( |
) | ||||||||||
OCI before reclassifications |
( |
) | ( |
) | ||||||||||||||||||||
Amounts reclassified from OCI |
( |
) | ( |
) | ( |
) | ||||||||||||||||||
|
|
|
|
|
|
|
|
|
|
|
|
|||||||||||||
Current period OCI |
( |
) | ( |
) | ||||||||||||||||||||
|
|
|
|
|
|
|
|
|
|
|
|
|||||||||||||
Balances as of December 31, 202 2 before noncontrolling interests |
( |
) | ( |
) | ( |
) | ( |
) | ||||||||||||||||
Less: change in OCI attributable to noncontrolling interests |
( |
) | ( |
) | ||||||||||||||||||||
|
|
|
|
|
|
|
|
|
|
|
|
|||||||||||||
Balances as of December 31, 2022 |
$ | ( |
) | $ | $ | ( |
) | $ | ( |
) | $ | $ | ( |
) | ||||||||||
|
|
|
|
|
|
|
|
|
|
|
|
(1) | See note 6 for additional information. |
(Amounts in millions) |
Net unrealized investment gains (losses) |
Derivatives qualifying as hedges (1) |
Change in the discount rate used to measure future policy benefits |
Change in instrument- specific credit risk of market risk benefits |
Foreign currency translation and other adjustments |
Total |
||||||||||||||||||
Balances as of January 1, 2021 |
$ |
$ |
$ |
( |
) |
$ |
( |
) |
$ |
$ |
( |
) | ||||||||||||
OCI before reclassifications |
( |
) |
( |
) |
||||||||||||||||||||
Amounts reclassified from OCI |
( |
) |
( |
) |
( |
) | ||||||||||||||||||
|
|
|
|
|
|
|
|
|
|
|
|
|||||||||||||
Current period OCI |
( |
) |
( |
) |
||||||||||||||||||||
|
|
|
|
|
|
|
|
|
|
|
|
|||||||||||||
Balances as of December 31, 2021 before noncontrolling interests |
( |
) |
( |
) |
( |
) | ||||||||||||||||||
Less: change in OCI attributable to noncontrolling interests |
( |
) |
||||||||||||||||||||||
|
|
|
|
|
|
|
|
|
|
|
|
|||||||||||||
Balances as of December 31, 2021 |
$ |
$ |
$ |
( |
) |
$ |
( |
) |
$ |
( |
) |
$ |
( |
) | ||||||||||
|
|
|
|
|
|
|
|
|
|
|
|
(1) | See note 6 for additional information. |
Amount reclassified from accumulated other comprehensive income (loss) |
Affected line item in the consolidated statements of income | |||||||||||||
Years ended December 31, |
||||||||||||||
(Amounts in millions) |
2023 |
2022 |
2021 |
|||||||||||
Net unrealized investment (gains) losses: |
||||||||||||||
Unrealized (gains) losses on investments |
$ | $ | $ | ( |
) | Net investment (gains) losses | ||||||||
Income taxes |
( |
) | Provision for income taxes | |||||||||||
|
|
|
|
|
|
|||||||||
Total |
$ | $ | $ | ( |
) | |||||||||
|
|
|
|
|
|
|||||||||
Derivatives designated as hedges: |
||||||||||||||
Interest rate swaps hedging assets |
$ | ( |
) | $ | ( |
) | $ | ( |
) | Net investment income | ||||
Interest rate swaps hedging assets |
( |
) | ( |
) | ( |
) | Net investment (gains) losses | |||||||
Interest rate swaps hedging liabilities |
Interest expense | |||||||||||||
Interest rate swaps hedging liabilities |
( |
) | Net investment (gains) losses | |||||||||||
Forward bond purchase commitments |
( |
) | Net investment (gains) losses | |||||||||||
Foreign currency swaps |
( |
) | Net investment (gains) losses | |||||||||||
Income taxes |
Provision for income taxes | |||||||||||||
|
|
|
|
|
|
|||||||||
Total |
$ | ( |
) | $ | ( |
) | $ | ( |
) | |||||
|
|
|
|
|
|
(Amounts in millions) |
||||
Net income available to Genworth Financial, Inc.’s common stockholders |
$ | |||
Transfers to noncontrolling interests: |
||||
Decrease in Genworth Financial, Inc.’s additional paid-in capital for initial sale of Enact Holdings shares to noncontrolling interests |
( |
) | ||
|
|
|||
Net transfers to noncontrolling interests |
( |
) | ||
|
|
|||
Change from net income available to Genworth Financial, Inc.’s common stockholders and transfers to noncontrolling interests |
$ | |||
|
|
(Amounts in millions) |
||||
Net cash proceeds |
$ | |||
Add: carrying value of noncontrolling interests (1) |
||||
|
|
|||
Total adjusted consideration (2) |
||||
Carrying value of the disposal group before accumulated other comprehensive (income) loss |
||||
Add: total accumulated other comprehensive (income) loss of disposal group (3) |
||||
|
|
|||
Total adjusted carrying value of the disposal group |
||||
Pre-tax loss on sale |
( |
) | ||
Tax benefit on sale |
||||
|
|
|||
After-tax gain (loss) on sale |
$ | |||
|
|
(1) | In accordance with accounting guidance on the deconsolidation of a subsidiary or group of assets, the carrying amount of any noncontrolling interests in the subsidiary sold (adjusted to reflect amounts in accumulated other comprehensive income (loss) recognized upon final disposition) is added to the total fair value of the consideration received. |
(2) | Represents the aggregate of the net cash proceeds received upon sale closing plus the adjusted carrying amount of noncontrolling interests in the subsidiary sold. |
(3) | Amount consists of $ |
(Amounts in millions) |
||||
Revenues: |
||||
Premiums |
$ | |||
Net investment income |
||||
Net investment gains (losses) |
( |
) | ||
|
|
|||
Total revenues |
||||
|
|
|||
Benefits and expenses: |
||||
Benefits and other changes in policy reserves |
||||
Acquisition and operating expenses, net of deferrals |
||||
Amortization of deferred acquisition costs and intangibles |
||||
Interest expense |
||||
|
|
|||
Total benefits and expenses |
||||
|
|
|||
Income before income taxes and gain (loss) on sale (1) |
||||
Provision for income taxes |
||||
|
|
|||
Income before gain (loss) on sale |
||||
Gain (loss) on sale, net of taxes |
||||
|
|
|||
Income from discontinued operations, net of taxes |
||||
|
|
|||
Less: net income from discontinued operations attributable to noncontrolling interests |
||||
|
|
|||
Income from discontinued operations available to Genworth Financial, Inc.’s common stockholders |
$ | |||
|
|
(1) |
The year ended December 31, 2021 included pre-tax income from discontinued operations available to Genworth Financial, Inc.’s common stockholders of $ |
Type of investment |
Amortized cost or cost (1) |
Fair value |
Carrying value |
|||||||||
Fixed maturity securities: |
||||||||||||
Bonds: |
||||||||||||
U.S. government, agencies and authorities |
$ | $ | $ | |||||||||
State and political subdivisions |
||||||||||||
Non-U.S. government |
||||||||||||
Public utilities |
||||||||||||
All other corporate bonds |
||||||||||||
|
|
|
|
|
|
|||||||
Total fixed maturity securities |
||||||||||||
Equity securities |
||||||||||||
Commercial mortgage loans, net |
xxxxx | |||||||||||
Policy loans |
xxxxx | |||||||||||
Limited partnerships |
xxxxx | |||||||||||
Other invested assets |
xxxxx | |||||||||||
|
|
|
|
|
|
|||||||
Total investments |
$ | xxxxx | $ | |||||||||
|
|
|
|
|
|
(1) | Amortized cost for fixed maturity securities and short-term investments, which are included in other invested assets, represents original cost reduced by repayments and adjusted for amortization of premium or accretion of discount. Cost for equity securities represents original cost, and cost for limited partnerships represents original cost adjusted for distributions. Cost for derivatives, which are included in other invested assets, represents the original cost of the positions. |
December 31, |
||||||||
2023 |
2022 |
|||||||
(As adjusted) |
||||||||
Assets: |
||||||||
Investments in subsidiaries |
$ | $ | ||||||
Deferred tax asset |
||||||||
Other assets |
||||||||
|
|
|
|
|||||
Total assets |
$ | $ | ||||||
|
|
|
|
|||||
|
|
|
|
|
|
|
|
|
Liabilities and stockholders’ equity |
||||||||
Liabilities: |
||||||||
Other liabilities |
$ | $ | ||||||
Intercompany notes payable |
||||||||
|
|
|
|
|||||
Total liabilities |
||||||||
|
|
|
|
|||||
|
|
|
|
|
|
|
|
|
Commitments and contingencies |
||||||||
Stockholders’ equity: |
||||||||
Common stock |
||||||||
Additional paid-in capital |
||||||||
Accumulated other comprehensive income (loss) |
( |
) | ( |
) | ||||
Retained earnings |
||||||||
Treasury stock, at cost |
( |
) | ( |
) | ||||
|
|
|
|
|||||
Total Genworth Financial, Inc.’s stockholders’ equity |
||||||||
|
|
|
|
|||||
Total liabilities and stockholders’ equity |
$ | $ | ||||||
|
|
|
|
Years ended December 31, |
||||||||||||
2023 |
2022 |
2021 |
||||||||||
(As adjusted) |
(As adjusted) |
|||||||||||
Revenues: |
||||||||||||
Net investment income |
$ | $ | $ | ( |
) | |||||||
|
|
|
|
|
|
|||||||
Total revenues |
( |
) | ||||||||||
|
|
|
|
|
|
|||||||
Expenses: |
||||||||||||
Acquisition and operating expenses, net of deferrals |
||||||||||||
Interest expense |
( |
) | ||||||||||
|
|
|
|
|
|
|||||||
Total expenses |
||||||||||||
|
|
|
|
|
|
|||||||
Loss before income taxes and equity in income of subsidiaries |
( |
) | ( |
) | ( |
) | ||||||
Benefit from income taxes |
( |
) | ( |
) | ( |
) | ||||||
Equity in income of subsidiaries |
||||||||||||
|
|
|
|
|
|
|||||||
Net income available to Genworth Financial, Inc.’s common stockholders |
$ | $ | $ | |||||||||
|
|
|
|
|
|
Years ended December 31, |
||||||||||||
2023 |
2022 |
2021 |
||||||||||
(As adjusted) |
(As adjusted) |
|||||||||||
Net income available to Genworth Financial, Inc.’s common stockholders |
$ | $ | $ | |||||||||
Other comprehensive income (loss), net of taxes: |
||||||||||||
Net unrealized gains (losses) on securities without an allowance for credit losses |
( |
) | ( |
) | ||||||||
Net unrealized gains (losses) on securities with an allowance for credit losses |
||||||||||||
Derivatives qualifying as hedges |
( |
) | ( |
) | ( |
) | ||||||
Change in discount rate used to measure future policy benefits |
( |
) | ||||||||||
Change in instrument-specific credit risk of market risk benefits |
||||||||||||
Foreign currency translation and other adjustments |
( |
) | ||||||||||
|
|
|
|
|
|
|||||||
Total other comprehensive income |
||||||||||||
|
|
|
|
|
|
|||||||
Total comprehensive income available to Genworth Financial, Inc.’s common stockholders |
$ | $ | $ | |||||||||
|
|
|
|
|
|
Years ended December 31, |
||||||||||||
2023 |
2022 |
2021 |
||||||||||
(As adjusted) |
(As adjusted) |
|||||||||||
Cash flows from (used by) operating activities: |
||||||||||||
Net income available to Genworth Financial, Inc.’s common stockholders |
$ | $ | $ | |||||||||
Adjustments to reconcile net income available to Genworth Financial, Inc.’s common stockholders to net cash from (used by) operating activities: |
||||||||||||
Equity in income from subsidiaries |
( |
) | ( |
) | ( |
) | ||||||
Deferred income taxes |
( |
) | ( |
) | ||||||||
Long-term incentive compensation expense |
||||||||||||
Change in certain assets and liabilities: |
||||||||||||
Accrued investment income and other assets |
( |
) | ||||||||||
Current tax assets |
( |
) | ( |
) | ||||||||
Other liabilities |
( |
) | ||||||||||
|
|
|
|
|
|
|||||||
Net cash from (used by) operating activities |
( |
) | ||||||||||
|
|
|
|
|
|
|||||||
Cash flows used by investing activities: |
||||||||||||
Capital contributions paid to subsidiaries |
( |
) | ( |
) | ( |
) | ||||||
|
|
|
|
|
|
|||||||
Net cash used by investing activities |
( |
) | ( |
) | ( |
) | ||||||
|
|
|
|
|
|
|||||||
Cash flows from (used by) financing activities: |
||||||||||||
Intercompany notes payable, net |
||||||||||||
Treasury stock acquired in connection with share repurchases |
( |
) | ( |
) | ||||||||
Other, net |
( |
) | ( |
) | ( |
) | ||||||
|
|
|
|
|
|
|||||||
Net cash from (used by) financing activities |
( |
) | ( |
) | ||||||||
|
|
|
|
|
|
|||||||
Effect of exchange rate changes on cash, cash equivalents and restricted cash |
||||||||||||
|
|
|
|
|
|
|||||||
Net change in cash, cash equivalents and restricted cash |
||||||||||||
Cash, cash equivalents and restricted cash at beginning of year |
||||||||||||
|
|
|
|
|
|
|||||||
Cash, cash equivalents and restricted cash at end of year |
$ | $ | $ | |||||||||
|
|
|
|
|
|
(Amounts in millions) |
As originally reported |
Effect of adopting LDTI |
As adjusted |
|||||||||
Assets: |
||||||||||||
Investments in subsidiaries |
$ | $ | ( |
) | $ | |||||||
Total assets |
$ | $ | ( |
) | $ | |||||||
Equity: |
||||||||||||
Accumulated other comprehensive income (loss) |
$ | ( |
) | $ | ( |
) | $ | ( |
) | |||
Retained earnings |
$ | $ | ( |
) | $ | |||||||
Total Genworth Financial, Inc.’s stockholders’ equity |
$ | $ | ( |
) | $ |
2022 |
2021 |
|||||||||||||||||||||||
(Amounts in millions) |
As originally reported |
Effect of adopting LDTI |
As adjusted |
As originally reported |
Effect of adopting LDTI |
As adjusted |
||||||||||||||||||
Equity in income of subsidiaries |
$ |
$ |
$ |
$ |
$ |
( |
) |
$ |
||||||||||||||||
Net income available to Genworth Financial, Inc.’s common stockholders |
$ |
$ |
$ |
$ |
$ |
( |
) |
$ |
2022 |
2021 |
|||||||||||||||||||||||
(Amounts in millions) |
As originally reported |
Effect of adopting LDTI |
As adjusted |
As originally reported |
Effect of adopting LDTI |
As adjusted |
||||||||||||||||||
Cash flows from (used by) operating activities: |
||||||||||||||||||||||||
Net income available to Genworth Financial, Inc.’s common |
$ | $ | $ | $ | $ | ( |
) | $ | ||||||||||||||||
Equity in income from subsidiaries |
$ | ( |
) | $ | ( |
) | $ | ( |
) | $ | ( |
) | $ | $ | ( |
) |
Segment |
Deferred Acquisition Costs |
Future Policy Benefits |
Policyholder Account Balances |
Liability for Policy and Contract Claims |
Unearned Premiums |
|||||||||||||||
December 31, 2023 |
||||||||||||||||||||
Enact |
$ | $ | $ | $ | $ | |||||||||||||||
Long-Term Care Insurance |
||||||||||||||||||||
Life and Annuities |
||||||||||||||||||||
Corporate and Other |
||||||||||||||||||||
|
|
|
|
|
|
|
|
|
|
|||||||||||
Total |
$ | $ | $ | $ | $ | |||||||||||||||
|
|
|
|
|
|
|
|
|
|
|||||||||||
December 31, 2022 |
||||||||||||||||||||
Enact |
$ | $ | $ | $ | $ | |||||||||||||||
Long-Term Care Insurance |
||||||||||||||||||||
Life and Annuities |
||||||||||||||||||||
Corporate and Other |
||||||||||||||||||||
|
|
|
|
|
|
|
|
|
|
|||||||||||
Total |
$ | $ | $ | $ | $ | |||||||||||||||
|
|
|
|
|
|
|
|
|
|
Segment |
Premium Revenue |
Net Investment Income |
Interest Credited and Benefits and Other Changes in Policy Reserves (1) |
Amortization of Deferred Acquisition Costs |
Other Operating Expenses |
Premiums Written |
||||||||||||||||||
Year ended December 31, 2023 |
||||||||||||||||||||||||
Enact |
$ | $ | $ | $ | $ | $ | ||||||||||||||||||
Long-Term Care Insurance |
||||||||||||||||||||||||
Life and Annuities |
||||||||||||||||||||||||
Corporate and Other |
( |
) | ||||||||||||||||||||||
|
|
|
|
|
|
|
|
|
|
|
|
|||||||||||||
Total |
$ | $ | $ | $ | $ | $ | ||||||||||||||||||
|
|
|
|
|
|
|
|
|
|
|
|
|||||||||||||
Year ended December 31, 2022 |
||||||||||||||||||||||||
Enact |
$ | $ | $ | ( |
) | $ | $ | $ | ||||||||||||||||
Long-Term Care Insurance |
||||||||||||||||||||||||
Life and Annuities |
||||||||||||||||||||||||
Corporate and Other |
( |
) | ||||||||||||||||||||||
|
|
|
|
|
|
|
|
|
|
|
|
|||||||||||||
Total |
$ | $ | $ | $ | $ | $ | ||||||||||||||||||
|
|
|
|
|
|
|
|
|
|
|
|
|||||||||||||
Year ended December 31, 2021 |
||||||||||||||||||||||||
Enact |
$ | $ | $ | $ | $ | $ | ||||||||||||||||||
Long-Term Care Insurance |
||||||||||||||||||||||||
Life and Annuities |
( |
) | ( |
) | ||||||||||||||||||||
Corporate and Other |
( |
) | ||||||||||||||||||||||
|
|
|
|
|
|
|
|
|
|
|
|
|||||||||||||
Total |
$ | $ | $ | $ | $ | $ | ||||||||||||||||||
|
|
|
|
|
|
|
|
|
|
|
|
(1) |
Interest credited and benefits and other changes in policy reserves includes changes in policy reserves resulting from liability remeasurement (gains) losses and excludes changes in fair value of market risk benefits and associated hedges of $( |
/s/ Thomas J. McInerney |
Thomas J. McInerney |
President and Chief Executive Officer |
(Principal Executive Officer) |
/s/ Jerome T. Upton |
Jerome T. Upton |
Executive Vice President and Chief Financial Officer |
(Principal Financial Officer) |
Name |
Age |
Positions | ||||
Thomas J. McInerney |
67 |
President and Chief Executive Officer | ||||
Jerome T. Upton |
60 |
Executive Vice President and Chief Financial Officer | ||||
Jamala M. Arland |
42 |
Executive Vice President—U.S. Life Insurance | ||||
Rohit Gupta |
49 |
President and Chief Executive Officer, Enact | ||||
Melissa Hagerman |
56 |
Executive Vice President and Chief Human Resources Officer | ||||
Mark Blakeley Hodges |
44 |
Executive Vice President and Chief Risk Officer | ||||
Gregory S. Karawan |
59 |
Executive Vice President and General Counsel | ||||
Kelly Saltzgaber |
59 |
Executive Vice President and Chief Investment Officer | ||||
Andrea Lynn White |
58 |
Executive Vice President—CareScout Insurance | ||||
G. Kent Conrad |
75 |
Director, member of Nominating and Corporate Governance and Risk Committees | ||||
Karen E. Dyson |
64 |
Director, member of Audit and Management Development and Compensation Committees | ||||
Jill R. Goodman |
57 |
Director, member of Management Development and Compensation and Nominating and Corporate Governance Committees | ||||
Melina E. Higgins |
56 |
Non-Executive Chair of the Board, member of Audit and Management Development and Compensation Committees | ||||
Howard D. Mills, III |
59 |
Director, member of Nominating and Corporate Governance and Risk Committees | ||||
Robert P. Restrepo Jr. |
73 |
Director, member of Audit and Management Development and Compensation Committees | ||||
Elaine A. Sarsynski |
68 |
Director, member of Audit and Risk Committees | ||||
Ramsey D. Smith |
56 |
Director, member of Nominating and Corporate Governance and Risk Committees |
a. | Documents filed as part of this report. | |
1. | Financial Statements (see Item 8. Financial Statements and Supplementary Data) | |
Report of KPMG LLP, Independent Registered Public Accounting Firm | ||
Consolidated Balance Sheets as of December 31, 2023 and 2022 | ||
Consolidated Statements of Income for the years ended December 31, 2023, 2022 and 2021 | ||
Consolidated Statements of Comprehensive Income for the years ended December 31, 2023, 2022 and 2021 | ||
Consolidated Statements of Changes in Equity for the years ended December 31, 2023, 2022 and 2021 | ||
Consolidated Statements of Cash Flows for the years ended December 31, 2023, 2022 and 2021 | ||
Notes to Consolidated Financial Statements | ||
2. | Financial Statement Schedules | |
Schedule I—Summary of Investments—Other Than Investments in Related Parties | ||
Schedule II—Financial Statements of Genworth Financial, Inc. (Parent Only) | ||
Schedule III—Supplemental Insurance Information |
Number |
Description | |
101.DEF | Inline XBRL Taxonomy Extension Definition Linkbase Document | |
104 | The cover page for the Company’s Annual Report on Form 10-K for the year ended December 31, 2023, has been formatted in Inline XBRL |
§ | Management contract or compensatory plan or arrangement. |
GENWORTH FINANCIAL, INC. | ||
By: | /s/ Thomas J. McInerney | |
Name: |
Thomas J. McInerney | |
Title: |
President and Chief Executive Officer; Director | |
(Principal Executive Officer) |
/s/ Thomas J. McInerney Thomas J. McInerney |
President and Chief Executive Officer; Director (Principal Executive Officer) | |
/s/ Jerome T. Upton Jerome T. Upton |
Executive Vice President and Chief Financial Officer (Principal Financial Officer) | |
/s/ Darren W. Woodell Darren W. Woodell |
Vice President and Controller (Principal Accounting Officer) | |
* G. Kent Conrad |
Director | |
* Karen E. Dyson |
Director | |
* Jill R. Goodman |
Director | |
* Howard D. Mills, III |
Director | |
* Robert P. Restrepo Jr. |
Director | |
* Elaine A. Sarsynski |
Director | |
* Ramsey D. Smith |
Director | |
* Melina E. Higgins |
Director |
**By | /s/ Thomas J. McInerney | |
Thomas J. McInerney Attorney-in-Fact |