Second Quarter Financial Supplement June 30, 2026 Exhibit 99.2
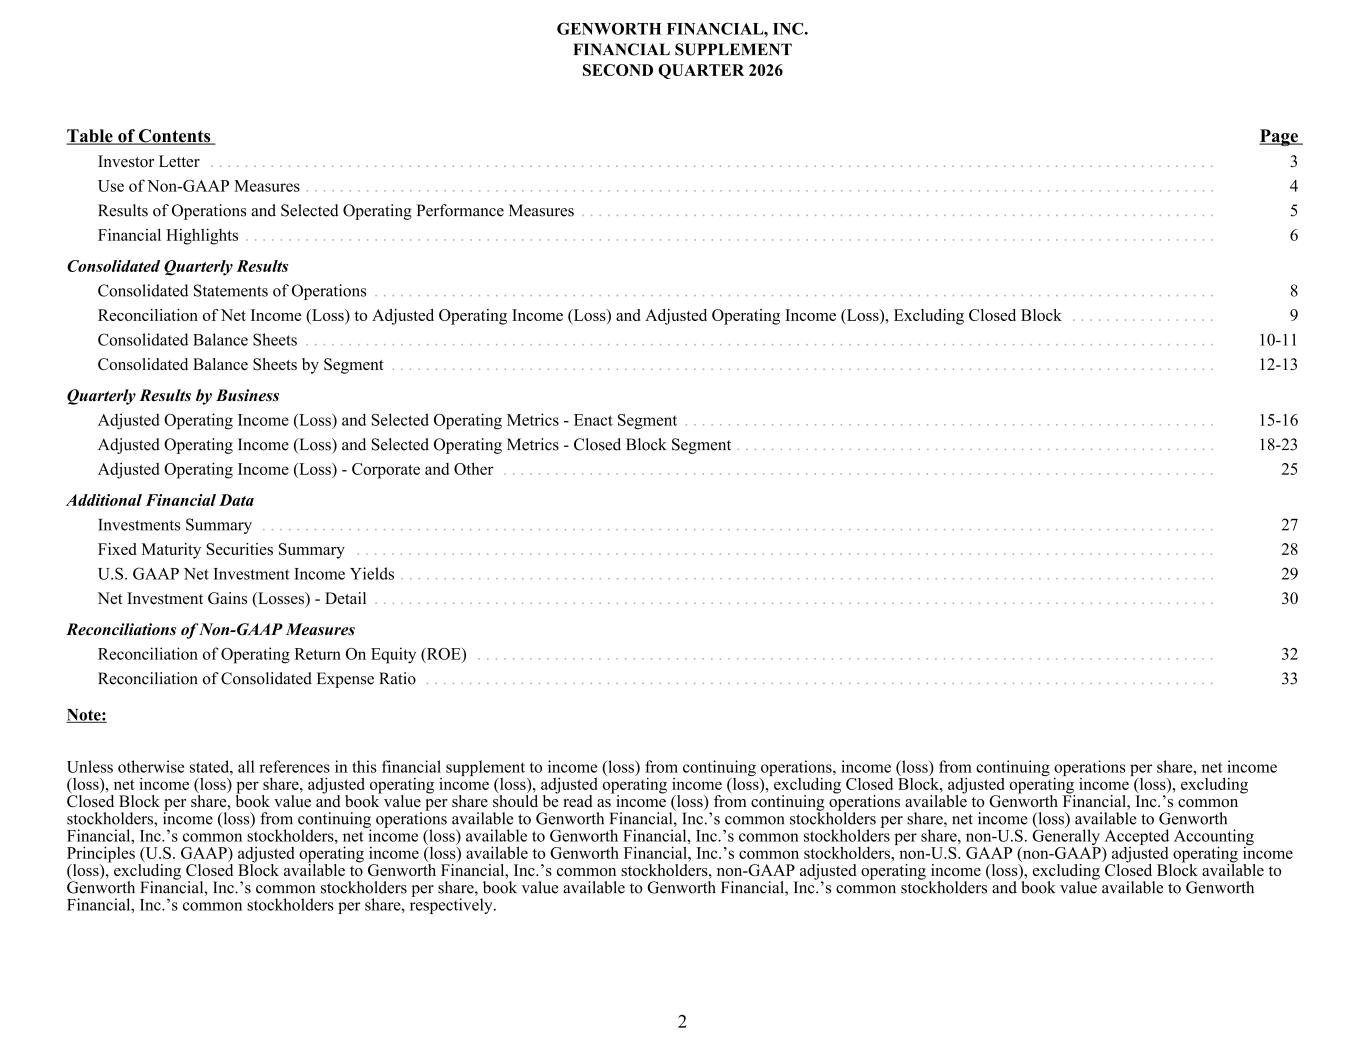
Table of Contents Page Investor Letter . . . . . . . . . . . . . . . . . . . . . . . . . . . . . . . . . . . . . . . . . . . . . . . . . . . . . . . . . . . . . . . . . . . . . . . . . . . . . . . . . . . . . . . . . . . . . . . . . . . . . . . . . . . . . . . . . . . . . 3 Use of Non-GAAP Measures . . . . . . . . . . . . . . . . . . . . . . . . . . . . . . . . . . . . . . . . . . . . . . . . . . . . . . . . . . . . . . . . . . . . . . . . . . . . . . . . . . . . . . . . . . . . . . . . . . . . . . . . . . 4 Results of Operations and Selected Operating Performance Measures . . . . . . . . . . . . . . . . . . . . . . . . . . . . . . . . . . . . . . . . . . . . . . . . . . . . . . . . . . . . . . . . . . . . . . . . . . 5 Financial Highlights . . . . . . . . . . . . . . . . . . . . . . . . . . . . . . . . . . . . . . . . . . . . . . . . . . . . . . . . . . . . . . . . . . . . . . . . . . . . . . . . . . . . . . . . . . . . . . . . . . . . . . . . . . . . . . . . . 6 Consolidated Quarterly Results Consolidated Statements of Operations . . . . . . . . . . . . . . . . . . . . . . . . . . . . . . . . . . . . . . . . . . . . . . . . . . . . . . . . . . . . . . . . . . . . . . . . . . . . . . . . . . . . . . . . . . . . . . . . . . 8 Reconciliation of Net Income (Loss) to Adjusted Operating Income (Loss) and Adjusted Operating Income (Loss), Excluding Closed Block . . . . . . . . . . . . . . . . . 9 Consolidated Balance Sheets . . . . . . . . . . . . . . . . . . . . . . . . . . . . . . . . . . . . . . . . . . . . . . . . . . . . . . . . . . . . . . . . . . . . . . . . . . . . . . . . . . . . . . . . . . . . . . . . . . . . . . . . . . 10-11 Consolidated Balance Sheets by Segment . . . . . . . . . . . . . . . . . . . . . . . . . . . . . . . . . . . . . . . . . . . . . . . . . . . . . . . . . . . . . . . . . . . . . . . . . . . . . . . . . . . . . . . . . . . . . . . . 12-13 Quarterly Results by Business Adjusted Operating Income (Loss) and Selected Operating Metrics - Enact Segment . . . . . . . . . . . . . . . . . . . . . . . . . . . . . . . . . . . . . . . . . . . . . . . . . . . . . . . . . . . . . . 15-16 Adjusted Operating Income (Loss) and Selected Operating Metrics - Closed Block Segment . . . . . . . . . . . . . . . . . . . . . . . . . . . . . . . . . . . . . . . . . . . . . . . . . . . . . . . . 18-23 Adjusted Operating Income (Loss) - Corporate and Other . . . . . . . . . . . . . . . . . . . . . . . . . . . . . . . . . . . . . . . . . . . . . . . . . . . . . . . . . . . . . . . . . . . . . . . . . . . . . . . . . . . 25 Additional Financial Data Investments Summary . . . . . . . . . . . . . . . . . . . . . . . . . . . . . . . . . . . . . . . . . . . . . . . . . . . . . . . . . . . . . . . . . . . . . . . . . . . . . . . . . . . . . . . . . . . . . . . . . . . . . . . . . . . . . . . 27 Fixed Maturity Securities Summary . . . . . . . . . . . . . . . . . . . . . . . . . . . . . . . . . . . . . . . . . . . . . . . . . . . . . . . . . . . . . . . . . . . . . . . . . . . . . . . . . . . . . . . . . . . . . . . . . . . . 28 U.S. GAAP Net Investment Income Yields . . . . . . . . . . . . . . . . . . . . . . . . . . . . . . . . . . . . . . . . . . . . . . . . . . . . . . . . . . . . . . . . . . . . . . . . . . . . . . . . . . . . . . . . . . . . . . . 29 Net Investment Gains (Losses) - Detail . . . . . . . . . . . . . . . . . . . . . . . . . . . . . . . . . . . . . . . . . . . . . . . . . . . . . . . . . . . . . . . . . . . . . . . . . . . . . . . . . . . . . . . . . . . . . . . . . . 30 Reconciliations of Non-GAAP Measures Reconciliation of Operating Return On Equity (ROE) . . . . . . . . . . . . . . . . . . . . . . . . . . . . . . . . . . . . . . . . . . . . . . . . . . . . . . . . . . . . . . . . . . . . . . . . . . . . . . . . . . . . . . 32 Reconciliation of Consolidated Expense Ratio . . . . . . . . . . . . . . . . . . . . . . . . . . . . . . . . . . . . . . . . . . . . . . . . . . . . . . . . . . . . . . . . . . . . . . . . . . . . . . . . . . . . . . . . . . . . 33 Note: Unless otherwise stated, all references in this financial supplement to income (loss) from continuing operations, income (loss) from continuing operations per share, net income (loss), net income (loss) per share, adjusted operating income (loss), adjusted operating income (loss), excluding Closed Block, adjusted operating income (loss), excluding Closed Block per share, book value and book value per share should be read as income (loss) from continuing operations available to Genworth Financial, Inc.’s common stockholders, income (loss) from continuing operations available to Genworth Financial, Inc.’s common stockholders per share, net income (loss) available to Genworth Financial, Inc.’s common stockholders, net income (loss) available to Genworth Financial, Inc.’s common stockholders per share, non-U.S. Generally Accepted Accounting Principles (U.S. GAAP) adjusted operating income (loss) available to Genworth Financial, Inc.’s common stockholders, non-U.S. GAAP (non-GAAP) adjusted operating income (loss), excluding Closed Block available to Genworth Financial, Inc.’s common stockholders, non-GAAP adjusted operating income (loss), excluding Closed Block available to Genworth Financial, Inc.’s common stockholders per share, book value available to Genworth Financial, Inc.’s common stockholders and book value available to Genworth Financial, Inc.’s common stockholders per share, respectively. GENWORTH FINANCIAL, INC. FINANCIAL SUPPLEMENT SECOND QUARTER 2026 2
Dear Investor, Thank you for your continued interest in Genworth Financial, Inc. Please see the accompanying press release and summary presentation posted to the company’s website at https://investor.genworth.com for additional information regarding its second quarter 2026 earnings results. Investors are encouraged to listen to the company’s earnings call on the second quarter 2026 results at 10:00 a.m. (ET) on August 6, 2026. The company’s conference call will be accessible via telephone and internet. The dial-in number for Genworth’s August 6 conference call is 800-330-6710 or 213-279-1505 (outside the U.S.); conference ID #2307160. To participate in the call by webcast, register at least 15 minutes in advance at https://investor.genworth.com. Regards, Christine Jewell Investor Relations InvestorInfo@genworth.com GENWORTH FINANCIAL, INC. FINANCIAL SUPPLEMENT SECOND QUARTER 2026 3
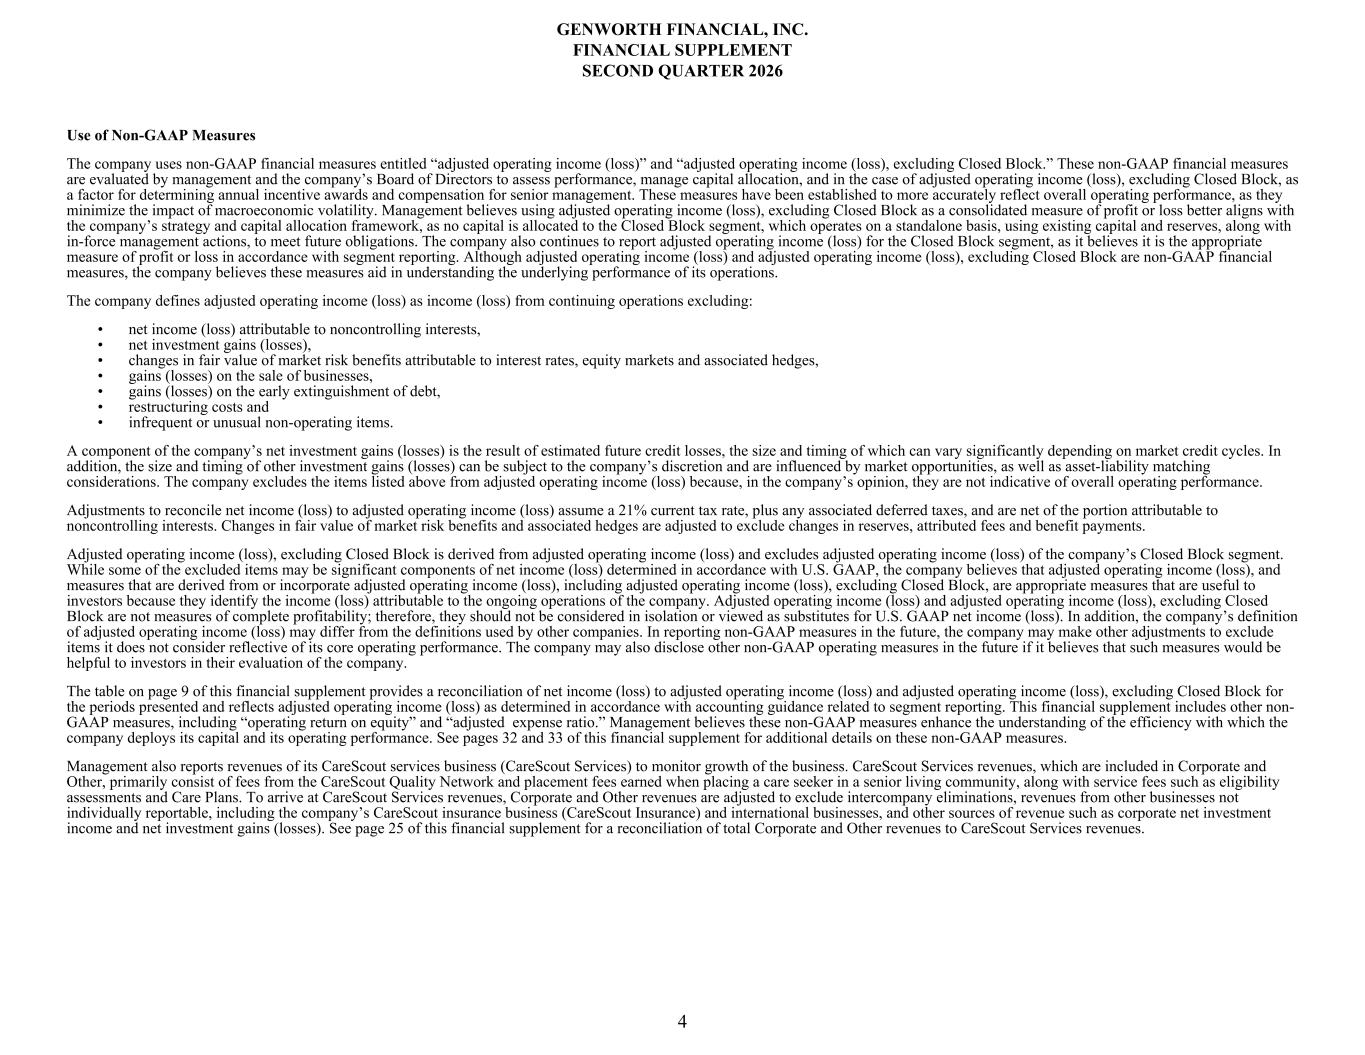
Use of Non-GAAP Measures The company uses non-GAAP financial measures entitled “adjusted operating income (loss)” and “adjusted operating income (loss), excluding Closed Block.” These non-GAAP financial measures are evaluated by management and the company’s Board of Directors to assess performance, manage capital allocation, and in the case of adjusted operating income (loss), excluding Closed Block, as a factor for determining annual incentive awards and compensation for senior management. These measures have been established to more accurately reflect overall operating performance, as they minimize the impact of macroeconomic volatility. Management believes using adjusted operating income (loss), excluding Closed Block as a consolidated measure of profit or loss better aligns with the company’s strategy and capital allocation framework, as no capital is allocated to the Closed Block segment, which operates on a standalone basis, using existing capital and reserves, along with in-force management actions, to meet future obligations. The company also continues to report adjusted operating income (loss) for the Closed Block segment, as it believes it is the appropriate measure of profit or loss in accordance with segment reporting. Although adjusted operating income (loss) and adjusted operating income (loss), excluding Closed Block are non-GAAP financial measures, the company believes these measures aid in understanding the underlying performance of its operations. The company defines adjusted operating income (loss) as income (loss) from continuing operations excluding: • net income (loss) attributable to noncontrolling interests, • net investment gains (losses), • changes in fair value of market risk benefits attributable to interest rates, equity markets and associated hedges, • gains (losses) on the sale of businesses, • gains (losses) on the early extinguishment of debt, • restructuring costs and • infrequent or unusual non-operating items. A component of the company’s net investment gains (losses) is the result of estimated future credit losses, the size and timing of which can vary significantly depending on market credit cycles. In addition, the size and timing of other investment gains (losses) can be subject to the company’s discretion and are influenced by market opportunities, as well as asset-liability matching considerations. The company excludes the items listed above from adjusted operating income (loss) because, in the company’s opinion, they are not indicative of overall operating performance. Adjustments to reconcile net income (loss) to adjusted operating income (loss) assume a 21% current tax rate, plus any associated deferred taxes, and are net of the portion attributable to noncontrolling interests. Changes in fair value of market risk benefits and associated hedges are adjusted to exclude changes in reserves, attributed fees and benefit payments. Adjusted operating income (loss), excluding Closed Block is derived from adjusted operating income (loss) and excludes adjusted operating income (loss) of the company’s Closed Block segment. While some of the excluded items may be significant components of net income (loss) determined in accordance with U.S. GAAP, the company believes that adjusted operating income (loss), and measures that are derived from or incorporate adjusted operating income (loss), including adjusted operating income (loss), excluding Closed Block, are appropriate measures that are useful to investors because they identify the income (loss) attributable to the ongoing operations of the company. Adjusted operating income (loss) and adjusted operating income (loss), excluding Closed Block are not measures of complete profitability; therefore, they should not be considered in isolation or viewed as substitutes for U.S. GAAP net income (loss). In addition, the company’s definition of adjusted operating income (loss) may differ from the definitions used by other companies. In reporting non-GAAP measures in the future, the company may make other adjustments to exclude items it does not consider reflective of its core operating performance. The company may also disclose other non-GAAP operating measures in the future if it believes that such measures would be helpful to investors in their evaluation of the company. The table on page 9 of this financial supplement provides a reconciliation of net income (loss) to adjusted operating income (loss) and adjusted operating income (loss), excluding Closed Block for the periods presented and reflects adjusted operating income (loss) as determined in accordance with accounting guidance related to segment reporting. This financial supplement includes other non- GAAP measures, including “operating return on equity” and “adjusted expense ratio.” Management believes these non-GAAP measures enhance the understanding of the efficiency with which the company deploys its capital and its operating performance. See pages 32 and 33 of this financial supplement for additional details on these non-GAAP measures. Management also reports revenues of its CareScout services business (CareScout Services) to monitor growth of the business. CareScout Services revenues, which are included in Corporate and Other, primarily consist of fees from the CareScout Quality Network and placement fees earned when placing a care seeker in a senior living community, along with service fees such as eligibility assessments and Care Plans. To arrive at CareScout Services revenues, Corporate and Other revenues are adjusted to exclude intercompany eliminations, revenues from other businesses not individually reportable, including the company’s CareScout insurance business (CareScout Insurance) and international businesses, and other sources of revenue such as corporate net investment income and net investment gains (losses). See page 25 of this financial supplement for a reconciliation of total Corporate and Other revenues to CareScout Services revenues. GENWORTH FINANCIAL, INC. FINANCIAL SUPPLEMENT SECOND QUARTER 2026 4
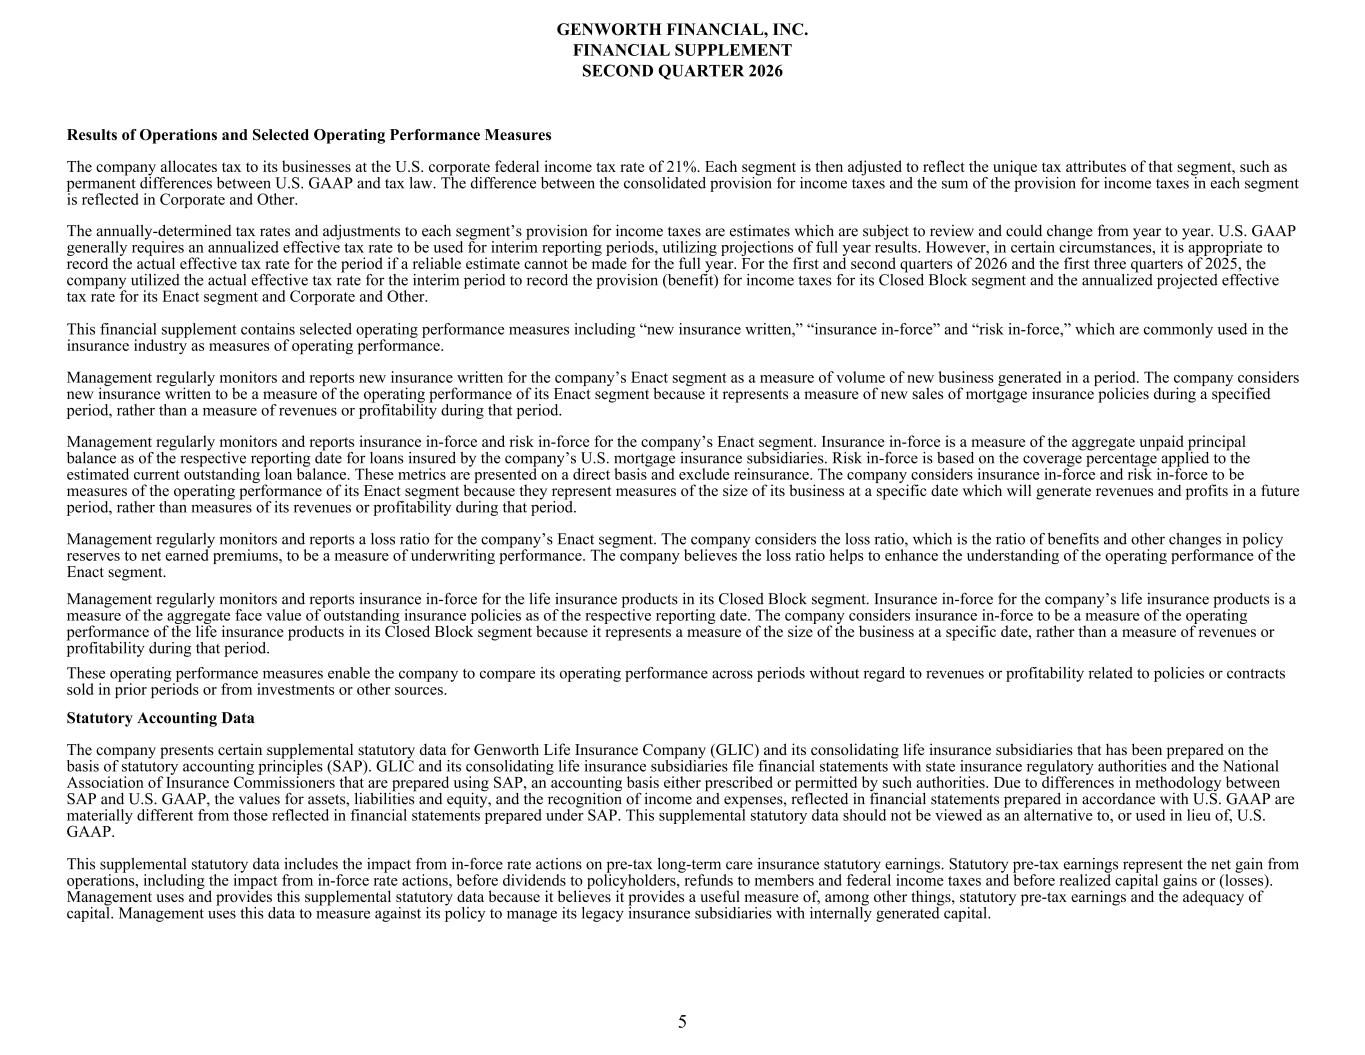
Results of Operations and Selected Operating Performance Measures The company allocates tax to its businesses at the U.S. corporate federal income tax rate of 21%. Each segment is then adjusted to reflect the unique tax attributes of that segment, such as permanent differences between U.S. GAAP and tax law. The difference between the consolidated provision for income taxes and the sum of the provision for income taxes in each segment is reflected in Corporate and Other. The annually-determined tax rates and adjustments to each segment’s provision for income taxes are estimates which are subject to review and could change from year to year. U.S. GAAP generally requires an annualized effective tax rate to be used for interim reporting periods, utilizing projections of full year results. However, in certain circumstances, it is appropriate to record the actual effective tax rate for the period if a reliable estimate cannot be made for the full year. For the first and second quarters of 2026 and the first three quarters of 2025, the company utilized the actual effective tax rate for the interim period to record the provision (benefit) for income taxes for its Closed Block segment and the annualized projected effective tax rate for its Enact segment and Corporate and Other. This financial supplement contains selected operating performance measures including “new insurance written,” “insurance in-force” and “risk in-force,” which are commonly used in the insurance industry as measures of operating performance. Management regularly monitors and reports new insurance written for the company’s Enact segment as a measure of volume of new business generated in a period. The company considers new insurance written to be a measure of the operating performance of its Enact segment because it represents a measure of new sales of mortgage insurance policies during a specified period, rather than a measure of revenues or profitability during that period. Management regularly monitors and reports insurance in-force and risk in-force for the company’s Enact segment. Insurance in-force is a measure of the aggregate unpaid principal balance as of the respective reporting date for loans insured by the company’s U.S. mortgage insurance subsidiaries. Risk in-force is based on the coverage percentage applied to the estimated current outstanding loan balance. These metrics are presented on a direct basis and exclude reinsurance. The company considers insurance in-force and risk in-force to be measures of the operating performance of its Enact segment because they represent measures of the size of its business at a specific date which will generate revenues and profits in a future period, rather than measures of its revenues or profitability during that period. Management regularly monitors and reports a loss ratio for the company’s Enact segment. The company considers the loss ratio, which is the ratio of benefits and other changes in policy reserves to net earned premiums, to be a measure of underwriting performance. The company believes the loss ratio helps to enhance the understanding of the operating performance of the Enact segment. Management regularly monitors and reports insurance in-force for the life insurance products in its Closed Block segment. Insurance in-force for the company’s life insurance products is a measure of the aggregate face value of outstanding insurance policies as of the respective reporting date. The company considers insurance in-force to be a measure of the operating performance of the life insurance products in its Closed Block segment because it represents a measure of the size of the business at a specific date, rather than a measure of revenues or profitability during that period. These operating performance measures enable the company to compare its operating performance across periods without regard to revenues or profitability related to policies or contracts sold in prior periods or from investments or other sources. Statutory Accounting Data The company presents certain supplemental statutory data for Genworth Life Insurance Company (GLIC) and its consolidating life insurance subsidiaries that has been prepared on the basis of statutory accounting principles (SAP). GLIC and its consolidating life insurance subsidiaries file financial statements with state insurance regulatory authorities and the National Association of Insurance Commissioners that are prepared using SAP, an accounting basis either prescribed or permitted by such authorities. Due to differences in methodology between SAP and U.S. GAAP, the values for assets, liabilities and equity, and the recognition of income and expenses, reflected in financial statements prepared in accordance with U.S. GAAP are materially different from those reflected in financial statements prepared under SAP. This supplemental statutory data should not be viewed as an alternative to, or used in lieu of, U.S. GAAP. This supplemental statutory data includes the impact from in-force rate actions on pre-tax long-term care insurance statutory earnings. Statutory pre-tax earnings represent the net gain from operations, including the impact from in-force rate actions, before dividends to policyholders, refunds to members and federal income taxes and before realized capital gains or (losses). Management uses and provides this supplemental statutory data because it believes it provides a useful measure of, among other things, statutory pre-tax earnings and the adequacy of capital. Management uses this data to measure against its policy to manage its legacy insurance subsidiaries with internally generated capital. GENWORTH FINANCIAL, INC. FINANCIAL SUPPLEMENT SECOND QUARTER 2026 5
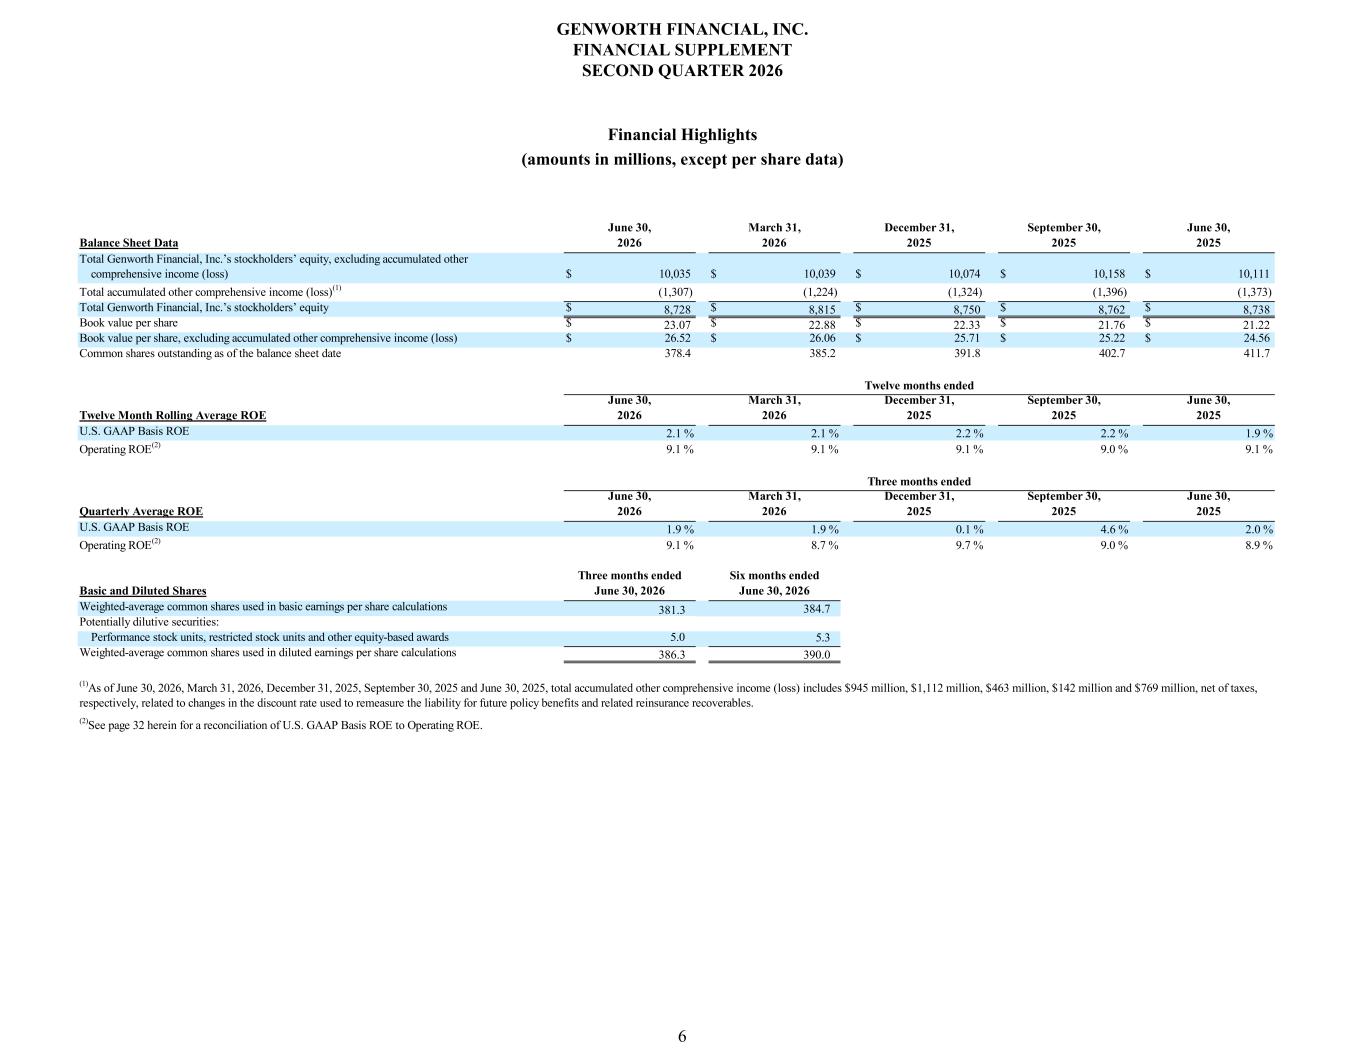
June 30, March 31, December 31, September 30, June 30, Balance Sheet Data 2026 2026 2025 2025 2025 Total Genworth Financial, Inc.’s stockholders’ equity, excluding accumulated other comprehensive income (loss) $ 10,035 $ 10,039 $ 10,074 $ 10,158 $ 10,111 Total accumulated other comprehensive income (loss)(1) (1,307) (1,224) (1,324) (1,396) (1,373) Total Genworth Financial, Inc.’s stockholders’ equity $ $ $ $ $ Book value per share $ 23.07 $ 22.88 $ 22.33 $ 21.76 $ 21.22 Book value per share, excluding accumulated other comprehensive income (loss) $ 26.52 $ 26.06 $ 25.71 $ 25.22 $ 24.56 Common shares outstanding as of the balance sheet date 378.4 385.2 391.8 402.7 411.7 June 30, March 31, December 31, September 30, June 30, Twelve Month Rolling Average ROE 2026 2026 2025 2025 2025 U.S. GAAP Basis ROE 2.1 % 2.1 % 2.2 % 2.2 % 1.9 % Operating ROE(2) 9.1 % 9.1 % 9.1 % 9.0 % 9.1 % June 30, March 31, December 31, September 30, June 30, Quarterly Average ROE 2026 2026 2025 2025 2025 U.S. GAAP Basis ROE 1.9 % 1.9 % 0.1 % 4.6 % 2.0 % Operating ROE(2) 9.1 % 8.7 % 9.7 % 9.0 % 8.9 % Three months ended Six months ended Basic and Diluted Shares June 30, 2026 June 30, 2026 Weighted-average common shares used in basic earnings per share calculations 381.3 384.7 Potentially dilutive securities: Performance stock units, restricted stock units and other equity-based awards 5.0 5.3 Weighted-average common shares used in diluted earnings per share calculations 386.3 390.0 (2)See page 32 herein for a reconciliation of U.S. GAAP Basis ROE to Operating ROE. Three months ended Twelve months ended (1)As of June 30, 2026, March 31, 2026, December 31, 2025, September 30, 2025 and June 30, 2025, total accumulated other comprehensive income (loss) includes $945 million, $1,112 million, $463 million, $142 million and $769 million, net of taxes, respectively, related to changes in the discount rate used to remeasure the liability for future policy benefits and related reinsurance recoverables. 6 Financial Highlights (amounts in millions, except per share data) GENWORTH FINANCIAL, INC. FINANCIAL SUPPLEMENT SECOND QUARTER 2026 8,728 8,815 8,750 8,762 8,738

Consolidated Quarterly Results
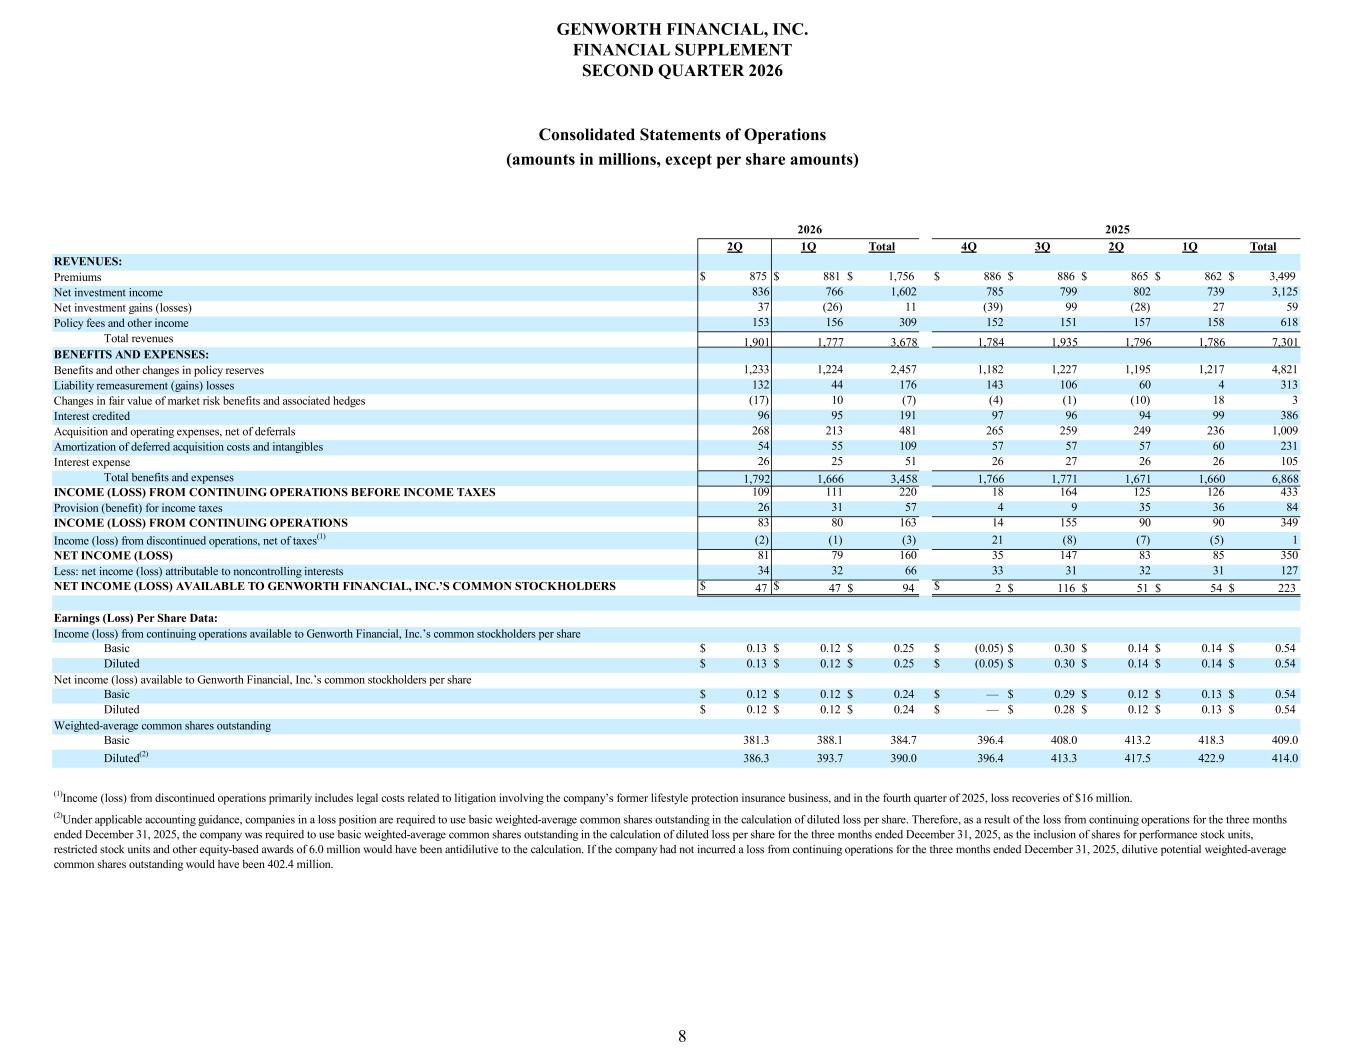
2Q 1Q Total 4Q 3Q 2Q 1Q Total $ 875 $ 881 $ 1,756 $ 886 $ 886 $ 865 $ 862 $ 3,499 836 766 1,602 785 799 802 739 3,125 37 (26) 11 (39) 99 (28) 27 59 153 156 309 152 151 157 158 618 1,901 1,777 3,678 1,784 1,935 1,796 1,786 7,301 1,233 1,224 2,457 1,182 1,227 1,195 1,217 4,821 132 44 176 143 106 60 4 313 (17) 10 (7) (4) (1) (10) 18 3 96 95 191 97 96 94 99 386 268 213 481 265 259 249 236 1,009 54 55 109 57 57 57 60 231 26 25 51 26 27 26 26 105 1,792 1,666 3,458 1,766 1,771 1,671 1,660 6,868 109 111 220 18 164 125 126 433 26 31 57 4 9 35 36 84 83 80 163 14 155 90 90 349 (2) (1) (3) 21 (8) (7) (5) 1 81 79 160 35 147 83 85 350 34 32 66 33 31 32 31 127 $ 47 $ 47 $ 94 $ 2 $ 116 $ 51 $ 54 $ 223 Basic $ 0.13 $ 0.12 $ 0.25 $ (0.05) $ 0.30 $ 0.14 $ 0.14 $ 0.54 Diluted $ 0.13 $ 0.12 $ 0.25 $ (0.05) $ 0.30 $ 0.14 $ 0.14 $ 0.54 Basic $ 0.12 $ 0.12 $ 0.24 $ — $ 0.29 $ 0.12 $ 0.13 $ 0.54 Diluted $ 0.12 $ 0.12 $ 0.24 $ — $ 0.28 $ 0.12 $ 0.13 $ 0.54 Basic 381.3 388.1 384.7 396.4 408.0 413.2 418.3 409.0 Diluted(2) 386.3 393.7 390.0 396.4 413.3 417.5 422.9 414.0 Net income (loss) available to Genworth Financial, Inc.’s common stockholders per share (2)Under applicable accounting guidance, companies in a loss position are required to use basic weighted-average common shares outstanding in the calculation of diluted loss per share. Therefore, as a result of the loss from continuing operations for the three months ended December 31, 2025, the company was required to use basic weighted-average common shares outstanding in the calculation of diluted loss per share for the three months ended December 31, 2025, as the inclusion of shares for performance stock units, restricted stock units and other equity-based awards of 6.0 million would have been antidilutive to the calculation. If the company had not incurred a loss from continuing operations for the three months ended December 31, 2025, dilutive potential weighted-average common shares outstanding would have been 402.4 million. (1)Income (loss) from discontinued operations primarily includes legal costs related to litigation involving the company’s former lifestyle protection insurance business, and in the fourth quarter of 2025, loss recoveries of $16 million. Weighted-average common shares outstanding Income (loss) from discontinued operations, net of taxes(1) NET INCOME (LOSS) NET INCOME (LOSS) AVAILABLE TO GENWORTH FINANCIAL, INC.’S COMMON STOCKHOLDERS Less: net income (loss) attributable to noncontrolling interests Income (loss) from continuing operations available to Genworth Financial, Inc.’s common stockholders per share Earnings (Loss) Per Share Data: Amortization of deferred acquisition costs and intangibles Interest expense INCOME (LOSS) FROM CONTINUING OPERATIONS BEFORE INCOME TAXES Total benefits and expenses INCOME (LOSS) FROM CONTINUING OPERATIONS Provision (benefit) for income taxes BENEFITS AND EXPENSES: Benefits and other changes in policy reserves Changes in fair value of market risk benefits and associated hedges Liability remeasurement (gains) losses Acquisition and operating expenses, net of deferrals Interest credited 2025 Total revenues Policy fees and other income REVENUES: Premiums Net investment gains (losses) Net investment income 2026 8 Consolidated Statements of Operations (amounts in millions, except per share amounts) GENWORTH FINANCIAL, INC. FINANCIAL SUPPLEMENT SECOND QUARTER 2026
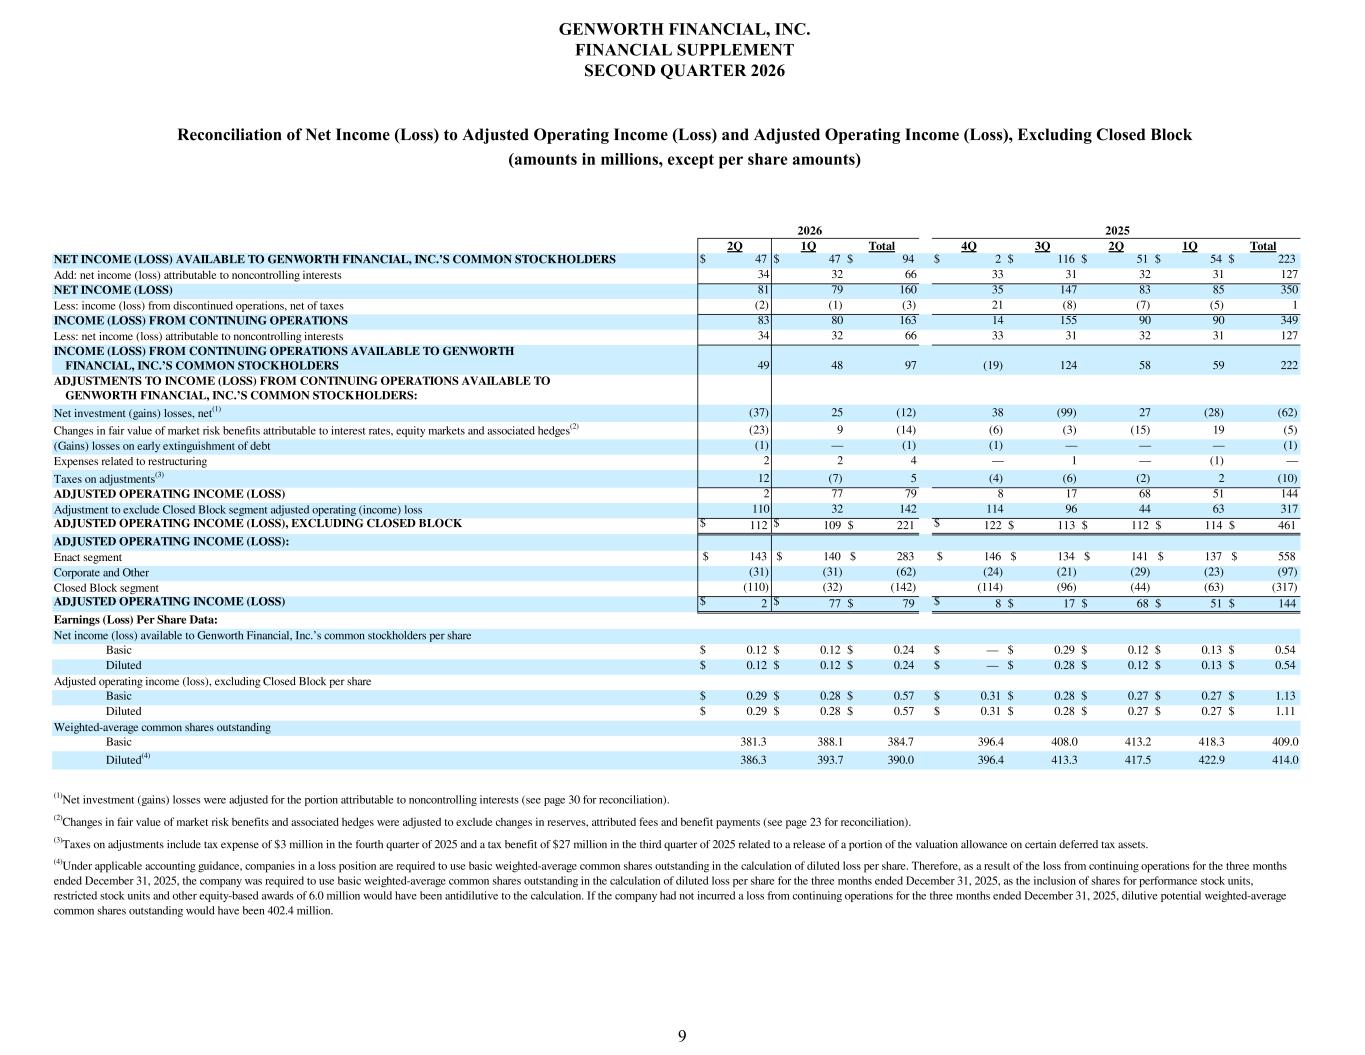
2Q 1Q Total 4Q 3Q 2Q 1Q Total $ 47 $ 47 $ 94 $ 2 $ 116 $ 51 $ 54 $ 223 34 32 66 33 31 32 31 127 81 79 160 35 147 83 85 350 (2) (1) (3) 21 (8) (7) (5) 1 83 80 163 14 155 90 90 349 34 32 66 33 31 32 31 127 49 48 97 (19) 124 58 59 222 (37) 25 (12) 38 (99) 27 (28) (62) (23) 9 (14) (6) (3) (15) 19 (5) (1) — (1) (1) — — — (1) 2 2 4 — 1 — (1) — 12 (7) 5 (4) (6) (2) 2 (10) 2 77 79 8 17 68 51 144 110 32 142 114 96 44 63 317 $ 112 $ 109 $ 221 $ 122 $ 113 $ 112 $ 114 $ 461 $ 143 $ 140 $ 283 $ 146 $ 134 $ 141 $ 137 $ 558 (31) (31) (62) (24) (21) (29) (23) (97) (110) (32) (142) (114) (96) (44) (63) (317) $ 2 $ 77 $ 79 $ 8 $ 17 $ 68 $ 51 $ 144 Basic $ 0.12 $ 0.12 $ 0.24 $ — $ 0.29 $ 0.12 $ 0.13 $ 0.54 Diluted $ 0.12 $ 0.12 $ 0.24 $ — $ 0.28 $ 0.12 $ 0.13 $ 0.54 Basic $ 0.29 $ 0.28 $ 0.57 $ 0.31 $ 0.28 $ 0.27 $ 0.27 $ 1.13 Diluted $ 0.29 $ 0.28 $ 0.57 $ 0.31 $ 0.28 $ 0.27 $ 0.27 $ 1.11 Basic 381.3 388.1 384.7 396.4 408.0 413.2 418.3 409.0 Diluted (4) 386.3 393.7 390.0 396.4 413.3 417.5 422.9 414.0 (4) Under applicable accounting guidance, companies in a loss position are required to use basic weighted-average common shares outstanding in the calculation of diluted loss per share. Therefore, as a result of the loss from continuing operations for the three months ended December 31, 2025, the company was required to use basic weighted-average common shares outstanding in the calculation of diluted loss per share for the three months ended December 31, 2025, as the inclusion of shares for performance stock units, restricted stock units and other equity-based awards of 6.0 million would have been antidilutive to the calculation. If the company had not incurred a loss from continuing operations for the three months ended December 31, 2025, dilutive potential weighted-average common shares outstanding would have been 402.4 million. Weighted-average common shares outstanding (3) Taxes on adjustments include tax expense of $3 million in the fourth quarter of 2025 and a tax benefit of $27 million in the third quarter of 2025 related to a release of a portion of the valuation allowance on certain deferred tax assets. (2) Changes in fair value of market risk benefits and associated hedges were adjusted to exclude changes in reserves, attributed fees and benefit payments (see page 23 for reconciliation). (1) Net investment (gains) losses were adjusted for the portion attributable to noncontrolling interests (see page 30 for reconciliation). Adjusted operating income (loss), excluding Closed Block per share Enact segment Closed Block segment ADJUSTED OPERATING INCOME (LOSS) Net income (loss) available to Genworth Financial, Inc.’s common stockholders per share Earnings (Loss) Per Share Data: Corporate and Other Expenses related to restructuring Taxes on adjustments (3) ADJUSTED OPERATING INCOME (LOSS): ADJUSTED OPERATING INCOME (LOSS), EXCLUDING CLOSED BLOCK ADJUSTED OPERATING INCOME (LOSS) Adjustment to exclude Closed Block segment adjusted operating (income) loss INCOME (LOSS) FROM CONTINUING OPERATIONS AVAILABLE TO GENWORTH FINANCIAL, INC.’S COMMON STOCKHOLDERS Net investment (gains) losses, net (1) ADJUSTMENTS TO INCOME (LOSS) FROM CONTINUING OPERATIONS AVAILABLE TO GENWORTH FINANCIAL, INC.’S COMMON STOCKHOLDERS: (Gains) losses on early extinguishment of debt Changes in fair value of market risk benefits attributable to interest rates, equity markets and associated hedges (2) 2025 Less: net income (loss) attributable to noncontrolling interests INCOME (LOSS) FROM CONTINUING OPERATIONS NET INCOME (LOSS) AVAILABLE TO GENWORTH FINANCIAL, INC.’S COMMON STOCKHOLDERS Add: net income (loss) attributable to noncontrolling interests Less: income (loss) from discontinued operations, net of taxes NET INCOME (LOSS) 2026 GENWORTH FINANCIAL, INC. FINANCIAL SUPPLEMENT SECOND QUARTER 2026 Reconciliation of Net Income (Loss) to Adjusted Operating Income (Loss) and Adjusted Operating Income (Loss), Excluding Closed Block (amounts in millions, except per share amounts) 9
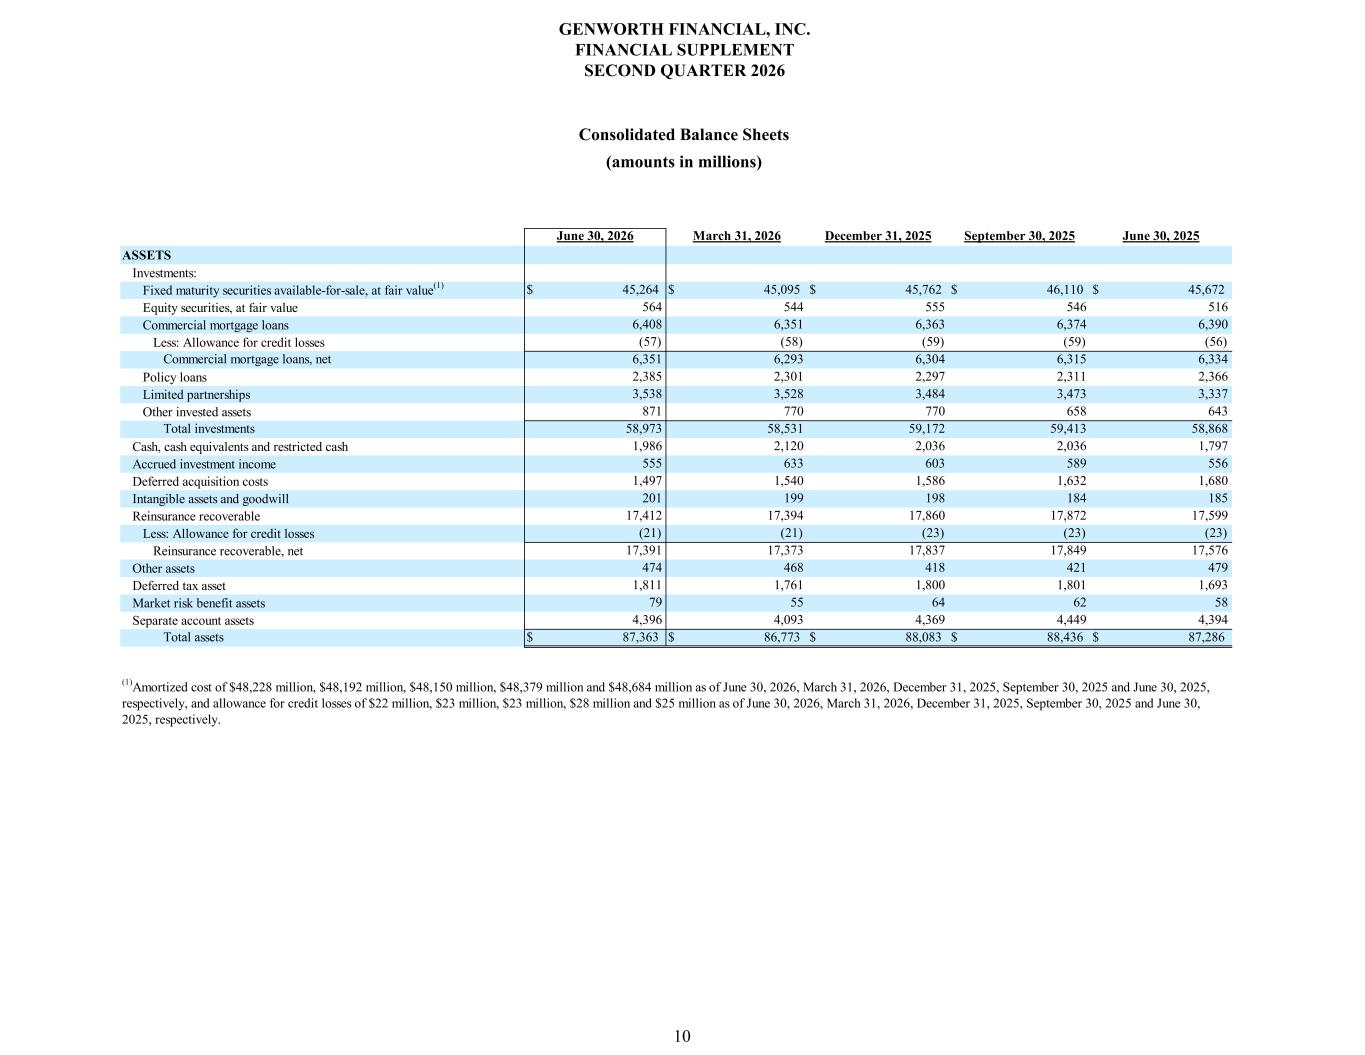
June 30, 2026 March 31, 2026 December 31, 2025 September 30, 2025 June 30, 2025 $ 45,264 $ 45,095 $ 45,762 $ 46,110 $ 45,672 564 544 555 546 516 6,408 6,351 6,363 6,374 6,390 (57) (58) (59) (59) (56) Commercial mortgage loans, net 6,351 6,293 6,304 6,315 6,334 2,385 2,301 2,297 2,311 2,366 3,538 3,528 3,484 3,473 3,337 871 770 770 658 643 Total investments 58,973 58,531 59,172 59,413 58,868 1,986 2,120 2,036 2,036 1,797 555 633 603 589 556 1,497 1,540 1,586 1,632 1,680 201 199 198 184 185 17,412 17,394 17,860 17,872 17,599 (21) (21) (23) (23) (23) 17,391 17,373 17,837 17,849 17,576 474 468 418 421 479 1,811 1,761 1,800 1,801 1,693 79 55 64 62 58 4,396 4,093 4,369 4,449 4,394 Total assets $ 87,363 $ 86,773 $ 88,083 $ 88,436 $ 87,286 Market risk benefit assets Deferred tax asset Reinsurance recoverable, net Other assets Separate account assets (1)Amortized cost of $48,228 million, $48,192 million, $48,150 million, $48,379 million and $48,684 million as of June 30, 2026, March 31, 2026, December 31, 2025, September 30, 2025 and June 30, 2025, respectively, and allowance for credit losses of $22 million, $23 million, $23 million, $28 million and $25 million as of June 30, 2026, March 31, 2026, December 31, 2025, September 30, 2025 and June 30, 2025, respectively. Commercial mortgage loans Equity securities, at fair value Fixed maturity securities available-for-sale, at fair value(1) ASSETS Investments: Limited partnerships Policy loans Less: Allowance for credit losses Other invested assets Cash, cash equivalents and restricted cash Accrued investment income Reinsurance recoverable Intangible assets and goodwill Less: Allowance for credit losses Deferred acquisition costs 10 Consolidated Balance Sheets (amounts in millions) GENWORTH FINANCIAL, INC. FINANCIAL SUPPLEMENT SECOND QUARTER 2026
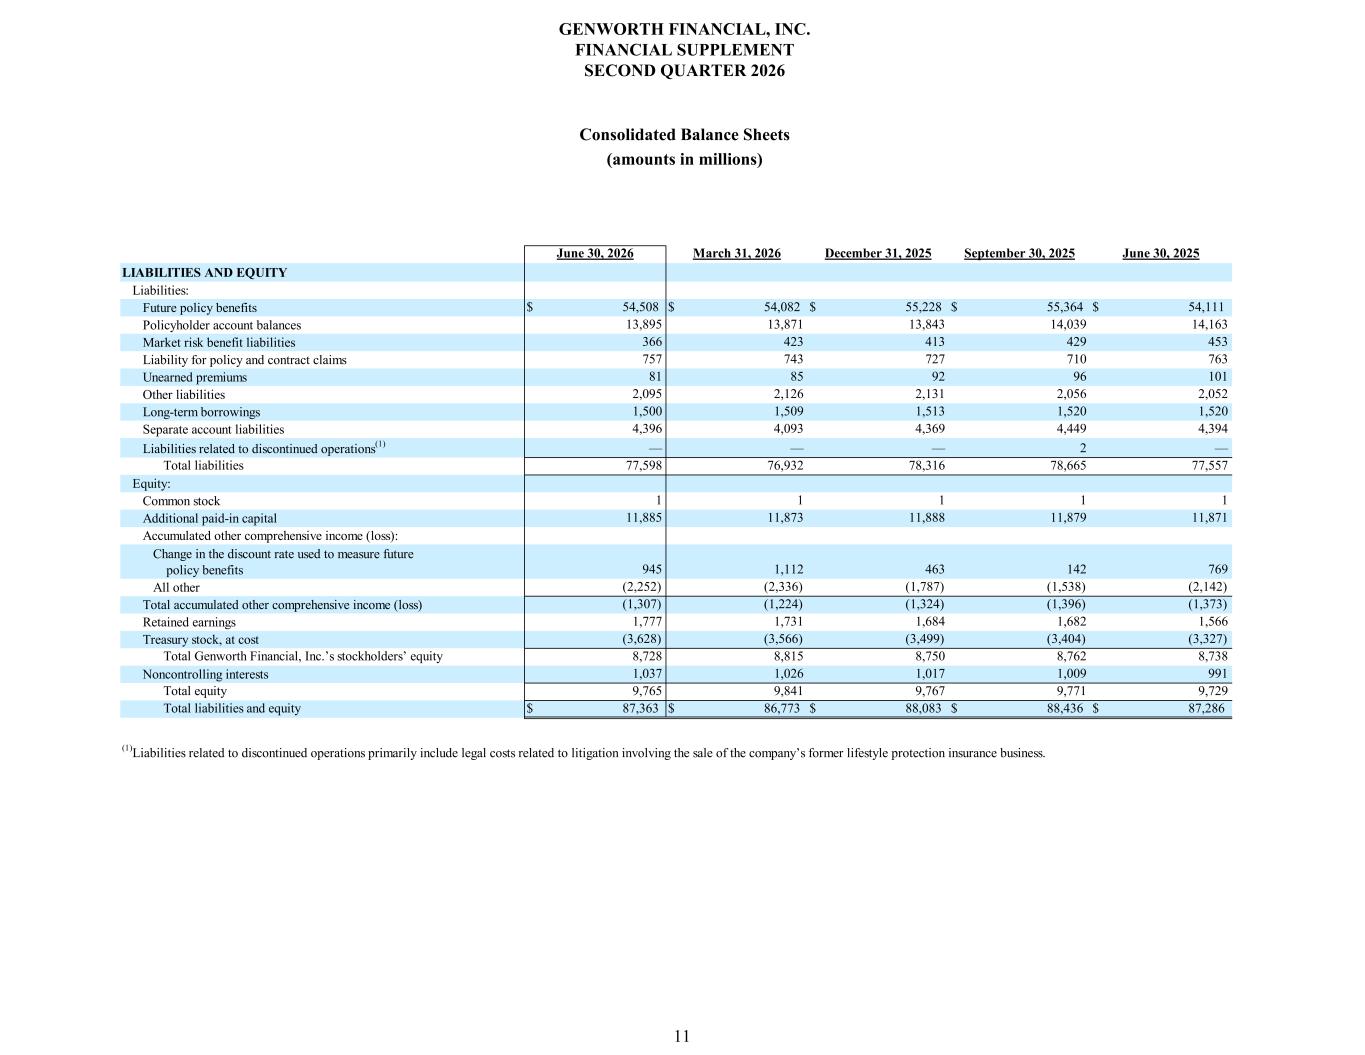
June 30, 2026 March 31, 2026 December 31, 2025 September 30, 2025 June 30, 2025 $ 54,508 $ 54,082 $ 55,228 $ 55,364 $ 54,111 13,895 13,871 13,843 14,039 14,163 366 423 413 429 453 757 743 727 710 763 81 85 92 96 101 2,095 2,126 2,131 2,056 2,052 1,500 1,509 1,513 1,520 1,520 4,396 4,093 4,369 4,449 4,394 — — — 2 — Total liabilities 77,598 76,932 78,316 78,665 77,557 1 1 1 1 1 11,885 11,873 11,888 11,879 11,871 945 1,112 463 142 769 (2,252) (2,336) (1,787) (1,538) (2,142) (1,307) (1,224) (1,324) (1,396) (1,373) 1,777 1,731 1,684 1,682 1,566 (3,628) (3,566) (3,499) (3,404) (3,327) Total Genworth Financial, Inc.’s stockholders’ equity 8,728 8,815 8,750 8,762 8,738 1,037 1,026 1,017 1,009 991 Total equity 9,765 9,841 9,767 9,771 9,729 Total liabilities and equity $ 87,363 $ 86,773 $ 88,083 $ 88,436 $ 87,286 Unearned premiums Other liabilities Long-term borrowings Separate account liabilities Equity: Common stock Liabilities related to discontinued operations(1) All other Change in the discount rate used to measure future policy benefits Accumulated other comprehensive income (loss): Additional paid-in capital Total accumulated other comprehensive income (loss) Retained earnings Treasury stock, at cost Noncontrolling interests (1)Liabilities related to discontinued operations primarily include legal costs related to litigation involving the sale of the company’s former lifestyle protection insurance business. Liabilities: Liability for policy and contract claims Market risk benefit liabilities Policyholder account balances Future policy benefits LIABILITIES AND EQUITY 11 Consolidated Balance Sheets (amounts in millions) GENWORTH FINANCIAL, INC. FINANCIAL SUPPLEMENT SECOND QUARTER 2026
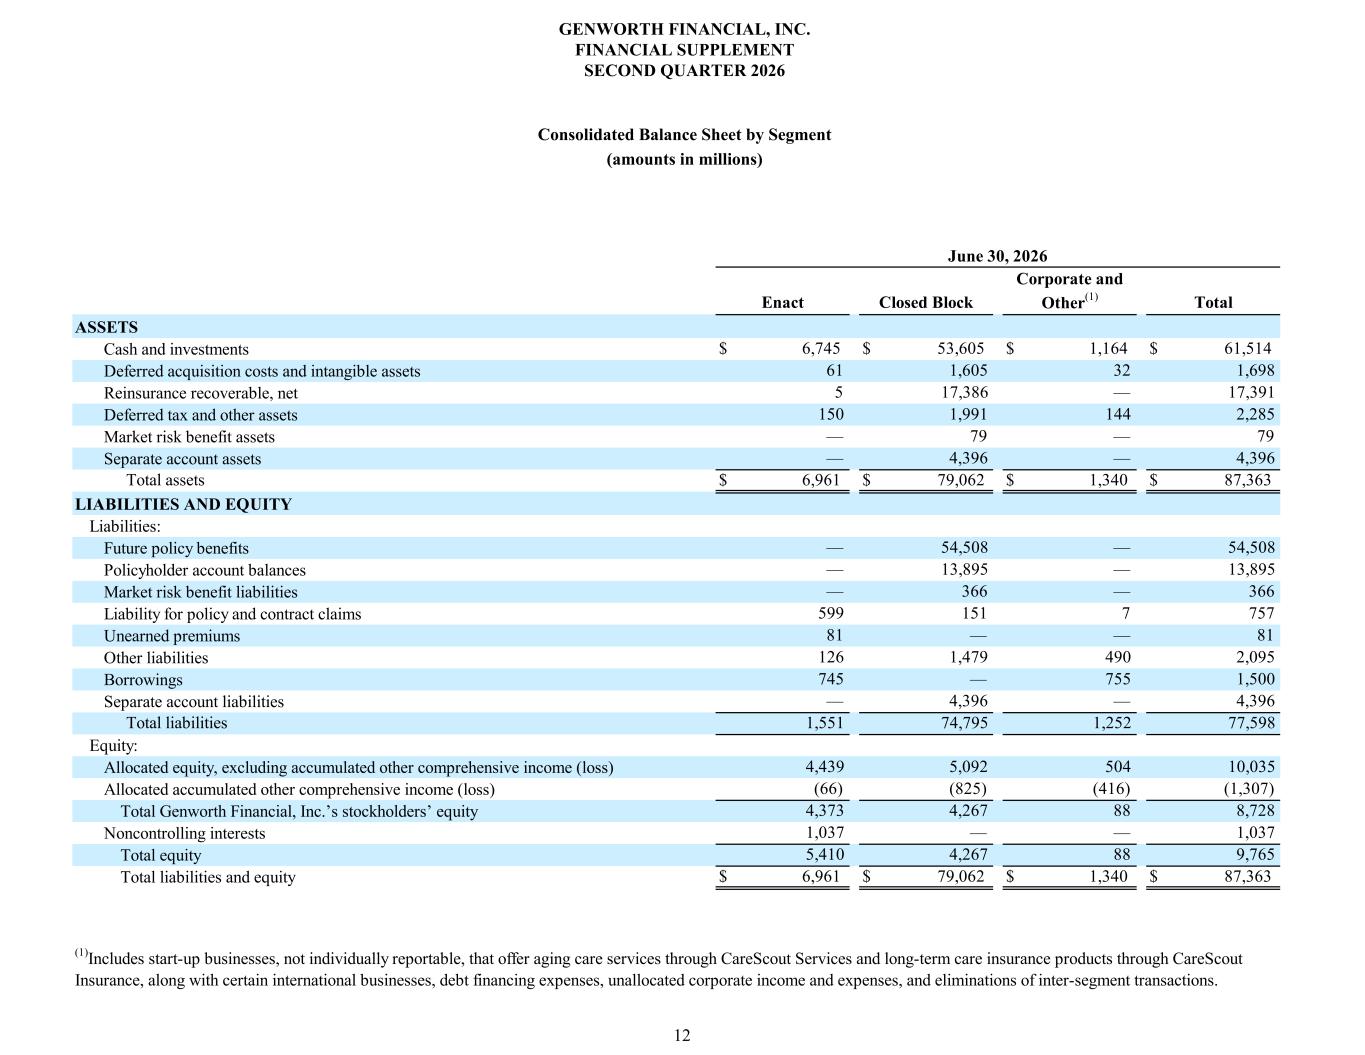
Enact Closed Block Corporate and Other(1) Total $ 6,745 $ 53,605 $ 1,164 $ 61,514 61 1,605 32 1,698 5 17,386 — 17,391 150 1,991 144 2,285 — 79 — 79 — 4,396 — 4,396 Total assets $ 6,961 $ 79,062 $ 1,340 $ 87,363 — 54,508 — 54,508 — 13,895 — 13,895 — 366 — 366 599 151 7 757 81 — — 81 126 1,479 490 2,095 745 — 755 1,500 — 4,396 — 4,396 Total liabilities 1,551 74,795 1,252 77,598 4,439 5,092 504 10,035 (66) (825) (416) (1,307) 4,373 4,267 88 8,728 1,037 — — 1,037 5,410 4,267 88 9,765 $ 6,961 $ 79,062 $ 1,340 $ 87,363 Total Genworth Financial, Inc.’s stockholders’ equity Total liabilities and equity Total equity Noncontrolling interests (1)Includes start-up businesses, not individually reportable, that offer aging care services through CareScout Services and long-term care insurance products through CareScout Insurance, along with certain international businesses, debt financing expenses, unallocated corporate income and expenses, and eliminations of inter-segment transactions. Borrowings Separate account liabilities Equity: Allocated equity, excluding accumulated other comprehensive income (loss) Allocated accumulated other comprehensive income (loss) Future policy benefits Policyholder account balances Unearned premiums Other liabilities Liability for policy and contract claims Market risk benefit liabilities Separate account assets Deferred tax and other assets Market risk benefit assets LIABILITIES AND EQUITY Liabilities: ASSETS Deferred acquisition costs and intangible assets Reinsurance recoverable, net Cash and investments June 30, 2026 12 Consolidated Balance Sheet by Segment (amounts in millions) GENWORTH FINANCIAL, INC. FINANCIAL SUPPLEMENT SECOND QUARTER 2026
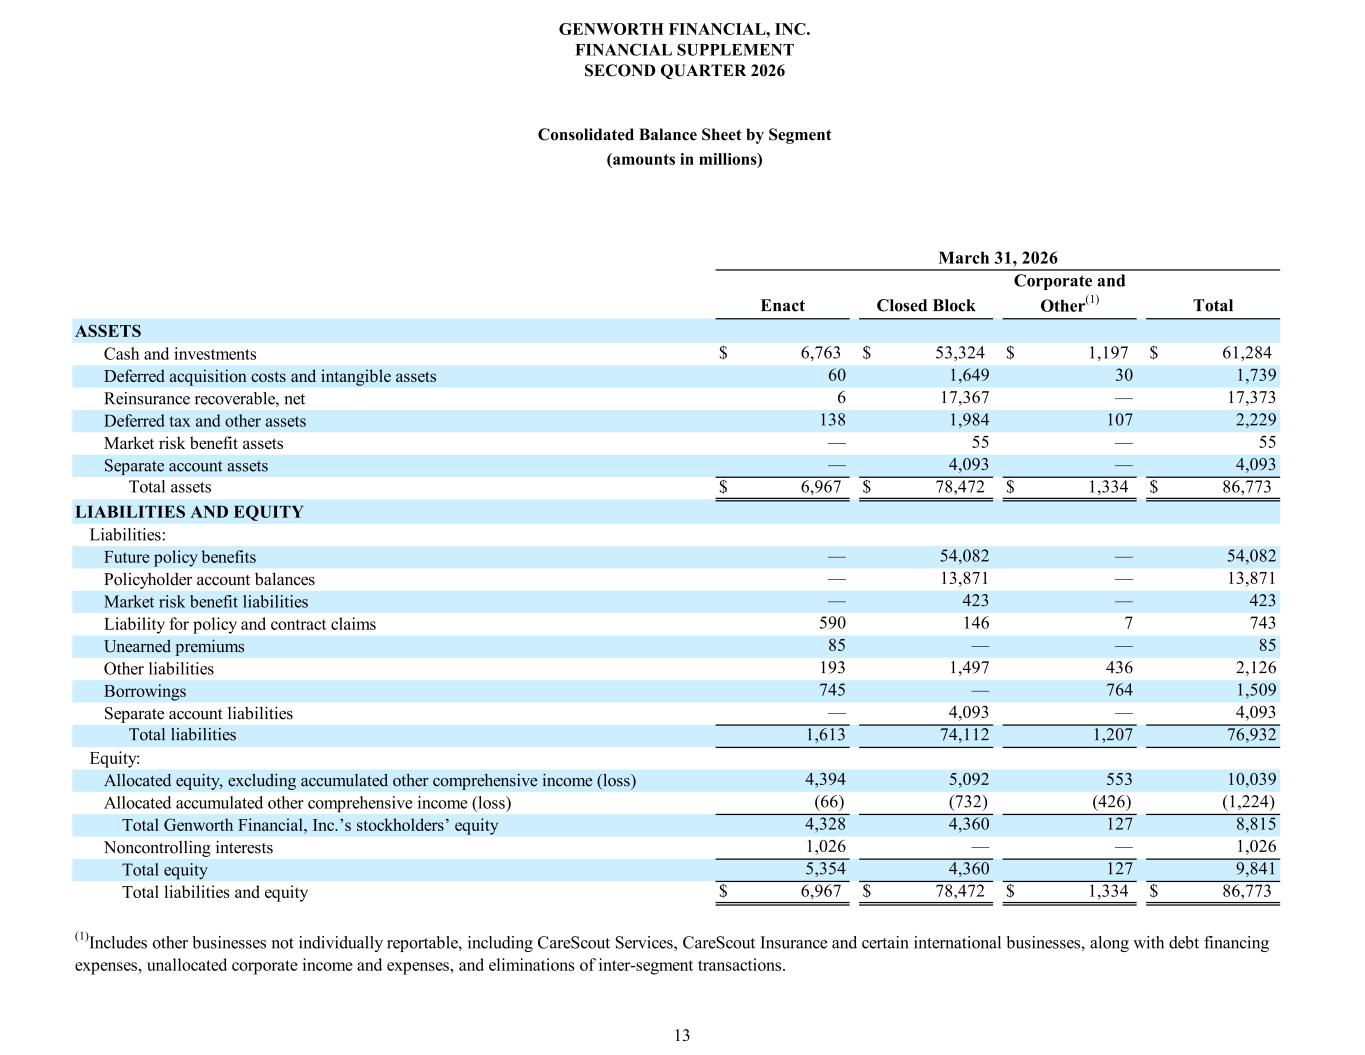
Enact Closed Block Corporate and Other(1) Total $ 6,763 $ 53,324 $ 1,197 $ 61,284 60 1,649 30 1,739 6 17,367 — 17,373 138 1,984 107 2,229 — 55 — 55 — 4,093 — 4,093 Total assets $ 6,967 $ 78,472 $ 1,334 $ 86,773 — 54,082 — 54,082 — 13,871 — 13,871 — 423 — 423 590 146 7 743 85 — — 85 193 1,497 436 2,126 745 — 764 1,509 — 4,093 — 4,093 Total liabilities 1,613 74,112 1,207 76,932 4,394 5,092 553 10,039 (66) (732) (426) (1,224) 4,328 4,360 127 8,815 1,026 — — 1,026 5,354 4,360 127 9,841 $ 6,967 $ 78,472 $ 1,334 $ 86,773 Total Genworth Financial, Inc.’s stockholders’ equity Total liabilities and equity Total equity Noncontrolling interests (1)Includes other businesses not individually reportable, including CareScout Services, CareScout Insurance and certain international businesses, along with debt financing expenses, unallocated corporate income and expenses, and eliminations of inter-segment transactions. Borrowings Separate account liabilities Equity: Allocated equity, excluding accumulated other comprehensive income (loss) Allocated accumulated other comprehensive income (loss) Future policy benefits Policyholder account balances Unearned premiums Other liabilities Liability for policy and contract claims Market risk benefit liabilities Separate account assets Deferred tax and other assets Market risk benefit assets LIABILITIES AND EQUITY Liabilities: ASSETS Deferred acquisition costs and intangible assets Reinsurance recoverable, net Cash and investments March 31, 2026 13 Consolidated Balance Sheet by Segment (amounts in millions) GENWORTH FINANCIAL, INC. FINANCIAL SUPPLEMENT SECOND QUARTER 2026

Enact Segment
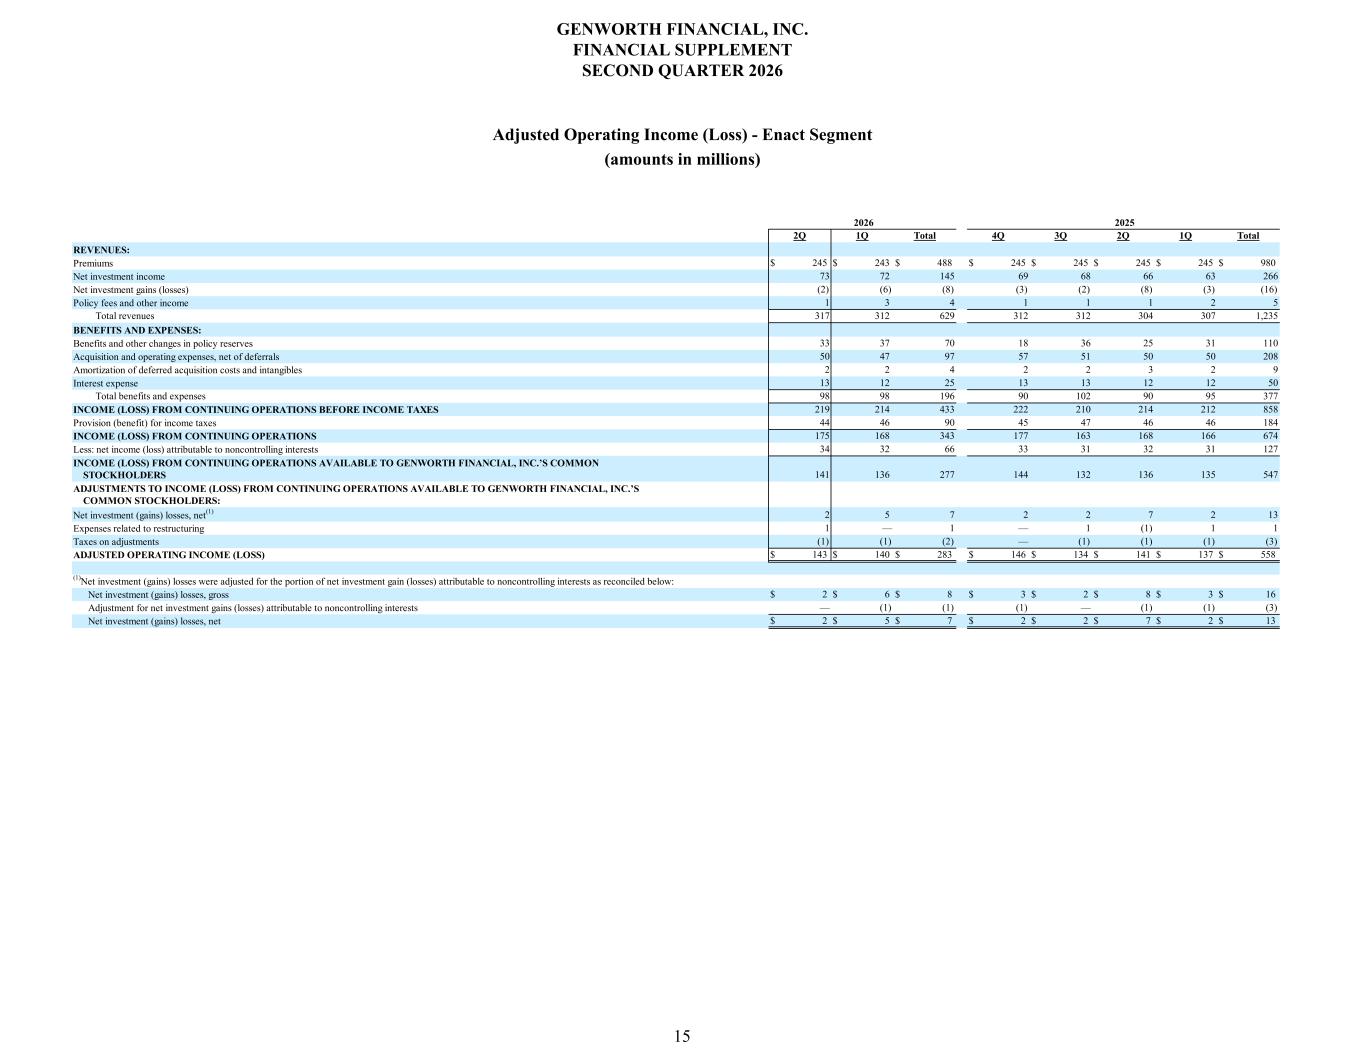
2Q 1Q Total 4Q 3Q 2Q 1Q Total $ 245 $ 243 $ 488 $ 245 $ 245 $ 245 $ 245 $ 980 73 72 145 69 68 66 63 266 (2) (6) (8) (3) (2) (8) (3) (16) 1 3 4 1 1 1 2 5 Total revenues 317 312 629 312 312 304 307 1,235 33 37 70 18 36 25 31 110 50 47 97 57 51 50 50 208 2 2 4 2 2 3 2 9 13 12 25 13 13 12 12 50 Total benefits and expenses 98 98 196 90 102 90 95 377 219 214 433 222 210 214 212 858 44 46 90 45 47 46 46 184 175 168 343 177 163 168 166 674 34 32 66 33 31 32 31 127 141 136 277 144 132 136 135 547 2 5 7 2 2 7 2 13 1 — 1 — 1 (1) 1 1 (1) (1) (2) — (1) (1) (1) (3) $ 143 $ 140 $ 283 $ 146 $ 134 $ 141 $ 137 $ 558 $ 2 $ 6 $ 8 $ 3 $ 2 $ 8 $ 3 $ 16 — (1) (1) (1) — (1) (1) (3) $ 2 $ 5 $ 7 $ 2 $ 2 $ 7 $ 2 $ 13 Net investment (gains) losses, net Adjustment for net investment gains (losses) attributable to noncontrolling interests Net investment (gains) losses, net(1) Taxes on adjustments Expenses related to restructuring ADJUSTED OPERATING INCOME (LOSS) Net investment (gains) losses, gross (1)Net investment (gains) losses were adjusted for the portion of net investment gain (losses) attributable to noncontrolling interests as reconciled below: Provision (benefit) for income taxes Less: net income (loss) attributable to noncontrolling interests INCOME (LOSS) FROM CONTINUING OPERATIONS INCOME (LOSS) FROM CONTINUING OPERATIONS AVAILABLE TO GENWORTH FINANCIAL, INC.’S COMMON STOCKHOLDERS ADJUSTMENTS TO INCOME (LOSS) FROM CONTINUING OPERATIONS AVAILABLE TO GENWORTH FINANCIAL, INC.’S COMMON STOCKHOLDERS: Benefits and other changes in policy reserves Amortization of deferred acquisition costs and intangibles Acquisition and operating expenses, net of deferrals Interest expense INCOME (LOSS) FROM CONTINUING OPERATIONS BEFORE INCOME TAXES 2026 2025 Policy fees and other income BENEFITS AND EXPENSES: REVENUES: Premiums Net investment gains (losses) Net investment income 15 Adjusted Operating Income (Loss) - Enact Segment (amounts in millions) GENWORTH FINANCIAL, INC. FINANCIAL SUPPLEMENT SECOND QUARTER 2026
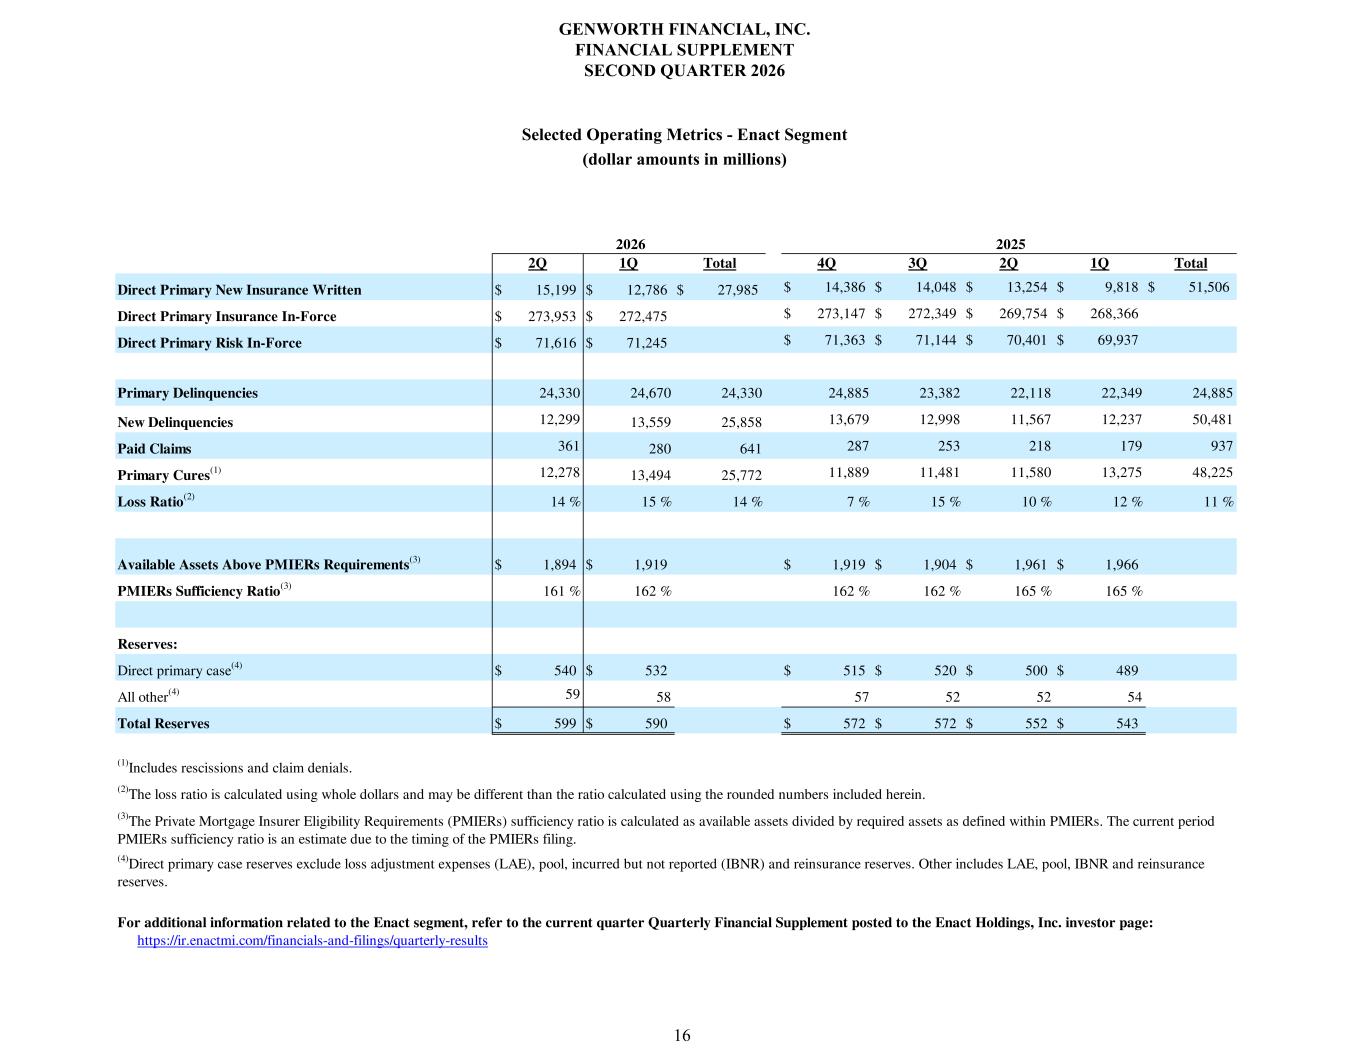
2Q 1Q Total 4Q 3Q 2Q 1Q Total Direct Primary New Insurance Written $ 15,199 $ 12,786 $ 27,985 $ 14,386 $ 14,048 $ 13,254 $ 9,818 $ 51,506 Direct Primary Insurance In-Force $ 273,953 $ 272,475 $ 273,147 $ 272,349 $ 269,754 $ 268,366 Direct Primary Risk In-Force $ 71,616 $ 71,245 $ 71,363 $ 71,144 $ 70,401 $ 69,937 Primary Delinquencies 24,330 24,670 24,330 24,885 23,382 22,118 22,349 24,885 New Delinquencies 12,299 13,559 25,858 13,679 12,998 11,567 12,237 50,481 Paid Claims 361 280 641 287 253 218 179 937 Primary Cures (1) 12,278 13,494 25,772 11,889 11,481 11,580 13,275 48,225 Loss Ratio (2) 14 % 15 % 14 % 7 % 15 % 10 % 12 % 11 % Available Assets Above PMIERs Requirements (3) $ 1,894 $ 1,919 $ 1,919 $ 1,904 $ 1,961 $ 1,966 PMIERs Sufficiency Ratio (3) 161 % 162 % 162 % 162 % 165 % 165 % Reserves: Direct primary case (4) $ 540 $ 532 $ 515 $ 520 $ 500 $ 489 All other (4) 59 58 57 52 52 54 Total Reserves $ 599 $ 590 $ 572 $ 572 $ 552 $ 543 https://ir.enactmi.com/financials-and-filings/quarterly-results (3) The Private Mortgage Insurer Eligibility Requirements (PMIERs) sufficiency ratio is calculated as available assets divided by required assets as defined within PMIERs. The current period PMIERs sufficiency ratio is an estimate due to the timing of the PMIERs filing. (4) Direct primary case reserves exclude loss adjustment expenses (LAE), pool, incurred but not reported (IBNR) and reinsurance reserves. Other includes LAE, pool, IBNR and reinsurance reserves. (2) The loss ratio is calculated using whole dollars and may be different than the ratio calculated using the rounded numbers included herein. 2026 2025 For additional information related to the Enact segment, refer to the current quarter Quarterly Financial Supplement posted to the Enact Holdings, Inc. investor page: (1) Includes rescissions and claim denials. GENWORTH FINANCIAL, INC. FINANCIAL SUPPLEMENT SECOND QUARTER 2026 Selected Operating Metrics - Enact Segment (dollar amounts in millions) 16

Closed Block Segment
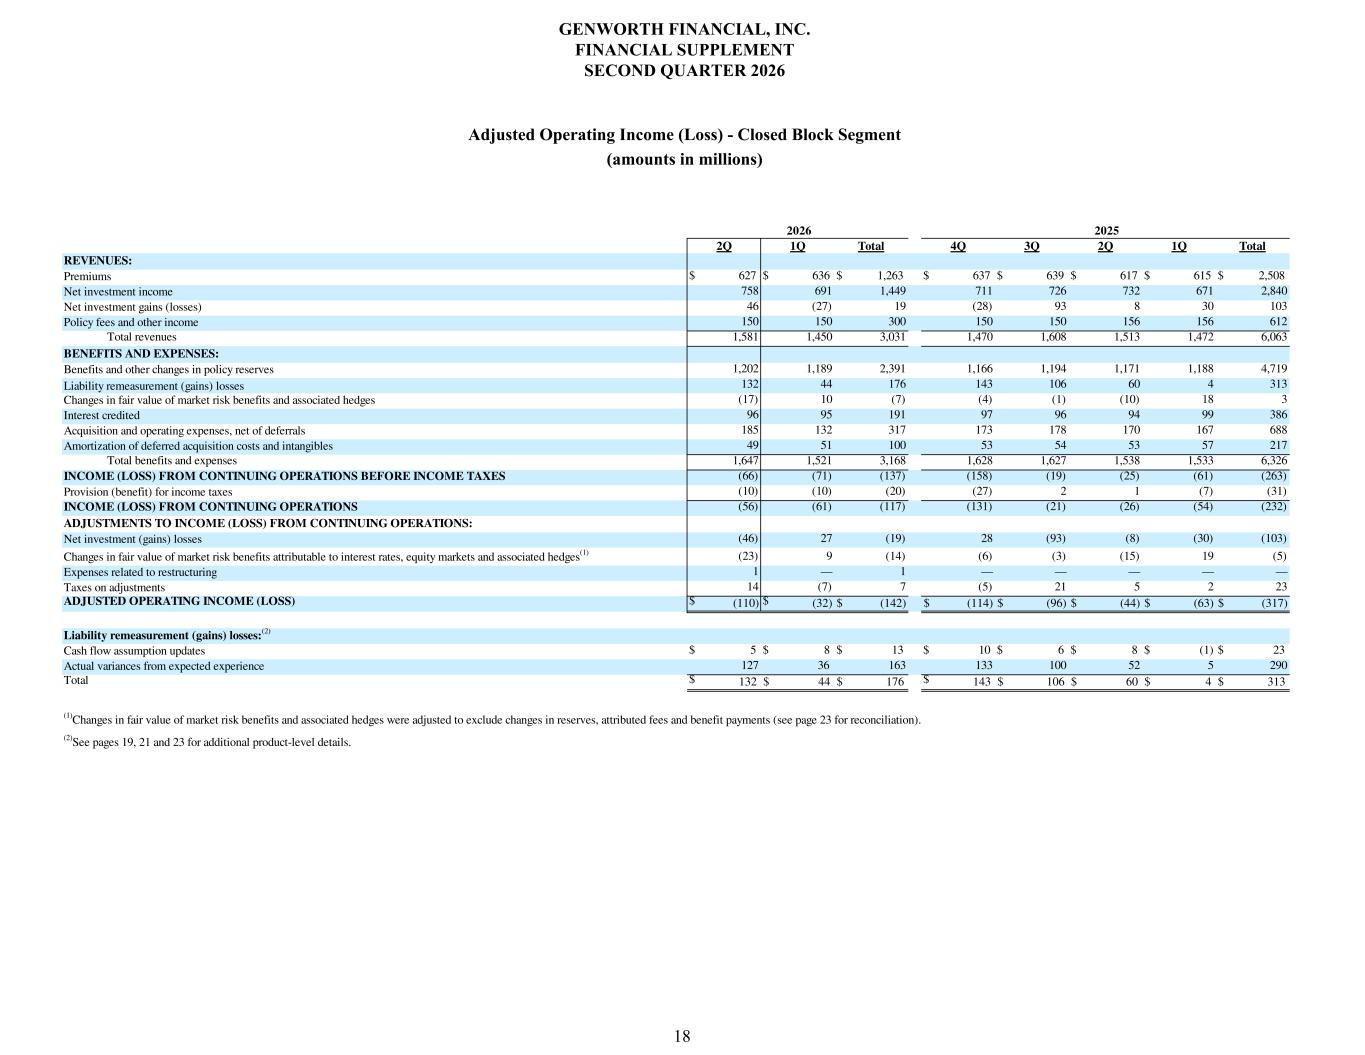
2Q 1Q Total 4Q 3Q 2Q 1Q Total $ 627 $ 636 $ 1,263 $ 637 $ 639 $ 617 $ 615 $ 2,508 758 691 1,449 711 726 732 671 2,840 46 (27) 19 (28) 93 8 30 103 150 150 300 150 150 156 156 612 Total revenues 1,581 1,450 3,031 1,470 1,608 1,513 1,472 6,063 1,202 1,189 2,391 1,166 1,194 1,171 1,188 4,719 132 44 176 143 106 60 4 313 (17) 10 (7) (4) (1) (10) 18 3 96 95 191 97 96 94 99 386 185 132 317 173 178 170 167 688 49 51 100 53 54 53 57 217 Total benefits and expenses 1,647 1,521 3,168 1,628 1,627 1,538 1,533 6,326 (66) (71) (137) (158) (19) (25) (61) (263) (10) (10) (20) (27) 2 1 (7) (31) (56) (61) (117) (131) (21) (26) (54) (232) (46) 27 (19) 28 (93) (8) (30) (103) (23) 9 (14) (6) (3) (15) 19 (5) 1 — 1 — — — — — 14 (7) 7 (5) 21 5 2 23 $ (110) $ (32) $ (142) $ (114) $ (96) $ (44) $ (63) $ (317) $ 5 $ 8 $ 13 $ 10 $ 6 $ 8 $ (1) $ 23 127 36 163 133 100 52 5 290 $ 132 $ 44 $ 176 $ 143 $ 106 $ 60 $ 4 $ 313 Liability remeasurement (gains) losses: (2) (2) See pages 19, 21 and 23 for additional product-level details. Cash flow assumption updates Total Actual variances from expected experience (1) Changes in fair value of market risk benefits and associated hedges were adjusted to exclude changes in reserves, attributed fees and benefit payments (see page 23 for reconciliation). Net investment (gains) losses Taxes on adjustments Expenses related to restructuring Changes in fair value of market risk benefits attributable to interest rates, equity markets and associated hedges (1) ADJUSTED OPERATING INCOME (LOSS) Amortization of deferred acquisition costs and intangibles Provision (benefit) for income taxes INCOME (LOSS) FROM CONTINUING OPERATIONS BEFORE INCOME TAXES ADJUSTMENTS TO INCOME (LOSS) FROM CONTINUING OPERATIONS: INCOME (LOSS) FROM CONTINUING OPERATIONS Benefits and other changes in policy reserves Changes in fair value of market risk benefits and associated hedges Liability remeasurement (gains) losses Acquisition and operating expenses, net of deferrals Interest credited 2025 Policy fees and other income BENEFITS AND EXPENSES: REVENUES: Premiums Net investment gains (losses) Net investment income 2026 GENWORTH FINANCIAL, INC. FINANCIAL SUPPLEMENT SECOND QUARTER 2026 Adjusted Operating Income (Loss) - Closed Block Segment (amounts in millions) 18
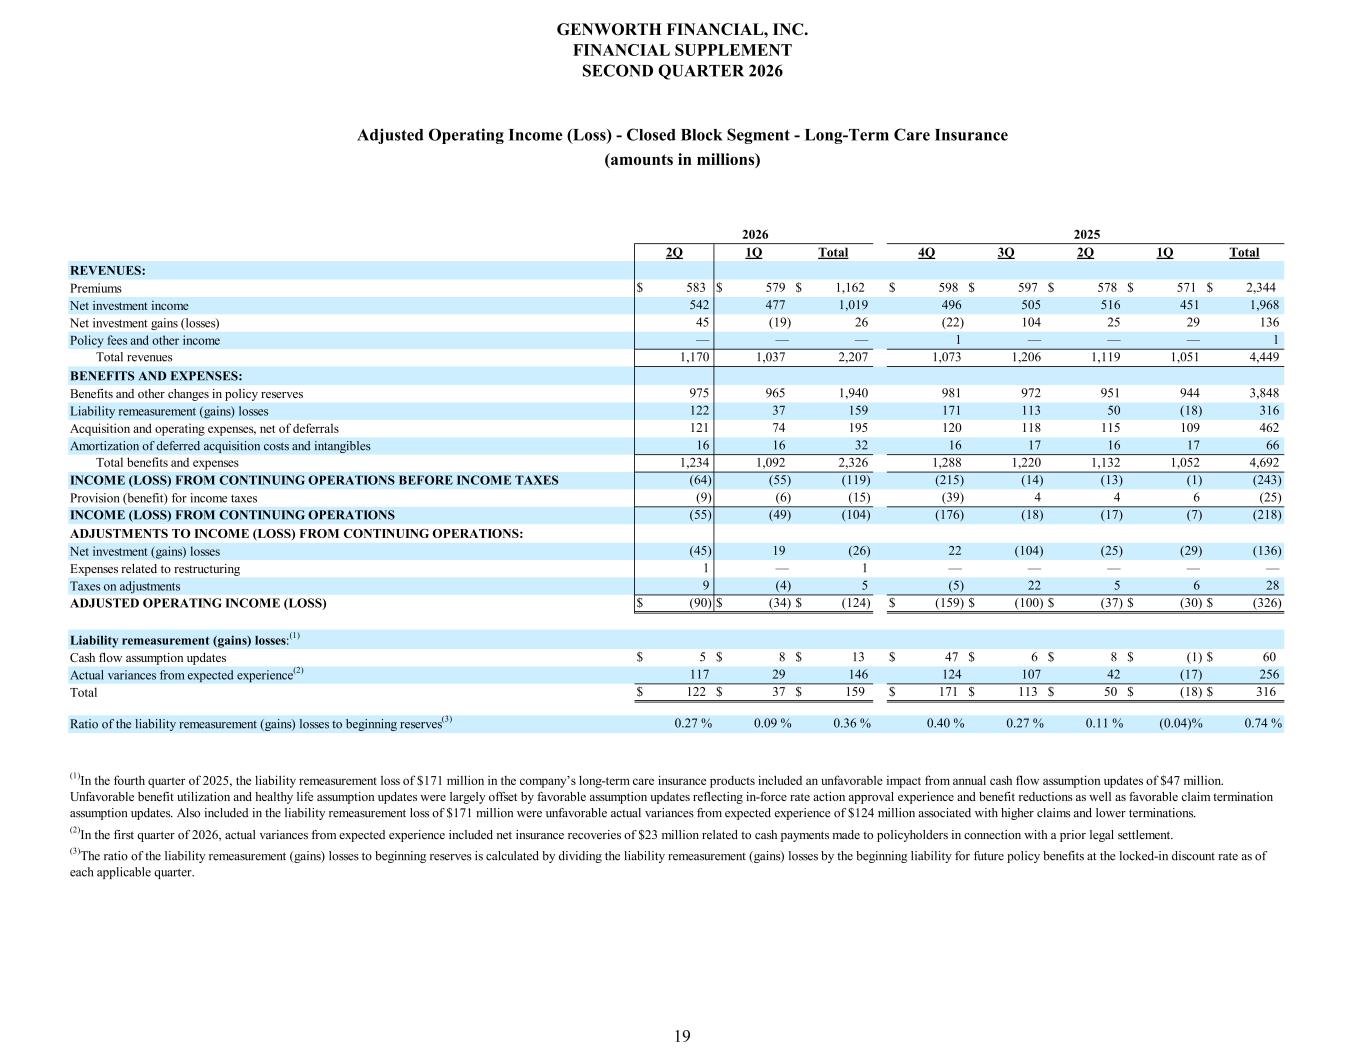
2Q 1Q Total 4Q 3Q 2Q 1Q Total $ 583 $ 579 $ 1,162 $ 598 $ 597 $ 578 $ 571 $ 2,344 542 477 1,019 496 505 516 451 1,968 45 (19) 26 (22) 104 25 29 136 — — — 1 — — — 1 Total revenues 1,170 1,037 2,207 1,073 1,206 1,119 1,051 4,449 975 965 1,940 981 972 951 944 3,848 122 37 159 171 113 50 (18) 316 121 74 195 120 118 115 109 462 16 16 32 16 17 16 17 66 Total benefits and expenses 1,234 1,092 2,326 1,288 1,220 1,132 1,052 4,692 (64) (55) (119) (215) (14) (13) (1) (243) (9) (6) (15) (39) 4 4 6 (25) (55) (49) (104) (176) (18) (17) (7) (218) (45) 19 (26) 22 (104) (25) (29) (136) 1 — 1 — — — — — 9 (4) 5 (5) 22 5 6 28 $ (90) $ (34) $ (124) $ (159) $ (100) $ (37) $ (30) $ (326) $ 5 $ 8 $ 13 $ 47 $ 6 $ 8 $ (1) $ 60 117 29 146 124 107 42 (17) 256 $ 122 $ 37 $ 159 $ 171 $ 113 $ 50 $ (18) $ 316 0.27 % 0.09 % 0.36 % 0.40 % 0.27 % 0.11 % (0.04)% 0.74 %Ratio of the liability remeasurement (gains) losses to beginning reserves(3) (1)In the fourth quarter of 2025, the liability remeasurement loss of $171 million in the company’s long-term care insurance products included an unfavorable impact from annual cash flow assumption updates of $47 million. Unfavorable benefit utilization and healthy life assumption updates were largely offset by favorable assumption updates reflecting in-force rate action approval experience and benefit reductions as well as favorable claim termination assumption updates. Also included in the liability remeasurement loss of $171 million were unfavorable actual variances from expected experience of $124 million associated with higher claims and lower terminations. (3)The ratio of the liability remeasurement (gains) losses to beginning reserves is calculated by dividing the liability remeasurement (gains) losses by the beginning liability for future policy benefits at the locked-in discount rate as of each applicable quarter. (2)In the first quarter of 2026, actual variances from expected experience included net insurance recoveries of $23 million related to cash payments made to policyholders in connection with a prior legal settlement. ADJUSTED OPERATING INCOME (LOSS) Expenses related to restructuring Cash flow assumption updates Liability remeasurement (gains) losses:(1) Total Actual variances from expected experience(2) Provision (benefit) for income taxes INCOME (LOSS) FROM CONTINUING OPERATIONS Net investment (gains) losses ADJUSTMENTS TO INCOME (LOSS) FROM CONTINUING OPERATIONS: Taxes on adjustments Benefits and other changes in policy reserves Liability remeasurement (gains) losses Amortization of deferred acquisition costs and intangibles Acquisition and operating expenses, net of deferrals INCOME (LOSS) FROM CONTINUING OPERATIONS BEFORE INCOME TAXES 2025 BENEFITS AND EXPENSES: Policy fees and other income REVENUES: Premiums Net investment gains (losses) Net investment income 2026 19 GENWORTH FINANCIAL, INC. FINANCIAL SUPPLEMENT SECOND QUARTER 2026 Adjusted Operating Income (Loss) - Closed Block Segment - Long-Term Care Insurance (amounts in millions)
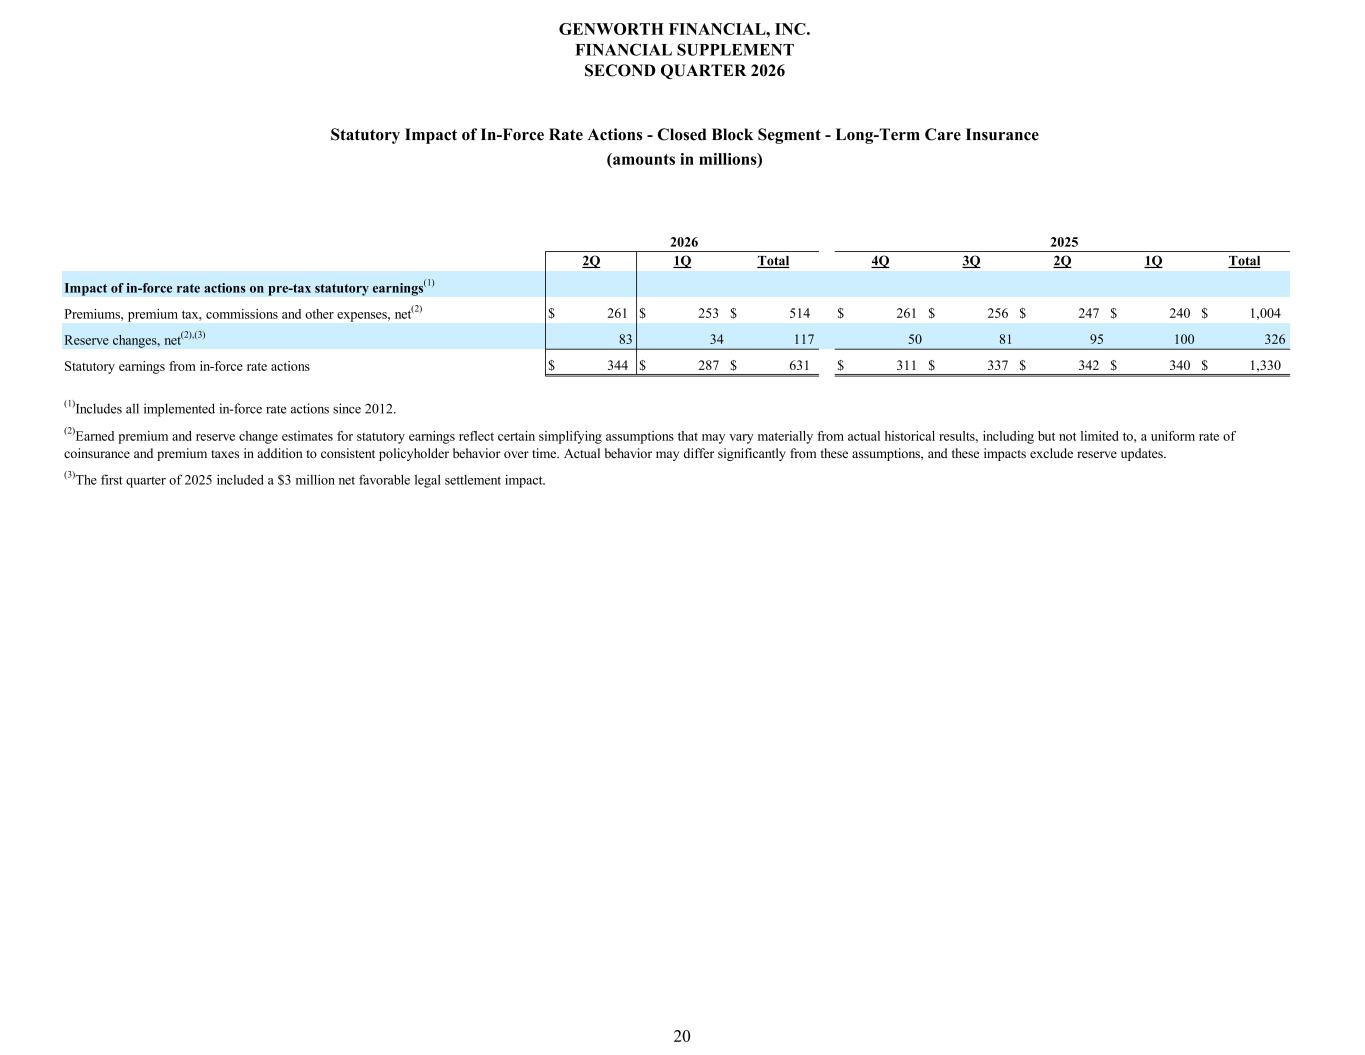
2Q 1Q Total 4Q 3Q 2Q 1Q Total $ 261 $ 253 $ 514 $ 261 $ 256 $ 247 $ 240 $ 1,004 83 34 117 50 81 95 100 326 $ 344 $ 287 $ 631 $ 311 $ 337 $ 342 $ 340 $ 1,330 2025 (1)Includes all implemented in-force rate actions since 2012. (3)The first quarter of 2025 included a $3 million net favorable legal settlement impact. (2)Earned premium and reserve change estimates for statutory earnings reflect certain simplifying assumptions that may vary materially from actual historical results, including but not limited to, a uniform rate of coinsurance and premium taxes in addition to consistent policyholder behavior over time. Actual behavior may differ significantly from these assumptions, and these impacts exclude reserve updates. Statutory earnings from in-force rate actions Impact of in-force rate actions on pre-tax statutory earnings(1) Premiums, premium tax, commissions and other expenses, net(2) Reserve changes, net(2),(3) 2026 20 Statutory Impact of In-Force Rate Actions - Closed Block Segment - Long-Term Care Insurance (amounts in millions) GENWORTH FINANCIAL, INC. FINANCIAL SUPPLEMENT SECOND QUARTER 2026
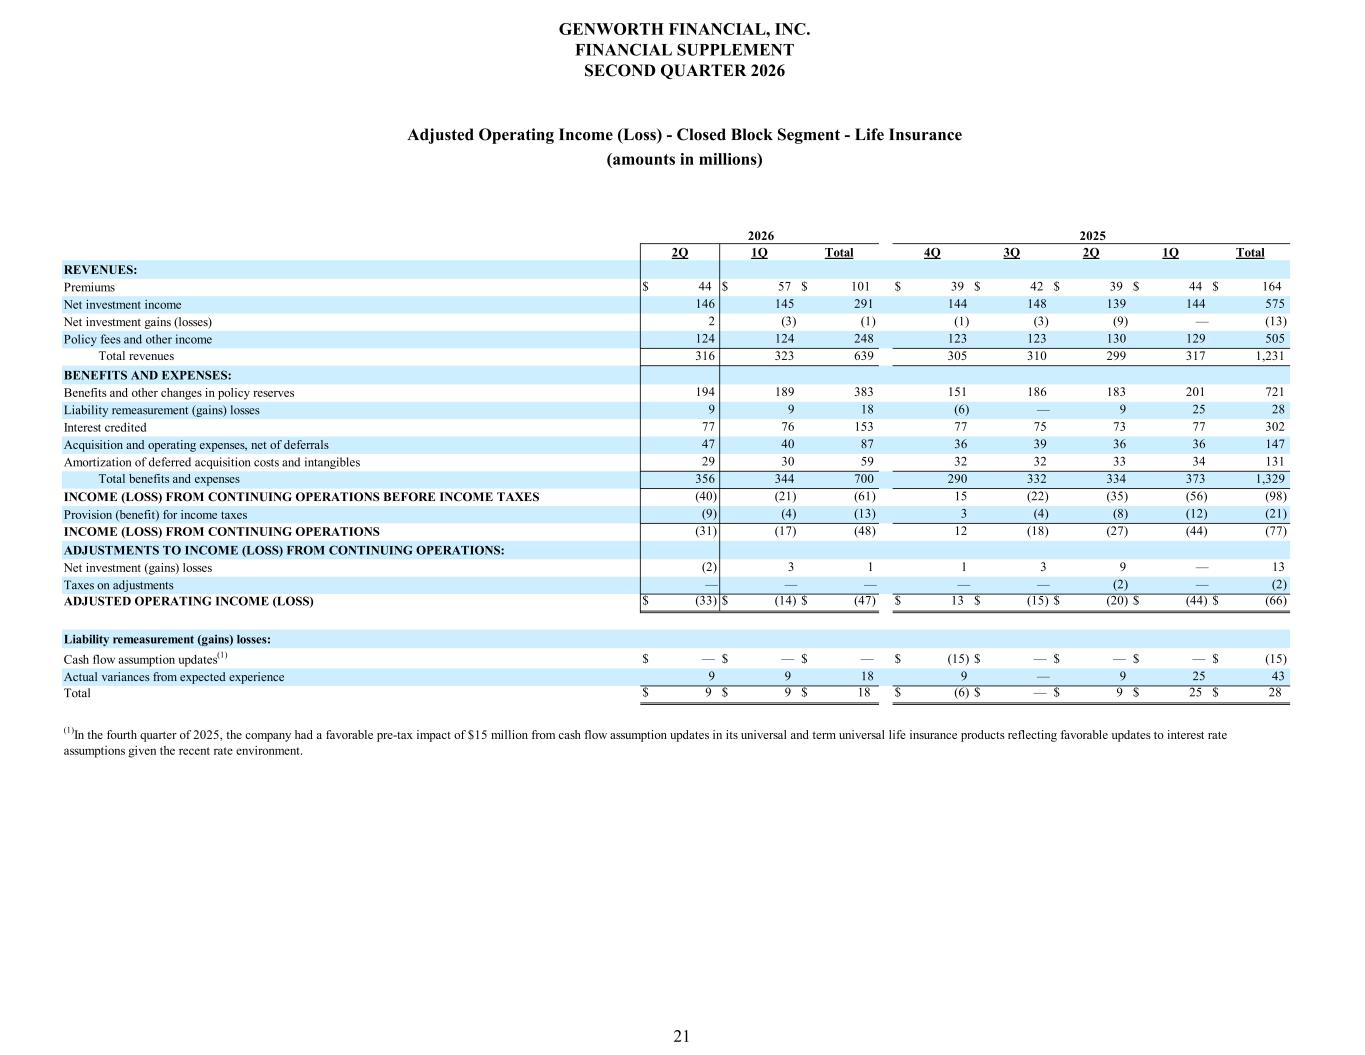
2Q 1Q Total 4Q 3Q 2Q 1Q Total $ 44 $ 57 $ 101 $ 39 $ 42 $ 39 $ 44 $ 164 146 145 291 144 148 139 144 575 2 (3) (1) (1) (3) (9) — (13) 124 124 248 123 123 130 129 505 Total revenues 316 323 639 305 310 299 317 1,231 194 189 383 151 186 183 201 721 9 9 18 (6) — 9 25 28 77 76 153 77 75 73 77 302 47 40 87 36 39 36 36 147 29 30 59 32 32 33 34 131 Total benefits and expenses 356 344 700 290 332 334 373 1,329 (40) (21) (61) 15 (22) (35) (56) (98) (9) (4) (13) 3 (4) (8) (12) (21) (31) (17) (48) 12 (18) (27) (44) (77) (2) 3 1 1 3 9 — 13 — — — — — (2) — (2) $ (33) $ (14) $ (47) $ 13 $ (15) $ (20) $ (44) $ (66) $ — $ — $ — $ (15) $ — $ — $ — $ (15) 9 9 18 9 — 9 25 43 $ 9 $ 9 $ 18 $ (6) $ — $ 9 $ 25 $ 28Total (1)In the fourth quarter of 2025, the company had a favorable pre-tax impact of $15 million from cash flow assumption updates in its universal and term universal life insurance products reflecting favorable updates to interest rate assumptions given the recent rate environment. Taxes on adjustments ADJUSTED OPERATING INCOME (LOSS) Liability remeasurement (gains) losses: Actual variances from expected experience Cash flow assumption updates(1) INCOME (LOSS) FROM CONTINUING OPERATIONS BEFORE INCOME TAXES INCOME (LOSS) FROM CONTINUING OPERATIONS Provision (benefit) for income taxes Net investment (gains) losses ADJUSTMENTS TO INCOME (LOSS) FROM CONTINUING OPERATIONS: Benefits and other changes in policy reserves Interest credited Liability remeasurement (gains) losses Amortization of deferred acquisition costs and intangibles Acquisition and operating expenses, net of deferrals 2025 Policy fees and other income BENEFITS AND EXPENSES: REVENUES: Premiums Net investment gains (losses) Net investment income 2026 21 Adjusted Operating Income (Loss) - Closed Block Segment - Life Insurance (amounts in millions) GENWORTH FINANCIAL, INC. FINANCIAL SUPPLEMENT SECOND QUARTER 2026
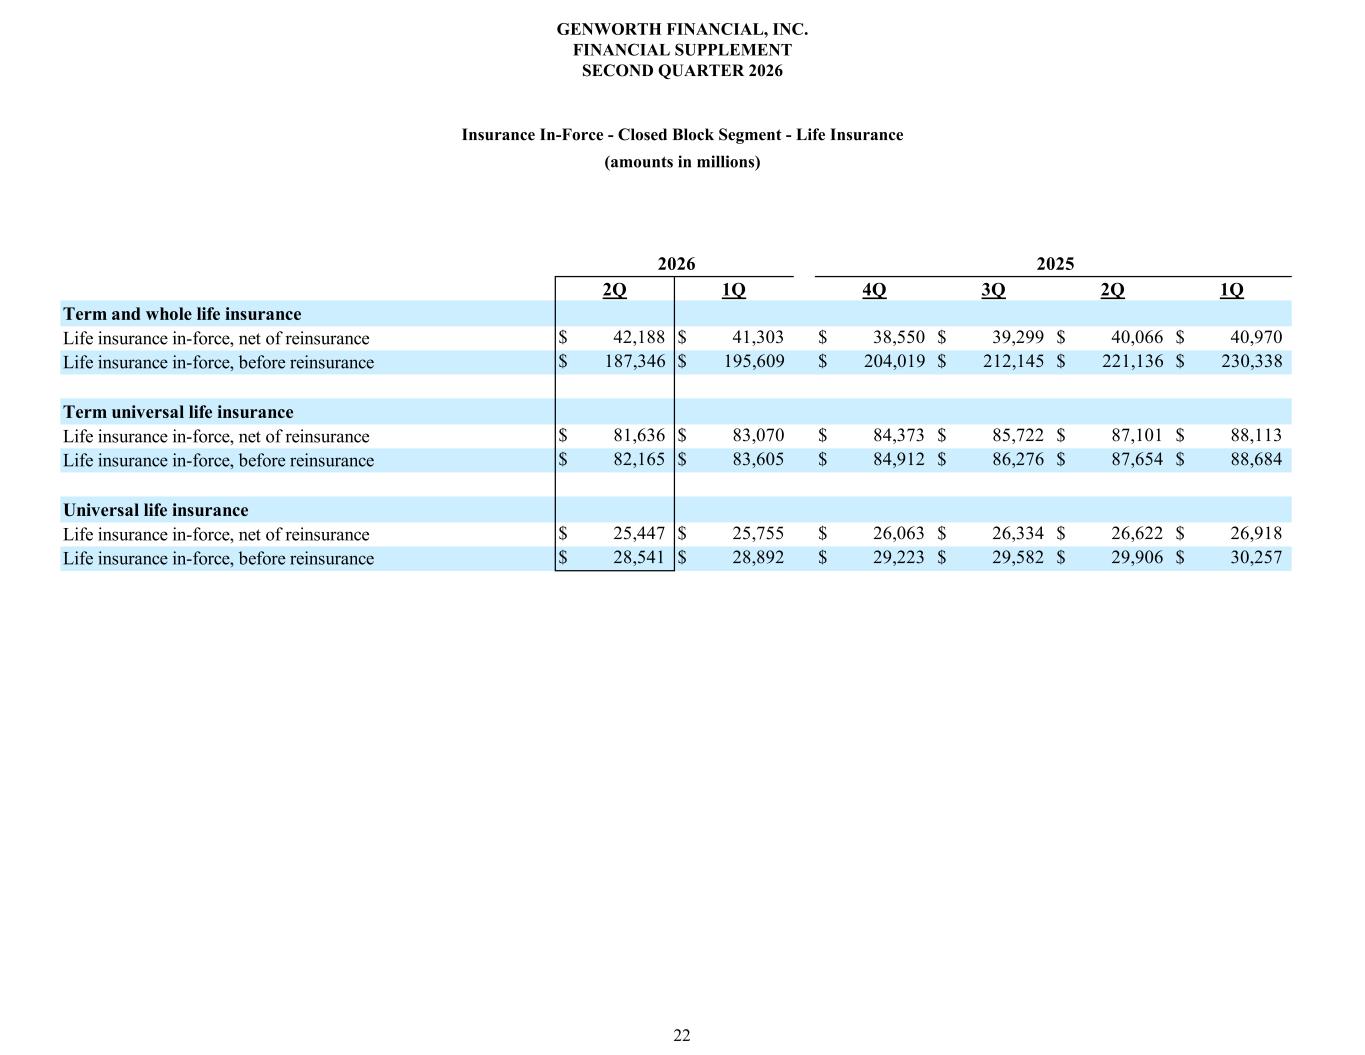
2Q 1Q 4Q 3Q 2Q 1Q $ 42,188 $ 41,303 $ 38,550 $ 39,299 $ 40,066 $ 40,970 $ 187,346 $ 195,609 $ 204,019 $ 212,145 $ 221,136 $ 230,338 $ 81,636 $ 83,070 $ 84,373 $ 85,722 $ 87,101 $ 88,113 $ 82,165 $ 83,605 $ 84,912 $ 86,276 $ 87,654 $ 88,684 $ 25,447 $ 25,755 $ 26,063 $ 26,334 $ 26,622 $ 26,918 $ 28,541 $ 28,892 $ 29,223 $ 29,582 $ 29,906 $ 30,257 Life insurance in-force, before reinsurance Term universal life insurance Life insurance in-force, net of reinsurance Life insurance in-force, before reinsurance Universal life insurance Life insurance in-force, net of reinsurance Term and whole life insurance Life insurance in-force, net of reinsurance Life insurance in-force, before reinsurance 2026 2025 22 Insurance In-Force - Closed Block Segment - Life Insurance (amounts in millions) GENWORTH FINANCIAL, INC. FINANCIAL SUPPLEMENT SECOND QUARTER 2026
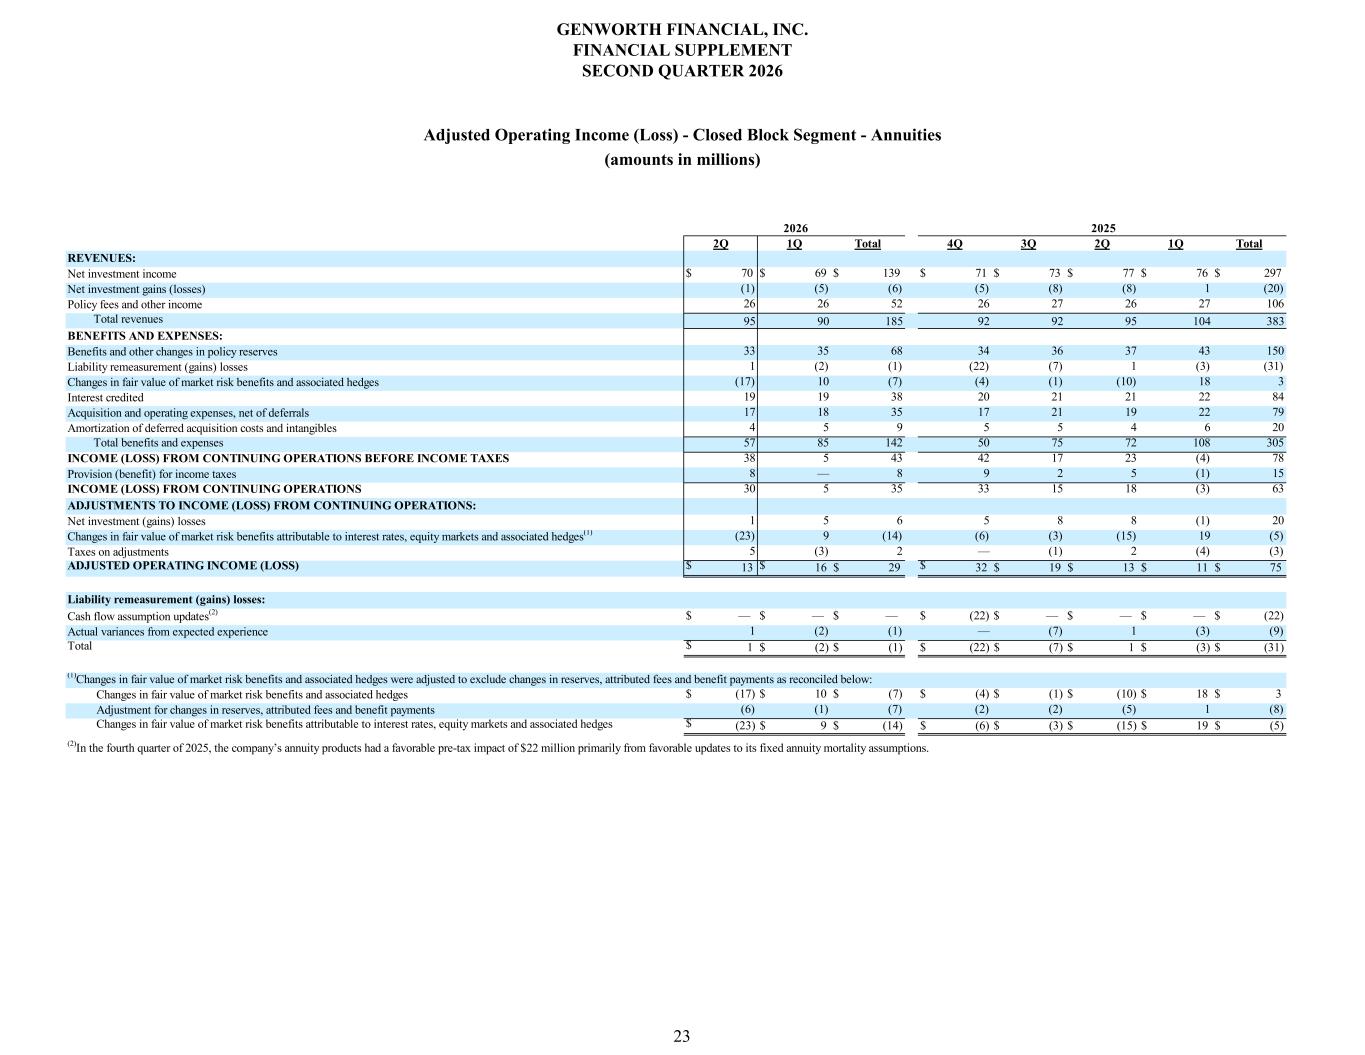
2Q 1Q Total 4Q 3Q 2Q 1Q Total $ 70 $ 69 $ 139 $ 71 $ 73 $ 77 $ 76 $ 297 (1) (5) (6) (5) (8) (8) 1 (20) 26 26 52 26 27 26 27 106 Total revenues 95 90 185 92 92 95 104 383 33 35 68 34 36 37 43 150 1 (2) (1) (22) (7) 1 (3) (31) (17) 10 (7) (4) (1) (10) 18 3 19 19 38 20 21 21 22 84 17 18 35 17 21 19 22 79 4 5 9 5 5 4 6 20 Total benefits and expenses 57 85 142 50 75 72 108 305 38 5 43 42 17 23 (4) 78 8 — 8 9 2 5 (1) 15 30 5 35 33 15 18 (3) 63 1 5 6 5 8 8 (1) 20 (23) 9 (14) (6) (3) (15) 19 (5) 5 (3) 2 — (1) 2 (4) (3) $ 13 $ 16 $ 29 $ 32 $ 19 $ 13 $ 11 $ 75 $ — $ — $ — $ (22) $ — $ — $ — $ (22) 1 (2) (1) — (7) 1 (3) (9) $ 1 $ (2) $ (1) $ (22) $ (7) $ 1 $ (3) $ (31) $ (17) $ 10 $ (7) $ (4) $ (1) $ (10) $ 18 $ 3 (6) (1) (7) (2) (2) (5) 1 (8) $ (23) $ 9 $ (14) $ (6) $ (3) $ (15) $ 19 $ (5) Actual variances from expected experience Total (1)Changes in fair value of market risk benefits and associated hedges were adjusted to exclude changes in reserves, attributed fees and benefit payments as reconciled below: (2)In the fourth quarter of 2025, the company’s annuity products had a favorable pre-tax impact of $22 million primarily from favorable updates to its fixed annuity mortality assumptions. Changes in fair value of market risk benefits and associated hedges Changes in fair value of market risk benefits attributable to interest rates, equity markets and associated hedges Adjustment for changes in reserves, attributed fees and benefit payments Changes in fair value of market risk benefits attributable to interest rates, equity markets and associated hedges(1) Taxes on adjustments ADJUSTED OPERATING INCOME (LOSS) Liability remeasurement (gains) losses: Cash flow assumption updates(2) INCOME (LOSS) FROM CONTINUING OPERATIONS BEFORE INCOME TAXES INCOME (LOSS) FROM CONTINUING OPERATIONS Provision (benefit) for income taxes Net investment (gains) losses ADJUSTMENTS TO INCOME (LOSS) FROM CONTINUING OPERATIONS: Liability remeasurement (gains) losses Interest credited Changes in fair value of market risk benefits and associated hedges Amortization of deferred acquisition costs and intangibles Acquisition and operating expenses, net of deferrals 2025 BENEFITS AND EXPENSES: Benefits and other changes in policy reserves REVENUES: Net investment income Policy fees and other income Net investment gains (losses) 2026 23 GENWORTH FINANCIAL, INC. FINANCIAL SUPPLEMENT SECOND QUARTER 2026 Adjusted Operating Income (Loss) - Closed Block Segment - Annuities (amounts in millions)

Corporate and Other
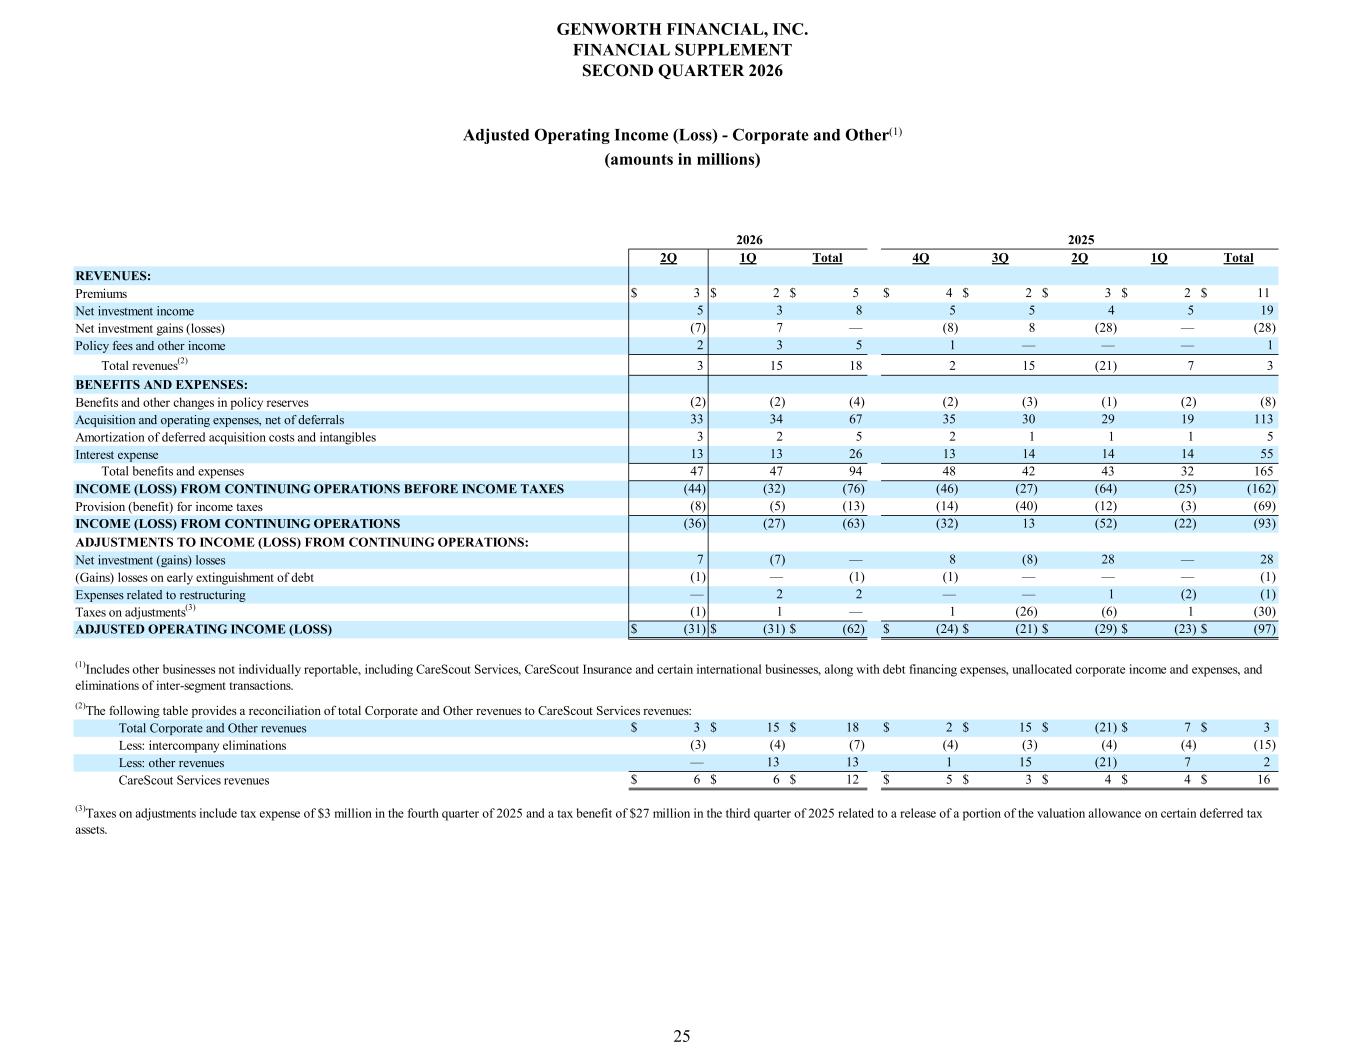
2Q 1Q Total 4Q 3Q 2Q 1Q Total $ 3 $ 2 $ 5 $ 4 $ 2 $ 3 $ 2 $ 11 5 3 8 5 5 4 5 19 (7) 7 — (8) 8 (28) — (28) 2 3 5 1 — — — 1 Total revenues(2) 3 15 18 2 15 (21) 7 3 (2) (2) (4) (2) (3) (1) (2) (8) 33 34 67 35 30 29 19 113 3 2 5 2 1 1 1 5 13 13 26 13 14 14 14 55 Total benefits and expenses 47 47 94 48 42 43 32 165 (44) (32) (76) (46) (27) (64) (25) (162) (8) (5) (13) (14) (40) (12) (3) (69) (36) (27) (63) (32) 13 (52) (22) (93) 7 (7) — 8 (8) 28 — 28 (1) — (1) (1) — — — (1) — 2 2 — — 1 (2) (1) (1) 1 — 1 (26) (6) 1 (30) $ (31) $ (31) $ (62) $ (24) $ (21) $ (29) $ (23) $ (97) $ 3 $ 15 $ 18 $ 2 $ 15 $ (21) $ 7 $ 3 (3) (4) (7) (4) (3) (4) (4) (15) — 13 13 1 15 (21) 7 2 $ 6 $ 6 $ 12 $ 5 $ 3 $ 4 $ 4 $ 16 (3)Taxes on adjustments include tax expense of $3 million in the fourth quarter of 2025 and a tax benefit of $27 million in the third quarter of 2025 related to a release of a portion of the valuation allowance on certain deferred tax assets. Taxes on adjustments(3) ADJUSTED OPERATING INCOME (LOSS) Total Corporate and Other revenues Less: intercompany eliminations CareScout Services revenues Less: other revenues (1)Includes other businesses not individually reportable, including CareScout Services, CareScout Insurance and certain international businesses, along with debt financing expenses, unallocated corporate income and expenses, and eliminations of inter-segment transactions. (2)The following table provides a reconciliation of total Corporate and Other revenues to CareScout Services revenues: Provision (benefit) for income taxes INCOME (LOSS) FROM CONTINUING OPERATIONS Net investment (gains) losses ADJUSTMENTS TO INCOME (LOSS) FROM CONTINUING OPERATIONS: Expenses related to restructuring (Gains) losses on early extinguishment of debt Benefits and other changes in policy reserves Acquisition and operating expenses, net of deferrals Interest expense Amortization of deferred acquisition costs and intangibles INCOME (LOSS) FROM CONTINUING OPERATIONS BEFORE INCOME TAXES 2026 2025 BENEFITS AND EXPENSES: Policy fees and other income REVENUES: Premiums Net investment gains (losses) Net investment income 25 Adjusted Operating Income (Loss) - Corporate and Other(1) (amounts in millions) GENWORTH FINANCIAL, INC. FINANCIAL SUPPLEMENT SECOND QUARTER 2026

Additional Financial Data
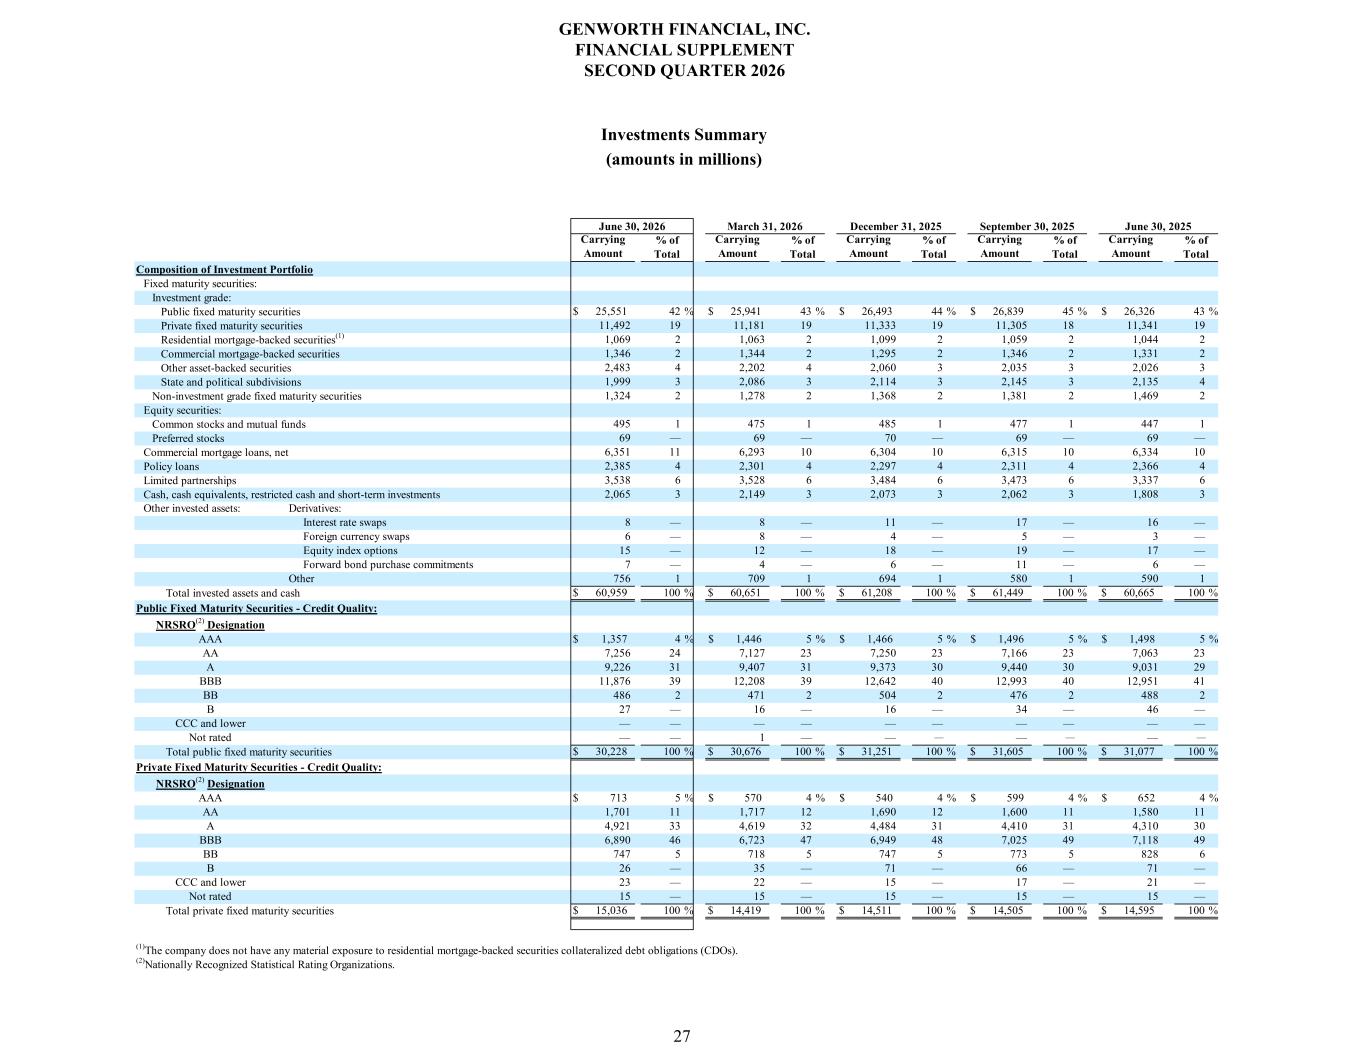
Carrying Amount Carrying Amount Carrying Amount Carrying Amount Carrying Amount $ 25,551 42 % $ 25,941 43 % $ 26,493 44 % $ 26,839 45 % $ 26,326 43 % 11,492 19 11,181 19 11,333 19 11,305 18 11,341 19 1,069 2 1,063 2 1,099 2 1,059 2 1,044 2 1,346 2 1,344 2 1,295 2 1,346 2 1,331 2 2,483 4 2,202 4 2,060 3 2,035 3 2,026 3 1,999 3 2,086 3 2,114 3 2,145 3 2,135 4 1,324 2 1,278 2 1,368 2 1,381 2 1,469 2 495 1 475 1 485 1 477 1 447 1 69 — 69 — 70 — 69 — 69 — 6,351 11 6,293 10 6,304 10 6,315 10 6,334 10 2,385 4 2,301 4 2,297 4 2,311 4 2,366 4 3,538 6 3,528 6 3,484 6 3,473 6 3,337 6 2,065 3 2,149 3 2,073 3 2,062 3 1,808 3 Other invested assets: Derivatives: Interest rate swaps 8 — 8 — 11 — 17 — 16 — Foreign currency swaps 6 — 8 — 4 — 5 — 3 — Equity index options 15 — 12 — 18 — 19 — 17 — Forward bond purchase commitments 7 — 4 — 6 — 11 — 6 — Other 756 1 709 1 694 1 580 1 590 1 $ 60,959 100 % $ 60,651 100 % $ 61,208 100 % $ 61,449 100 % $ 60,665 100 % NRSRO(2) Designation AAA $ 1,357 4 % $ 1,446 5 % $ 1,466 5 % $ 1,496 5 % $ 1,498 5 % AA 7,256 24 7,127 23 7,250 23 7,166 23 7,063 23 A 9,226 31 9,407 31 9,373 30 9,440 30 9,031 29 BBB 11,876 39 12,208 39 12,642 40 12,993 40 12,951 41 BB 486 2 471 2 504 2 476 2 488 2 B 27 — 16 — 16 — 34 — 46 — CCC and lower — — — — — — — — — — Not rated — — 1 — — — — — — — $ 30,228 100 % $ 30,676 100 % $ 31,251 100 % $ 31,605 100 % $ 31,077 100 % NRSRO(2) Designation AAA $ 713 5 % $ 570 4 % $ 540 4 % $ 599 4 % $ 652 4 % AA 1,701 11 1,717 12 1,690 12 1,600 11 1,580 11 A 4,921 33 4,619 32 4,484 31 4,410 31 4,310 30 BBB 6,890 46 6,723 47 6,949 48 7,025 49 7,118 49 BB 747 5 718 5 747 5 773 5 828 6 B 26 — 35 — 71 — 66 — 71 — CCC and lower 23 — 22 — 15 — 17 — 21 — Not rated 15 — 15 — 15 — 15 — 15 — $ 15,036 100 % $ 14,419 100 % $ 14,511 100 % $ 14,505 100 % $ 14,595 100 % Total public fixed maturity securities Private Fixed Maturity Securities - Credit Quality: Total private fixed maturity securities (1)The company does not have any material exposure to residential mortgage-backed securities collateralized debt obligations (CDOs). (2)Nationally Recognized Statistical Rating Organizations. Public Fixed Maturity Securities - Credit Quality: % of Total September 30, 2025 June 30, 2025 % of Total Commercial mortgage loans, net Policy loans Limited partnerships Cash, cash equivalents, restricted cash and short-term investments Total invested assets and cash State and political subdivisions Non-investment grade fixed maturity securities Equity securities: Common stocks and mutual funds Preferred stocks Public fixed maturity securities Private fixed maturity securities Residential mortgage-backed securities(1) Commercial mortgage-backed securities Other asset-backed securities March 31, 2026 Composition of Investment Portfolio Fixed maturity securities: Investment grade: December 31, 2025 % of Total % of Total June 30, 2026 % of Total 27 Investments Summary (amounts in millions) GENWORTH FINANCIAL, INC. FINANCIAL SUPPLEMENT SECOND QUARTER 2026
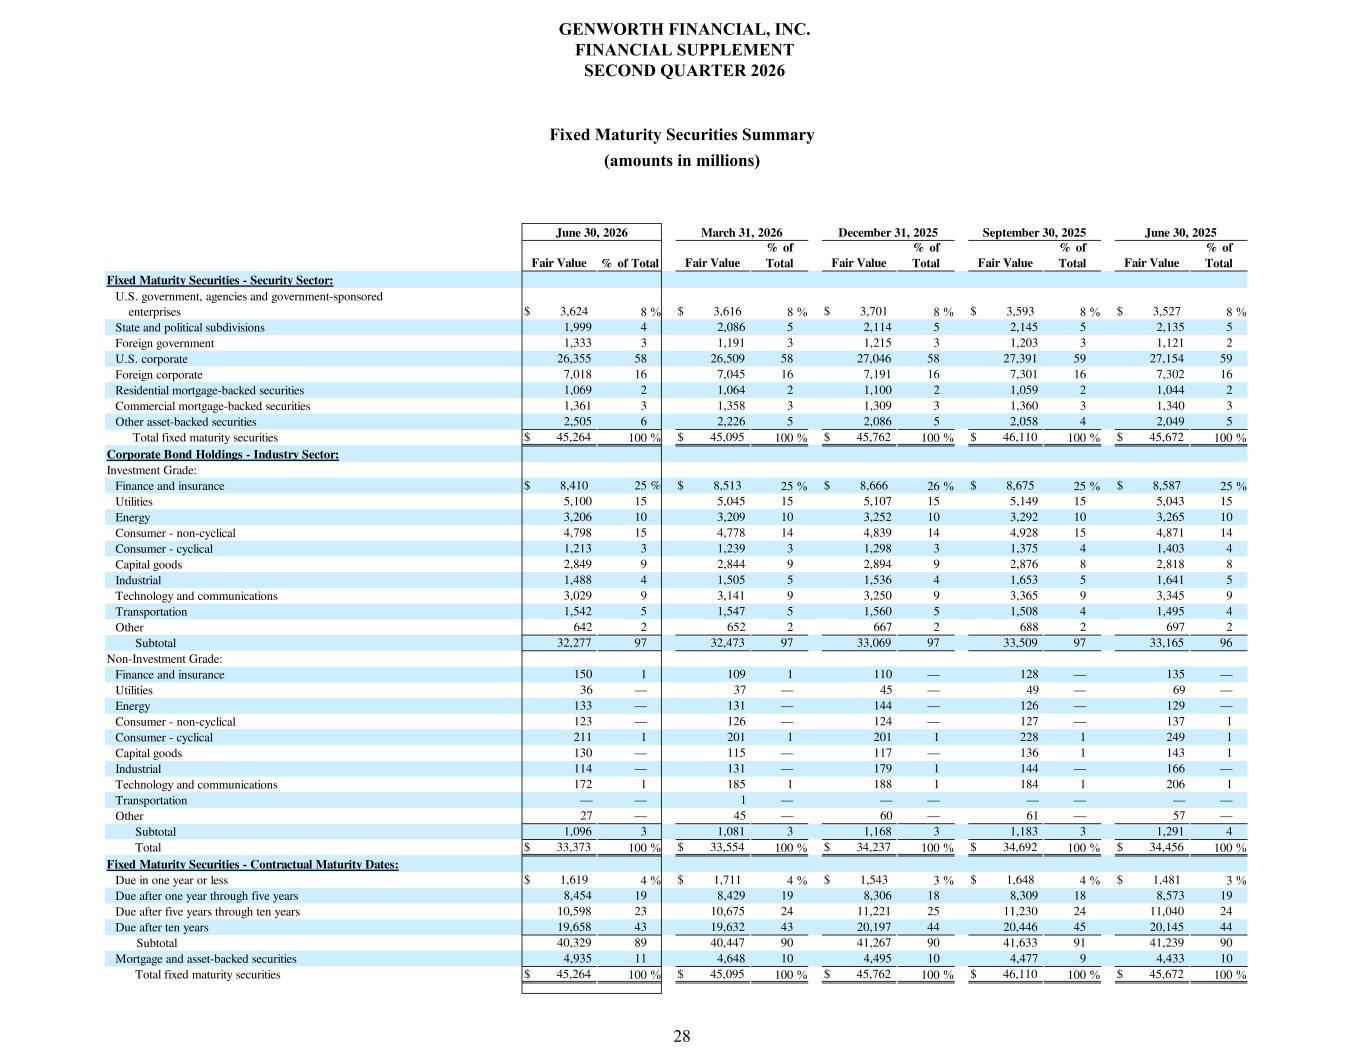
Fair Value Fair Value Fair Value Fair Value Fair Value $ 3,624 8 % $ 3,616 8 % $ 3,701 8 % $ 3,593 8 % $ 3,527 8 % 1,999 4 2,086 5 2,114 5 2,145 5 2,135 5 1,333 3 1,191 3 1,215 3 1,203 3 1,121 2 26,355 58 26,509 58 27,046 58 27,391 59 27,154 59 7,018 16 7,045 16 7,191 16 7,301 16 7,302 16 1,069 2 1,064 2 1,100 2 1,059 2 1,044 2 1,361 3 1,358 3 1,309 3 1,360 3 1,340 3 2,505 6 2,226 5 2,086 5 2,058 4 2,049 5 $ 45,264 100 % $ 45,095 100 % $ 45,762 100 % $ 46,110 100 % $ 45,672 100 % $ 8,410 25 % $ 8,513 25 % $ 8,666 26 % $ 8,675 25 % $ 8,587 25 % 5,100 15 5,045 15 5,107 15 5,149 15 5,043 15 3,206 10 3,209 10 3,252 10 3,292 10 3,265 10 4,798 15 4,778 14 4,839 14 4,928 15 4,871 14 1,213 3 1,239 3 1,298 3 1,375 4 1,403 4 2,849 9 2,844 9 2,894 9 2,876 8 2,818 8 1,488 4 1,505 5 1,536 4 1,653 5 1,641 5 3,029 9 3,141 9 3,250 9 3,365 9 3,345 9 1,542 5 1,547 5 1,560 5 1,508 4 1,495 4 642 2 652 2 667 2 688 2 697 2 32,277 97 32,473 97 33,069 97 33,509 97 33,165 96 150 1 109 1 110 — 128 — 135 — 36 — 37 — 45 — 49 — 69 — 133 — 131 — 144 — 126 — 129 — 123 — 126 — 124 — 127 — 137 1 211 1 201 1 201 1 228 1 249 1 130 — 115 — 117 — 136 1 143 1 114 — 131 — 179 1 144 — 166 — 172 1 185 1 188 1 184 1 206 1 — — 1 — — — — — — — 27 — 45 — 60 — 61 — 57 — 1,096 3 1,081 3 1,168 3 1,183 3 1,291 4 $ 33,373 100 % $ 33,554 100 % $ 34,237 100 % $ 34,692 100 % $ 34,456 100 % $ 1,619 4 % $ 1,711 4 % $ 1,543 3 % $ 1,648 4 % $ 1,481 3 % 8,454 19 8,429 19 8,306 18 8,309 18 8,573 19 10,598 23 10,675 24 11,221 25 11,230 24 11,040 24 19,658 43 19,632 43 20,197 44 20,446 45 20,145 44 40,329 89 40,447 90 41,267 90 41,633 91 41,239 90 4,935 11 4,648 10 4,495 10 4,477 9 4,433 10 $ 45,264 100 % $ 45,095 100 % $ 45,762 100 % $ 46,110 100 % $ 45,672 100 % Due after ten years Subtotal Mortgage and asset-backed securities Total fixed maturity securities Consumer - non-cyclical Consumer - cyclical Capital goods Industrial Technology and communications Transportation Other Subtotal Total Fixed Maturity Securities - Contractual Maturity Dates: Due in one year or less Due after one year through five years Due after five years through ten years Non-Investment Grade: Finance and insurance Utilities Energy % of Total Industrial Technology and communications Transportation Other Subtotal Utilities Energy Consumer - non-cyclical Consumer - cyclical Capital goods Other asset-backed securities Total fixed maturity securities Corporate Bond Holdings - Industry Sector: Investment Grade: Finance and insurance Foreign government U.S. corporate Foreign corporate Residential mortgage-backed securities Commercial mortgage-backed securities March 31, 2026 December 31, 2025 % of Total % of Total September 30, 2025 June 30, 2025 % of Total Fixed Maturity Securities - Security Sector: U.S. government, agencies and government-sponsored enterprises State and political subdivisions % of Total June 30, 2026 GENWORTH FINANCIAL, INC. FINANCIAL SUPPLEMENT SECOND QUARTER 2026 Fixed Maturity Securities Summary (amounts in millions) 28
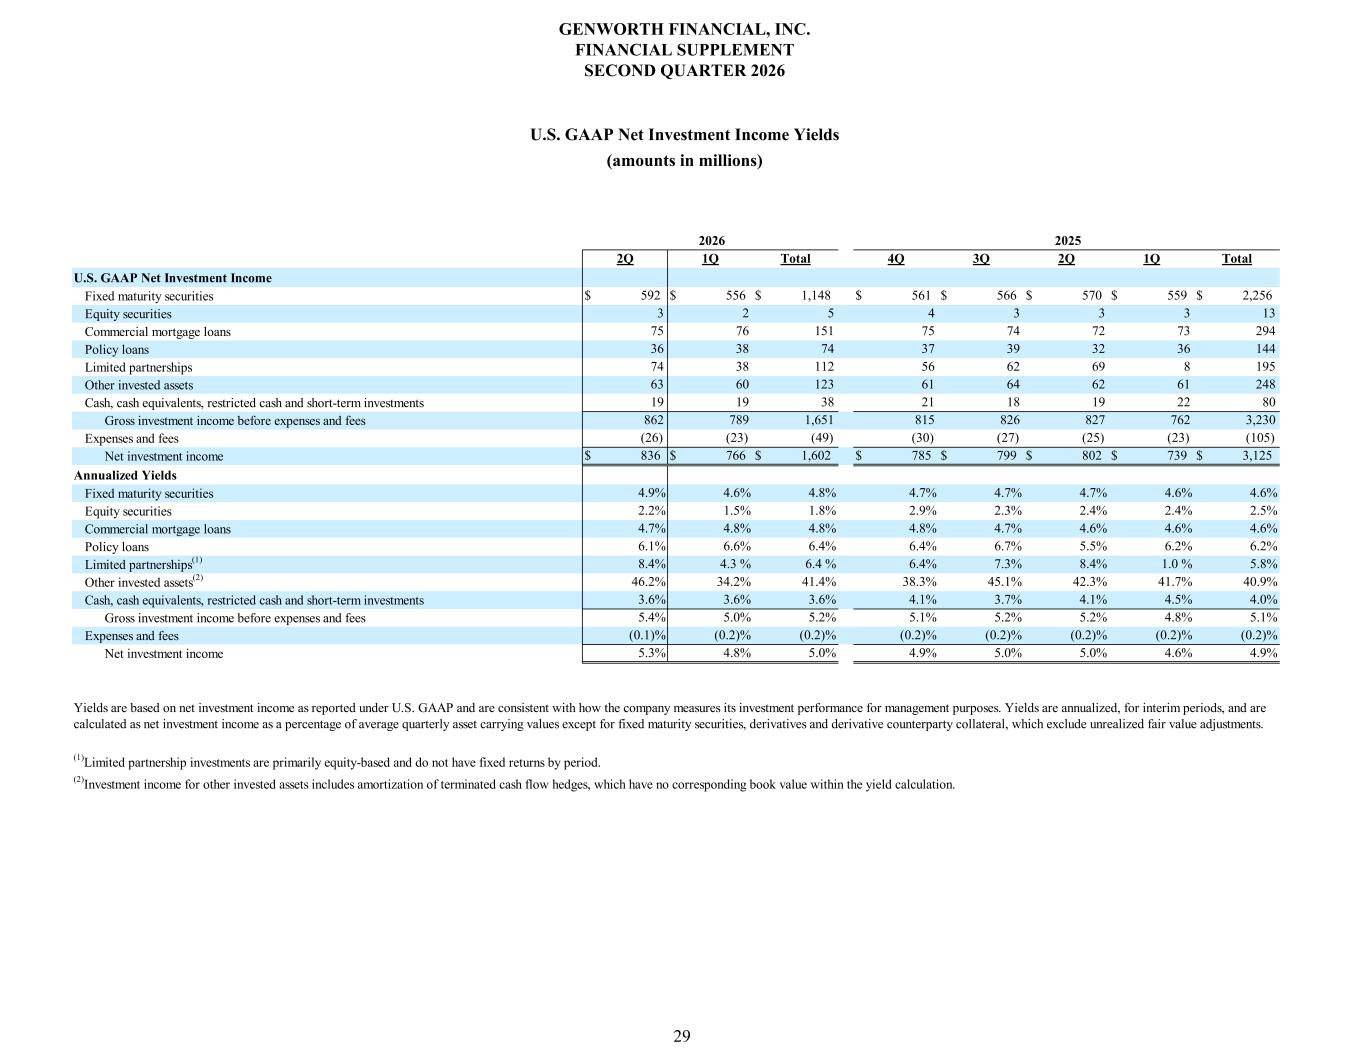
2Q 1Q Total 4Q 3Q 2Q 1Q Total $ 592 $ 556 $ 1,148 $ 561 $ 566 $ 570 $ 559 $ 2,256 3 2 5 4 3 3 3 13 75 76 151 75 74 72 73 294 36 38 74 37 39 32 36 144 74 38 112 56 62 69 8 195 63 60 123 61 64 62 61 248 19 19 38 21 18 19 22 80 862 789 1,651 815 826 827 762 3,230 (26) (23) (49) (30) (27) (25) (23) (105) $ 836 $ 766 $ 1,602 $ 785 $ 799 $ 802 $ 739 $ 3,125 4.9% 4.6% 4.8% 4.7% 4.7% 4.7% 4.6% 4.6% 2.2% 1.5% 1.8% 2.9% 2.3% 2.4% 2.4% 2.5% 4.7% 4.8% 4.8% 4.8% 4.7% 4.6% 4.6% 4.6% 6.1% 6.6% 6.4% 6.4% 6.7% 5.5% 6.2% 6.2% 8.4% 4.3 % 6.4 % 6.4% 7.3% 8.4% 1.0 % 5.8% 46.2% 34.2% 41.4% 38.3% 45.1% 42.3% 41.7% 40.9% 3.6% 3.6% 3.6% 4.1% 3.7% 4.1% 4.5% 4.0% 5.4% 5.0% 5.2% 5.1% 5.2% 5.2% 4.8% 5.1% (0.1)% (0.2)% (0.2)% (0.2)% (0.2)% (0.2)% (0.2)% (0.2)% 5.3% 4.8% 5.0% 4.9% 5.0% 5.0% 4.6% 4.9%Net investment income Expenses and fees (2)Investment income for other invested assets includes amortization of terminated cash flow hedges, which have no corresponding book value within the yield calculation. (1)Limited partnership investments are primarily equity-based and do not have fixed returns by period. Yields are based on net investment income as reported under U.S. GAAP and are consistent with how the company measures its investment performance for management purposes. Yields are annualized, for interim periods, and are calculated as net investment income as a percentage of average quarterly asset carrying values except for fixed maturity securities, derivatives and derivative counterparty collateral, which exclude unrealized fair value adjustments. Policy loans Commercial mortgage loans Limited partnerships(1) Other invested assets(2) Gross investment income before expenses and fees Cash, cash equivalents, restricted cash and short-term investments Net investment income Expenses and fees Annualized Yields Fixed maturity securities Equity securities Policy loans Commercial mortgage loans Limited partnerships Other invested assets Gross investment income before expenses and fees Cash, cash equivalents, restricted cash and short-term investments U.S. GAAP Net Investment Income Fixed maturity securities Equity securities 2026 2025 29 U.S. GAAP Net Investment Income Yields (amounts in millions) GENWORTH FINANCIAL, INC. FINANCIAL SUPPLEMENT SECOND QUARTER 2026
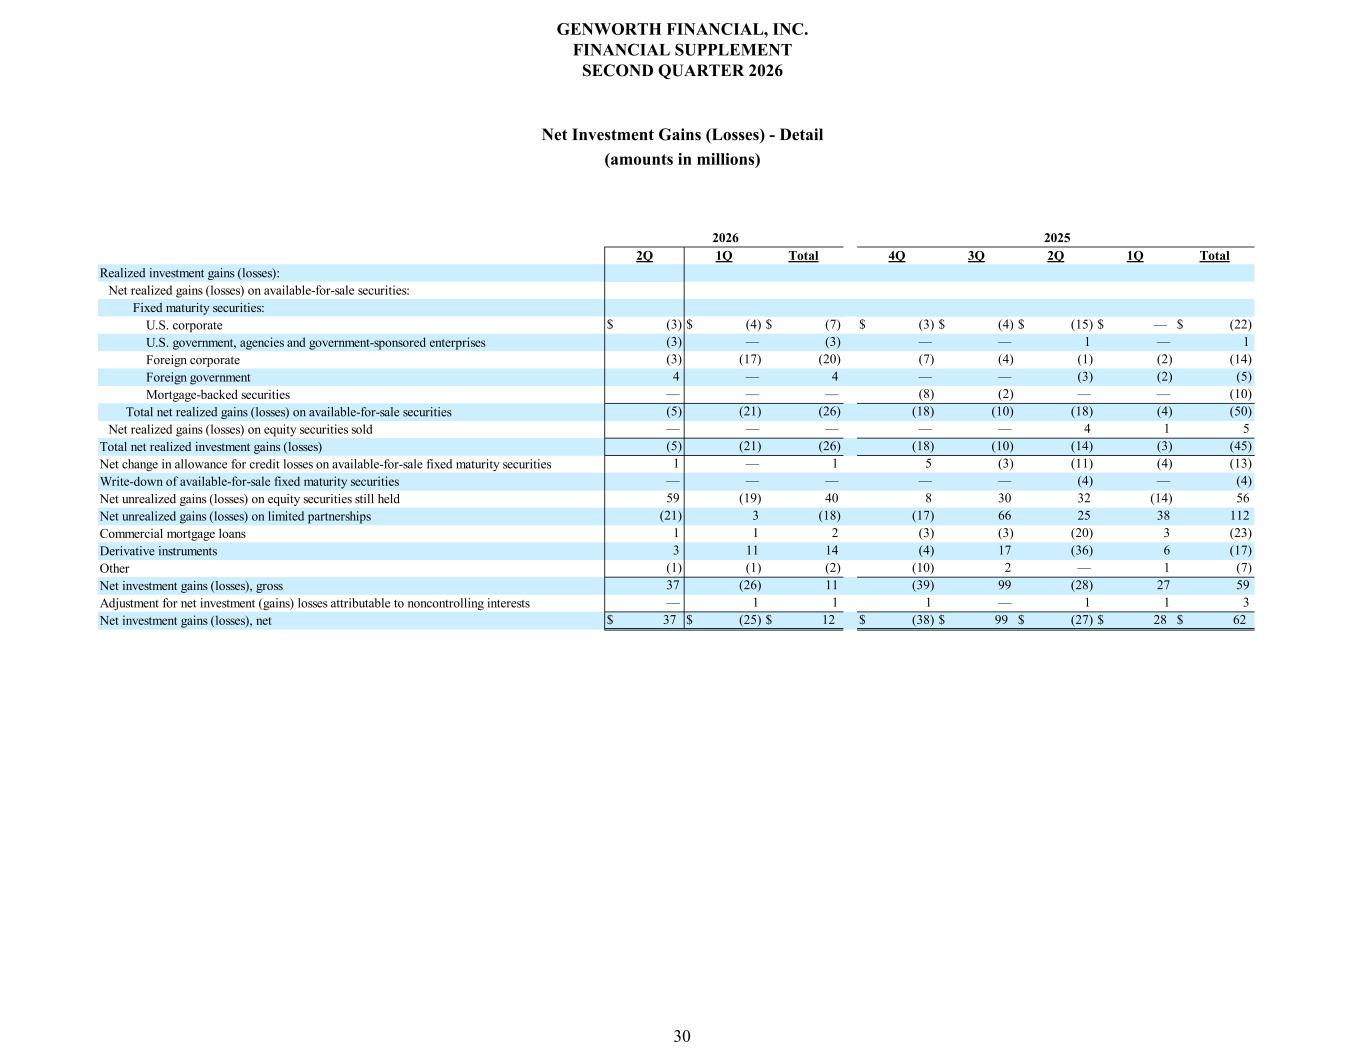
2Q 1Q Total 4Q 3Q 2Q 1Q Total $ (3) $ (4) $ (7) $ (3) $ (4) $ (15) $ — $ (22) (3) — (3) — — 1 — 1 (3) (17) (20) (7) (4) (1) (2) (14) 4 — 4 — — (3) (2) (5) — — — (8) (2) — — (10) (5) (21) (26) (18) (10) (18) (4) (50) — — — — — 4 1 5 (5) (21) (26) (18) (10) (14) (3) (45) 1 — 1 5 (3) (11) (4) (13) — — — — — (4) — (4) 59 (19) 40 8 30 32 (14) 56 (21) 3 (18) (17) 66 25 38 112 1 1 2 (3) (3) (20) 3 (23) 3 11 14 (4) 17 (36) 6 (17) (1) (1) (2) (10) 2 — 1 (7) 37 (26) 11 (39) 99 (28) 27 59 — 1 1 1 — 1 1 3 $ 37 $ (25) $ 12 $ (38) $ 99 $ (27) $ 28 $ 62 Other Net investment gains (losses), gross Net investment gains (losses), net Adjustment for net investment (gains) losses attributable to noncontrolling interests Net change in allowance for credit losses on available-for-sale fixed maturity securities Write-down of available-for-sale fixed maturity securities Net unrealized gains (losses) on limited partnerships Net unrealized gains (losses) on equity securities still held Derivative instruments Commercial mortgage loans Foreign government Mortgage-backed securities Total net realized gains (losses) on available-for-sale securities Total net realized investment gains (losses) Net realized gains (losses) on equity securities sold 2025 Foreign corporate U.S. government, agencies and government-sponsored enterprises Realized investment gains (losses): Net realized gains (losses) on available-for-sale securities: U.S. corporate Fixed maturity securities: 2026 30 Net Investment Gains (Losses) - Detail (amounts in millions) GENWORTH FINANCIAL, INC. FINANCIAL SUPPLEMENT SECOND QUARTER 2026

Reconciliations of Non-GAAP Measures
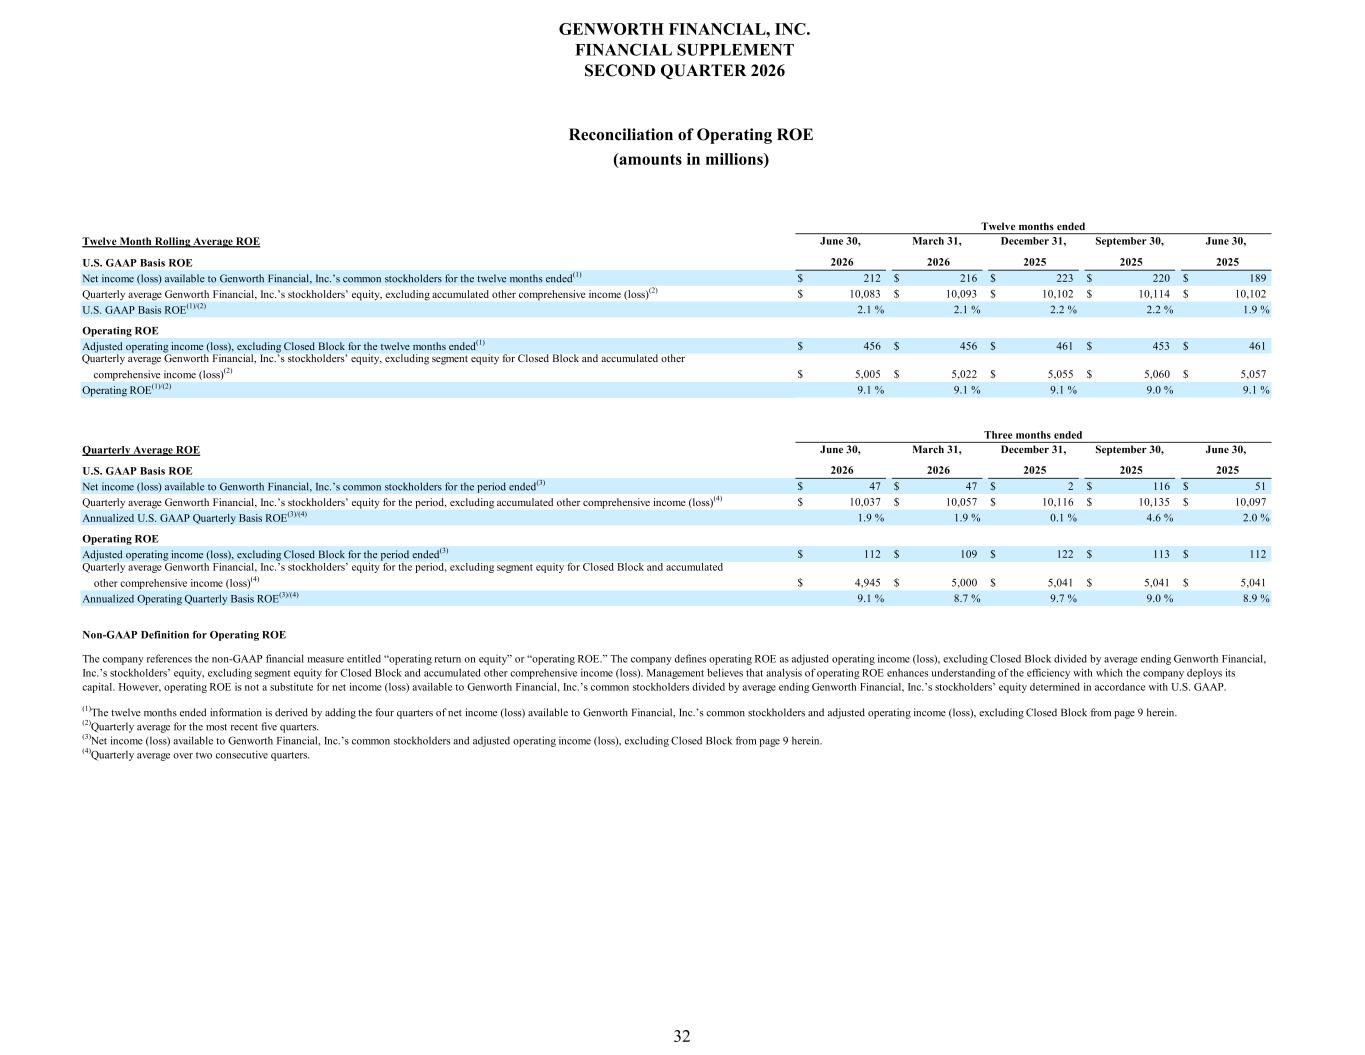
June 30, March 31, December 31, September 30, June 30, 2026 2026 2025 2025 2025 $ 212 $ 216 $ 223 $ 220 $ 189 $ 10,083 $ 10,093 $ 10,102 $ 10,114 $ 10,102 2.1 % 2.1 % 2.2 % 2.2 % 1.9 % $ 456 $ 456 $ 461 $ 453 $ 461 $ 5,005 $ 5,022 $ 5,055 $ 5,060 $ 5,057 9.1 % 9.1 % 9.1 % 9.0 % 9.1 % June 30, March 31, December 31, September 30, June 30, 2026 2026 2025 2025 2025 $ 47 $ 47 $ 2 $ 116 $ 51 $ 10,037 $ 10,057 $ 10,116 $ 10,135 $ 10,097 1.9 % 1.9 % 0.1 % 4.6 % 2.0 % $ 112 $ 109 $ 122 $ 113 $ 112 $ 4,945 $ 5,000 $ 5,041 $ 5,041 $ 5,041 9.1 % 8.7 % 9.7 % 9.0 % 8.9 % Non-GAAP Definition for Operating ROE The company references the non-GAAP financial measure entitled “operating return on equity” or “operating ROE.” The company defines operating ROE as adjusted operating income (loss), excluding Closed Block divided by average ending Genworth Financial, Inc.’s stockholders’ equity, excluding segment equity for Closed Block and accumulated other comprehensive income (loss). Management believes that analysis of operating ROE enhances understanding of the efficiency with which the company deploys its capital. However, operating ROE is not a substitute for net income (loss) available to Genworth Financial, Inc.’s common stockholders divided by average ending Genworth Financial, Inc.’s stockholders’ equity determined in accordance with U.S. GAAP. Quarterly average Genworth Financial, Inc.’s stockholders’ equity for the period, excluding segment equity for Closed Block and accumulated other comprehensive income (loss)(4) Annualized Operating Quarterly Basis ROE(3)/(4) (4)Quarterly average over two consecutive quarters. (3)Net income (loss) available to Genworth Financial, Inc.’s common stockholders and adjusted operating income (loss), excluding Closed Block from page 9 herein. (2)Quarterly average for the most recent five quarters. (1)The twelve months ended information is derived by adding the four quarters of net income (loss) available to Genworth Financial, Inc.’s common stockholders and adjusted operating income (loss), excluding Closed Block from page 9 herein. Quarterly Average ROE Net income (loss) available to Genworth Financial, Inc.’s common stockholders for the period ended(3) U.S. GAAP Basis ROE Operating ROE Adjusted operating income (loss), excluding Closed Block for the period ended(3) Annualized U.S. GAAP Quarterly Basis ROE(3)/(4) Quarterly average Genworth Financial, Inc.’s stockholders’ equity for the period, excluding accumulated other comprehensive income (loss)(4) Twelve months ended Three months ended Operating ROE(1)/(2) Quarterly average Genworth Financial, Inc.’s stockholders’ equity, excluding segment equity for Closed Block and accumulated other comprehensive income (loss)(2) Operating ROE Adjusted operating income (loss), excluding Closed Block for the twelve months ended(1) Twelve Month Rolling Average ROE Quarterly average Genworth Financial, Inc.’s stockholders’ equity, excluding accumulated other comprehensive income (loss)(2) U.S. GAAP Basis ROE(1)/(2) Net income (loss) available to Genworth Financial, Inc.’s common stockholders for the twelve months ended(1) U.S. GAAP Basis ROE 32 Reconciliation of Operating ROE (amounts in millions) GENWORTH FINANCIAL, INC. FINANCIAL SUPPLEMENT SECOND QUARTER 2026
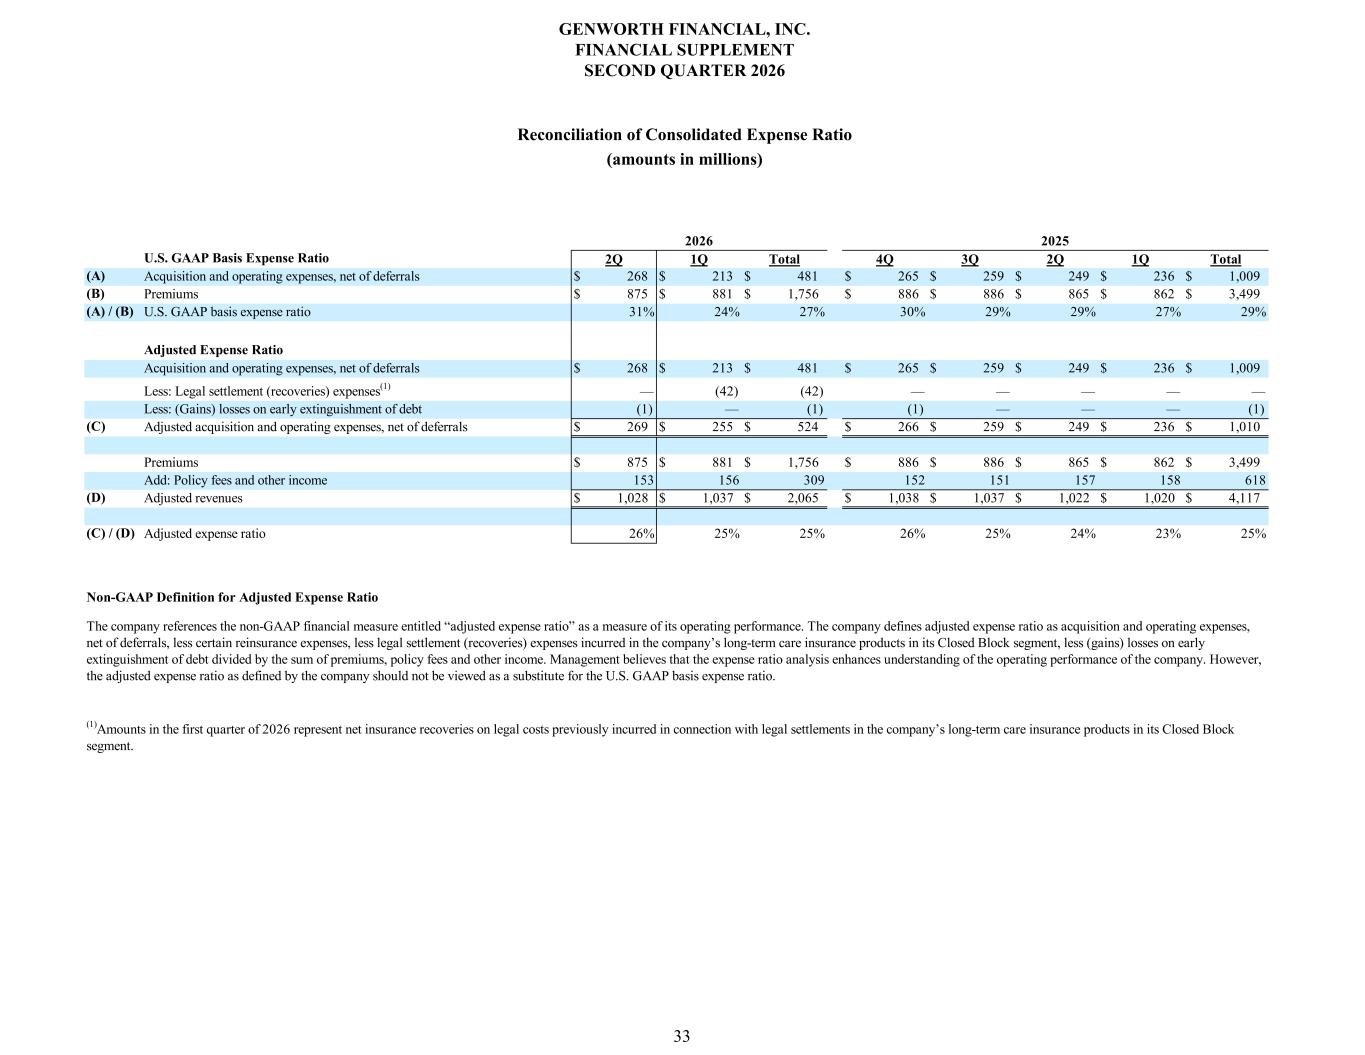
U.S. GAAP Basis Expense Ratio 2Q 1Q Total 4Q 3Q 2Q 1Q Total (A) Acquisition and operating expenses, net of deferrals $ 268 $ 213 $ 481 $ 265 $ 259 $ 249 $ 236 $ 1,009 (B) Premiums $ 875 $ 881 $ 1,756 $ 886 $ 886 $ 865 $ 862 $ 3,499 (A) / (B) U.S. GAAP basis expense ratio 31% 24% 27% 30% 29% 29% 27% 29% Adjusted Expense Ratio Acquisition and operating expenses, net of deferrals $ 268 $ 213 $ 481 $ 265 $ 259 $ 249 $ 236 $ 1,009 Less: Legal settlement (recoveries) expenses(1) — (42) (42) — — — — — Less: (Gains) losses on early extinguishment of debt (1) — (1) (1) — — — (1) (C) Adjusted acquisition and operating expenses, net of deferrals $ 269 $ 255 $ 524 $ 266 $ 259 $ 249 $ 236 $ 1,010 Premiums $ 875 $ 881 $ 1,756 $ 886 $ 886 $ 865 $ 862 $ 3,499 Add: Policy fees and other income 153 156 309 152 151 157 158 618 (D) Adjusted revenues $ 1,028 $ 1,037 $ 2,065 $ 1,038 $ 1,037 $ 1,022 $ 1,020 $ 4,117 (C) / (D) Adjusted expense ratio 26% 25% 25% 26% 25% 24% 23% 25% 2026 2025 Non-GAAP Definition for Adjusted Expense Ratio (1)Amounts in the first quarter of 2026 represent net insurance recoveries on legal costs previously incurred in connection with legal settlements in the company’s long-term care insurance products in its Closed Block segment. The company references the non-GAAP financial measure entitled “adjusted expense ratio” as a measure of its operating performance. The company defines adjusted expense ratio as acquisition and operating expenses, net of deferrals, less certain reinsurance expenses, less legal settlement (recoveries) expenses incurred in the company’s long-term care insurance products in its Closed Block segment, less (gains) losses on early extinguishment of debt divided by the sum of premiums, policy fees and other income. Management believes that the expense ratio analysis enhances understanding of the operating performance of the company. However, the adjusted expense ratio as defined by the company should not be viewed as a substitute for the U.S. GAAP basis expense ratio. 33 Reconciliation of Consolidated Expense Ratio (amounts in millions) GENWORTH FINANCIAL, INC. FINANCIAL SUPPLEMENT SECOND QUARTER 2026