|
ANNUAL REPORT PURSUANT TO SECTION 13 OR 15(d) OF THE SECURITIES EXCHANGE ACT OF 1934 | |
|
For the fiscal year ended | |
|
OR | |
|
TRANSITION REPORT PURSUANT TO SECTION 13 OR 15(d) OF THE SECURITIES EXCHANGE ACT OF 1934 | |
| For the transition period from ______to ______ | |
| Commission file number |
| (State or other jurisdiction of | (I.R.S. Employer |
| incorporation or organization) | Identification No.) |
| (Address of principal executive offices) | (Zip Code) |
(Registrant’s telephone number, including area code)
Securities registered pursuant to Section 12(b) of the Act
| Title of Each Class | Trading Symbol(s) | Name of each exchange on which registered | ||
Indicate by check mark if the
registrant is a well-known seasoned issuer, as defined in Rule 405 of the Securities Act.
Indicate by check mark if the registrant is not required to file reports pursuant to Section 13 or Section 15(d) of the Act. Yes ☐
Indicate by check mark whether the registrant (1) has filed all reports required to be filed by Section 13 or 15(d) of the Securities Exchange Act of 1934 during the preceding 12 months (or for such shorter period that the registrant was required to file such reports) and (2) has been subject to such filing requirements for the past 90 days.
Indicate by check mark whether the registrant has submitted electronically every Interactive Data File required to be submitted pursuant to Rule 405 of Regulation S-T (§232.405 of this chapter) during the preceding 12 months (or for such shorter period that the registrant was required to submit such files).
Indicate by check mark whether the registrant is a large accelerated filer, an accelerated filer, a non-accelerated filer, a smaller reporting company or an emerging growth company. See definitions of “large accelerated filer,” “accelerated filer,” “smaller reporting company” and “emerging growth company” in Rule 12b-2 of the Exchange Act. (Check one):
| ☒ | Accelerated filer | ☐ | Emerging growth company | |||||
| Non-accelerated filer | ☐ | Smaller reporting company |
If an emerging growth company, indicate by check mark if the registrant has elected not to use the extended transition period for complying with any new or revised financial accounting standards provided pursuant to Section 13(a) of the Exchange Act. ☐
Indicate by check mark whether the registrant is a shell company (as defined in Rule 12b-2 of the Exchange Act). Yes ☐
As of April 1, 2020, shares of Class A Common Stock, par value $0.001 per share, were outstanding.
|
|
Explanatory Note
This Amendment No. 1 (this “Amendment”) on Form 10-K/A is being filed with respect to Genworth Financial, Inc.’s Annual Report on Form 10-K for the fiscal year ended December 31, 2019 filed with the Securities and Exchange Commission (the “SEC”) on February 27, 2020 (the “Form 10-K”). This Amendment updates Part III to contain certain additional information required therein.
Except for the changes to Part III and the filing of related certifications added to the list of Exhibits in Part IV, this Amendment makes no changes to the Form 10-K. This Amendment does not reflect events occurring after the filing of the Form 10-K or modify disclosures affected by subsequent events.
On October 21, 2016, Genworth entered into an agreement and plan of merger (the “Merger Agreement”) with Asia Pacific Global Capital Co., Ltd. (“Parent”), a limited liability company incorporated in the People’s Republic of China and a subsidiary of China Oceanwide Holdings Group Co., Ltd., a limited liability company incorporated in the People’s Republic of China (together with its affiliates, “Oceanwide”), and Asia Pacific Global Capital USA Corporation (“Merger Sub”), a Delaware corporation and an indirect, wholly-owned subsidiary of Asia Pacific Insurance USA Holdings LLC (“Asia Pacific Insurance”), which is a Delaware limited liability company owned by Oceanwide, pursuant to which, subject to the terms and conditions set forth therein, Merger Sub would merge with and into Genworth with Genworth surviving the merger as an indirect, wholly-owned subsidiary of Asia Pacific Insurance (the “Merger” or “Oceanwide Transaction”). Oceanwide has agreed to acquire all of our outstanding common stock for a total transaction value of approximately $2.7 billion, or $5.43 per share in cash. The transaction has been approved by Genworth’s stockholders and is subject to other closing conditions.
Genworth stated in its 2019 Proxy Statement, filed with the SEC on November 1, 2019, that it expected to hold its 2020 Annual Meeting of Stockholders (the “2020 Annual Meeting”) on or about July 23, 2020. Due to the fact that Genworth and Oceanwide are still working to satisfy the closing conditions under the Merger Agreement, Genworth’s Board of Directors has decided to defer the 2020 Annual Meeting to a later date. In the event Genworth holds a 2020 Annual Meeting, a press release will be issued, with sufficient notice to stockholders, announcing: (i) the date, time and location of the 2020 Annual Meeting; (ii) the deadline for receipt of stockholder proposals submitted under Rule 14a-8 of the Securities Exchange Act of 1934 (the “Exchange Act”) for inclusion in Genworth’s proxy materials for the 2020 Annual Meeting; and (iii) the new deadline for written notice of director nominations and other business proposals that stockholders intend to be presented at the 2020 Annual meeting outside of Rule14a-8 of the Exchange Act.
As used in this Amendment, the terms “Genworth,” the “company,” “we,” “our” and “us” refer to Genworth Financial, Inc.
Genworth Financial, Inc. 2
|
|
Genworth Financial, Inc.
Table of Contents
3 Form 10-K/A
|
|
Part III
| Item 10. |
Directors, Executive Officers and Corporate Governance |
Executive Officers
The following table sets forth certain information concerning our executive officers:
| Name | Age | Positions |
| Thomas J. McInerney | 63 | President and Chief Executive Officer, Director |
| Kelly L. Groh | 51 | Executive Vice President and Chief Financial Officer |
| Kevin D. Schneider | 58 | Executive Vice President and Chief Operating Officer |
| Ward E. Bobitz | 55 | Executive Vice President and General Counsel |
| Pamela M. Harrison | 55 | Executive Vice President—Human Resources |
| Daniel J. Sheehan IV | 54 | Executive Vice President—Chief Investment Officer |
The following sets forth certain biographical information with respect to our executive officers listed above.
Thomas J. McInerney has been our President and Chief Executive Officer and a director since January 2013. Before joining our company, Mr. McInerney had served as a Senior Advisor to the Boston Consulting Group from June 2011 to December 2012, providing consulting and advisory services to leading insurance and financial services companies in the United States and Canada. From October 2009 to December 2010, Mr. McInerney was a member of ING Groep’s Management Board for Insurance, where he was the Chief Operating Officer of ING’s insurance and investment management business worldwide. Prior to that, he served in a variety of senior roles with ING Groep NV after serving in many leadership positions with Aetna, where he began his career as an insurance underwriter in June 1978. Mr. McInerney is also on the board of the Richmond Performing Arts Alliance. Mr. McInerney is a member of the American Council of Life Insurers and serves, and has served, on its CEO Steering Committees and Board. Mr. McInerney received a B.A. in Economics from Colgate University and an M.B.A. from the Tuck School of Business at Dartmouth College and serves on Tuck’s Board of Advisors.
Kelly L. Groh has been our Executive Vice President and Chief Financial Officer since October 2015. Ms. Groh also served as our Principal Accounting Officer from May 2012 to April 2016, the Company’s Vice President and Controller from May 2012 to November 2015, and as Acting Chief Financial Officer of our U.S. life insurance businesses from August 2014 through January 2015. Ms. Groh served in the Company’s Investment organization as Senior Vice President of Investment Portfolio Management from December 2010 to May 2012. From August 2008 to December 2010, she served as the Chief Financial Officer of the Company’s previous Retirement and Protection segment. From July 2004 to August 2008, she served as Senior Vice President, Finance, which role included responsibility for varying periods of time over the Financial Planning and Analysis and the Investor Relations functions. From March 1996 until the Company’s initial public offering (“IPO”) in 2004, Ms. Groh served in various finance capacities for predecessor companies, including GE Financial Assurance Holdings, Inc. Prior to joining the Company, Ms. Groh was employed by Price Waterhouse, LLP (now PriceWaterhouseCoopers, LLP) from September 1990 to March 1996. Ms. Groh received a B.A. in Business Administration (Accounting) from the University of Washington and graduated from The Executive Program at the Darden Graduate School of Business at the University of Virginia. Ms. Groh is a certified public accountant (CPA) and a chartered global management accountant (CGMA).
Genworth Financial, Inc. 4
|
Part III |
Kevin D. Schneider has been our Executive Vice President and Chief Operating Officer since January 2016 and is responsible for all the daily operations and operating performance of our businesses. Prior to that, he was Executive Vice President—Global Mortgage Insurance from May 2015 to January 2016 (Executive Vice President-Genworth from May 2012 to May 2015) responsible for our global mortgage insurance businesses. From July 2008 until May 2012, Mr. Schneider was Senior Vice President—Genworth with continuing responsibility for the Company’s U.S. mortgage insurance business. Prior thereto, Mr. Schneider served as the President and Chief Executive Officer of the Company’s U.S. mortgage insurance business since the completion of the Company’s IPO in May 2004. Prior to the IPO, he was a Senior Vice President and Chief Commercial Officer of General Electric Mortgage Insurance Corporation since April 2003. From January 2003 to April 2003, Mr. Schneider was the Chief Quality Officer for GE Commercial Finance—Americas. From September 2001 to December 2002, he was a Quality Leader for GE Capital Corporate. From April 1998 to September 2001, Mr. Schneider was an Executive Vice President with GE Capital Rail Services. Prior thereto, he had been with GATX Corp. where he was a Vice President—Sales from November 1994 to April 1998 and a Regional Manager from October 1992 to November 1994. From July 1984 to October 1992, Mr. Schneider was with Ryder System where he held various positions. Mr. Schneider received a B.S. degree in Industrial Labor Relations from Cornell University and an M.B.A. from the Kellogg Business School.
Ward E. Bobitz has been our Executive Vice President and General Counsel since January 2015. Prior to that, he served as a Vice President and Assistant Secretary, responsible for corporate transactions and regulatory matters, since the completion of our IPO in May 2004. Prior to the IPO, he served as a Vice President and Assistant Secretary of GE Financial Assurance Holdings, Inc. (“GEFAHI”) since October 1997. From September 1993 to October 1997, Mr. Bobitz was with the law firm of LeBoeuf, Lamb, Greene, and MacRae. Mr. Bobitz received a B.A. in Economics from Columbia University and a J.D. from the University of Michigan Law School. He is a member of the New York Bar and the Virginia Bar.
Pamela M. Harrison has been our Executive Vice President—Human Resources since January 2018. Prior thereto, she was the Human Resources Leader responsible for organization and talent development at Latham & Watkins, LLP from March 2012 to December 2017. From June 2003 to October 2011, Ms. Harrison was with Marsh & McLennan Companies where she gained significant experience in the insurance industry and international markets serving in the role of Managing Director International Human Resources with responsibilities in Europe, Latin America, the Middle East, Africa, and the Asia Pacific Region and Senior Vice President Human Resources with responsibilities over global specialty risk and national risk practices. She also served in human resource positions with Protiviti (formerly a division of Arthur Andersen LLP), Frito-Lay, Inc., MasterCard and Liz Claiborne, Inc. Ms. Harrison received a B.A. in Psychology from the University of Delaware.
Daniel J. Sheehan IV has been our Executive Vice President—Chief Investment Officer since December 2013. Prior to that, he served as our Senior Vice President—Chief Investment Officer since April 2012. From January 2009 to April 2012, he served as our Vice President with responsibilities that included oversight of the Company’s insurance investment portfolios. From January 2008 through December 2008, Mr. Sheehan had management responsibilities of the Company’s portfolio management team, including fixed-income trading. From December 1997 through December 2007, Mr. Sheehan served in various capacities with the Company and/or its predecessor including roles with oversight responsibilities for the investments real estate team, as risk manager of the insurance portfolios and as risk manager of the portfolio management team. Prior to joining our Company, Mr. Sheehan had been with Sun Life of Canada from 1993 to 1997 as a Property Investment Officer in the Real Estate Investments group. Prior thereto, he was with Massachusetts Laborers Benefit Fund from 1987 to 1993, as an auditor and auditing supervisor. Mr. Sheehan graduated from Harvard University with a BA in Economics and later received an MBA in Finance from Babson College.
5 Form 10-K/A
|
Part III |
Our Board of Directors
The table below sets forth information about the members of the Genworth Financial, Inc. Board of Directors (the “Board” or the “Board of Directors”), including their ages and length of service on our Board. The Board has determined that seven of the eight directors are independent directors under the New York Stock Exchange (“NYSE”) listing requirements and our Governance Principles.
| Director | Age | Director Since | |
| G. Kent Conrad | 72 | 2013 | |
| Melina E. Higgins | 52 | 2013 | |
| Thomas J. McInerney | 63 | 2013 | |
| David M. Moffett | 68 | 2012 | |
| Thomas E. Moloney | 76 | * | 2009 |
| Debra J. Perry | 68 | 2016 | |
| Robert P. Restrepo Jr. | 69 | 2016 | |
| James S. Riepe+ | 76 | * | 2006 |
|
* |
Our Governance Principles state that directors generally will not be nominated for election to our Board of Directors after their 73rd birthday, although the Board may nominate candidates over 73 for special circumstances. On October 16, 2019, the Board of Directors determined that special circumstances existed to nominate for election to the Board at the 2019 Annual Meeting of Stockholders held on December 12, 2019 (the “2019 Annual Meeting”) each of Mr. Moloney and Mr. Riepe after his 73rd birthday. At the 2019 Annual Meeting, the stockholders voted to elect each of Mr. Moloney and Mr. Riepe to the Board of Directors to hold office until the 2020 Annual Meeting and until his successor has been elected and qualified. |
|
+ |
Non-Executive Chairman of the Board |
Genworth Financial, Inc. 6
|
Part III |
G. Kent Conrad, former U.S. Senator.
Sen. Conrad served as a U.S. Senator representing the State of North Dakota from January 1987 to January 2013. He served as chairman or Ranking Member of the Senate Budget Committee for 12 years. Prior to serving in the U.S. Senate, Sen. Conrad served as the Tax Commissioner for the State of North Dakota from 1981 to 1986 and as Assistant Tax Commissioner from 1974 to 1980. Sen. Conrad received an A.B. in Political Science from Stanford University and an M.B.A. from George Washington University.
Qualifications: Sen. Conrad’s 28 years of experience as a U.S. Senator, including serving as Chair of the Senate Budget Committee for approximately six years, provides the Board with extensive information and insight into public policy, fiscal affairs, governmental relations and legislative and regulatory issues.
Committees: Sen. Conrad serves as the Chair of the Nominating and Corporate Governance Committee and as a member of the Risk Committee.
Melina E. Higgins, former Partner at The Goldman Sachs Group.
Ms. Higgins retired in 2010 from a nearly 20-year career at The Goldman Sachs Group Inc., where she served as a Managing Director from 2001 and a Partner from 2002. During her tenure at Goldman Sachs, Ms. Higgins served as Head of the Americas and Co-Chairperson of the Investment Advisory Committee for the GS Mezzanine Partners funds, which managed over $30 billion of assets. She also served as a member of the Investment Committee for the Principal Investment Area, which oversaw and approved global private equity and private debt investments. Goldman’s Principal Investment Area was one of the largest alternative asset managers in the world. Ms. Higgins has served as a director of Mylan N.V. since February 2013. Ms. Higgins has also served as non-executive chairman of the board of Antares Midco, Inc. since January 2016 and is a member of the Women’s Leadership Board of Harvard University’s John F. Kennedy School of Government. Ms. Higgins received a B.A. in Economics and Spanish from Colgate University and an M.B.A. from Harvard Business School.
Qualifications: Ms. Higgins’ extensive finance and investment experience, having spent nearly 20 years with The Goldman Sachs Group, Inc., as well as serving as a director for both public and private companies, provides the board with significant insight in connection with our restructuring and turnaround initiatives.
Committees: Ms. Higgins serves as a member of the Management Development and Compensation Committee and the Nominating and Corporate Governance Committee.
Thomas J. McInerney, President and Chief Executive Officer of Genworth Financial, Inc.
Mr. McInerney has been our President and Chief Executive Officer and a director since January 2013. Before joining our company, Mr. McInerney had served as a Senior Advisor to the Boston Consulting Group from June 2011 to December 2012, providing consulting and advisory services to leading insurance and financial services companies in the United States and Canada. From October 2009 to December 2010, Mr. McInerney was a member of ING Groep’s Management Board for Insurance, where he was the Chief Operating Officer of ING’s insurance and investment management business worldwide. Prior to that, he served in a variety of senior roles with ING Groep NV after serving in many leadership positions with Aetna, where he began his career as an insurance underwriter in June 1978. Mr. McInerney is also on the board of the Richmond Performing Arts Alliance. Mr. McInerney is a member of the American Council of Life Insurers and serves, and has served, on its CEO Steering Committees and Board. Mr. McInerney received a B.A. in Economics from Colgate University and an M.B.A. from the Tuck School of Business at Dartmouth College and serves on Tuck’s Board of Advisors.
Qualifications: Mr. McInerney offers insight into our company from his current role as the President and Chief Executive Officer. He also brings extensive knowledge of the insurance and financial services industries gained through 40 years of experience serving in significant leadership positions with Genworth, ING Groep NV and Aetna.
7 Form 10-K/A
|
Part III |
David M. Moffett, former Chief Executive Officer and director of Federal Home Loan Mortgage Corporation.
Mr. Moffett was the Chief Executive Officer and a director of the Federal Home Loan Mortgage Corporation from September 2008 until his retirement in March 2009. Prior to this position, Mr. Moffett served as a Senior Advisor with the Carlyle Group LLC from May 2007 to September 2008. Mr. Moffett also served as the Vice Chairman and Chief Financial Officer of U.S. Bancorp from 2001 to 2007, after its merger with Firstar Corporation, having previously served as Vice Chairman and Chief Financial Officer of Firstar Corporation from 1998 to 2001 and as Chief Financial Officer of StarBanc Corporation, a predecessor to Firstar Corporation, from 1993 to 1998. Mr. Moffett has served as a director of CSX Corporation since May 2015, and PayPal Holdings, Inc. since July 2015 (currently serving as its Lead Director). He also previously served on the boards of directors of CIT Group Inc. from July 2010 to May 2016, eBay Inc. from July 2007 to July 2015, MBIA Inc. from May 2007 to September 2008, The E.W. Scripps Company from May 2007 to September 2008 and Building Materials Holding Corporation from May 2006 to November 2008. Mr. Moffett also serves as a trustee on the boards of Columbia Fund Series Trust I and Columbia Funds Variable Insurance Trust, overseeing approximately 52 funds within the Columbia Funds mutual fund complex. He also serves as a trustee for the University of Oklahoma Foundation. Mr. Moffett holds a B.A. degree in Economics from the University of Oklahoma and an M.B.A. degree from Southern Methodist University.
Qualifications: Mr. Moffett has many years of experience as the chief financial officer of public financial services companies. He also has experience as the chief executive officer of an entity in the housing finance industry, including related public policy experience.
Committees: Mr. Moffett serves as the Chair of the Management Development and Compensation Committee and as a member of the Nominating and Corporate Governance Committee.
Thomas E. Moloney, former Senior Executive Vice President and Chief Financial Officer of John Hancock Financial Services, Inc.
Mr. Moloney served as the interim Chief Financial Officer of MSC—Medical Services Company (“MSC”) from December 2007 to March 2008. He retired as the Senior Executive Vice President and Chief Financial Officer of John Hancock Financial Services, Inc. in December 2004. He had served in this position since 1992. Mr. Moloney served in various roles at John Hancock Financial Services, Inc. during his tenure from 1965 to 1992, including Vice President, Controller, and Senior Accountant. Mr. Moloney has served as a director of SeaWorld Entertainment, Inc. since January 2015. He also previously served as a director of MSC from 2005 to 2012 (MSC was acquired in 2012 and ceased to be a public company in 2008). Mr. Moloney is on the boards of Nashoba Learning Group and the Boston Children’s Museum (past Chairperson), both non-profit organizations. Mr. Moloney received a B.A. in Accounting from Bentley University and holds a Silver Level Executive Masters Professional Director Certification from the Corporate Directors Group.
Qualifications: Mr. Moloney provides almost 40 years of insurance industry and accounting experience, including having served as the chief financial officer of a public insurance company. He provides extensive knowledge of accounting and finance in regard to insurance products as well as risk assessment and risk oversight.
Committees: Mr. Moloney serves as the Chair of the Risk Committee and as a member of the Audit Committee.
Debra J. Perry, former Executive at Moody’s Investors Service, Inc.
Ms. Perry worked at Moody’s Corporation from 1992 to 2004. From 2001 to 2004, Ms. Perry was a senior managing director in the Global Ratings and Research Unit of Moody’s Investors Service, Inc. where she oversaw the Americas Corporate Finance and U.S. Public Finance Groups. From 1999 to 2001, Ms. Perry served as Chief Administrative Officer and Chief Credit Officer, and from 1996 to 1999, she was a group managing director for the Finance, Securities and Insurance Rating Groups of Moody’s Corporation. Ms. Perry has served as a director of Assurant, Inc., a provider of risk management solutions, since August 2017 and Korn/Ferry International, a talent management and executive search firm, since 2008. She has also served as a director of The Bernstein Funds (which currently oversees the Sanford C. Bernstein Fund,
Genworth Financial, Inc. 8
|
Part III |
the Bernstein Fund and the Alliance Multi-Manager Alternative Fund) since July 2011 and has served as chair since July 2018. She was a member of the board of PartnerRe, a Bermuda-based reinsurance company, from June 2013 to March 2016. She was also a trustee of the Bank of America Funds from June 2011 until April 2016. Ms. Perry served on the board of directors of CNO Financial Group, Inc. from 2004 to 2011. In 2014, Ms. Perry was named to the National Association of Corporate Directors’ Directorship 100, which recognizes the most influential people in the boardroom and corporate governance community. From September 2012 to December 2014, Ms. Perry served as a member of the Executive Committee of the Committee for Economic Development (“CED”) in Washington, D.C. a non-partisan, business-led public policy organization, until its merger with the Conference Board, and she continues as a member of CED. Ms. Perry received her B.A. in History from the University of Wisconsin and her M.A. in European History from Yale University.
Qualifications: Ms. Perry brings extensive knowledge of corporate governance as a result of her many years of board and board committee experience, including service on multiple audit committees, two of which she has chaired. Ms. Perry also has significant experience in executive management at a Nationally Recognized Statistical Rating Organization, or “NRSRO,” where she oversaw the financial analysis and assignment of credit and financial strength ratings to financial and industrial companies and public sector entities, including the global insurance industry.
Committees: Ms. Perry serves as a member of the Audit Committee and the Risk Committee.
Robert P. Restrepo Jr., former Chairman and President and Chief Executive Officer of State Auto Financial Corporation.
Mr. Restrepo retired from State Auto Financial Corporation in 2015, having served as its Chairman from 2006 to December 2015 and as its President and Chief Executive Officer from 2006 to May 2015. Mr. Restrepo has over 40 years of insurance industry experience, having held executive roles at Main Street America Group, Hanover Insurance Group Inc. (formerly Allmerica Financial Corp), Travelers and Aetna. Mr. Restrepo has served as a director of Majesco, a provider of insurance software and consulting services, since August 2015, and RLI Corp., a property and casualty insurance company, since July 2016. Mr. Restrepo also currently serves on the boards of directors of The Larry H. Miller Group of Companies and Nuclear Electric Insurance Limited. Mr. Restrepo received a B.A. in English from Yale University.
Qualifications: Mr. Restrepo offers over 40 years of experience managing and operating insurance companies and has expertise in corporate governance, acquisitions, risk, strategic planning and leadership development.
Committees: Mr. Restrepo serves as the Chair of the Audit Committee and as a member of the Management Development and Compensation Committee.
James S. Riepe, Senior Advisor and former Vice Chairman of T. Rowe Price Group, Inc. Lead Director from February 2009 to May 2012 and Non-Executive Chairman of the Board since May 2012.
Mr. Riepe is a retired Vice Chairman and a Senior Advisor at T. Rowe Price Group, Inc. Mr. Riepe served as the Vice Chairman of T. Rowe Price Group, Inc. from 1997 until his retirement in December 2005. Prior to joining T. Rowe Price Group, Inc. in 1981, Mr. Riepe was an Executive Vice President of The Vanguard Group. He has served as a director of LPL Financial Holdings Inc. since February 2008. Mr. Riepe also previously served on the boards of directors of The NASDAQ OMX Group, Inc. from May 2003 to May 2014, T. Rowe Price Group, Inc. from 1981 to 2006 and 57 T. Rowe Price registered investment companies (mutual funds) until his retirement in 2006. He is an Emeritus member of the University of Pennsylvania’s Board of Trustees and Trustee of Penn Medicine. Mr. Riepe received a B.S. in Industrial Management, M.B.A. and Honorary Doctor of Laws degree from the University of Pennsylvania.
Qualifications: Mr. Riepe brings to the Board significant expertise in finance and investments, as well as extensive management and operating experience, gained through his role as a senior executive in the investment management industry, including 23 years with T. Rowe Price.
Committees: Mr. Riepe is a member of the Audit Committee and the Management Development and Compensation Committee.
9 Form 10-K/A
|
Part III |
Corporate Governance
Governance Principles
Our Governance Principles are published on our website, as are our other corporate governance materials, including the charters adopted by the Board for each of our standing committees and any key practices adopted by the committees. To view these materials, go to www.genworth.com, select “Investors” and then select “Corporate Governance.” The Board regularly reviews corporate governance developments and may modify these principles, charters and key practices as warranted. Any modifications will be reflected in the documents on our website.
Code of Business Conduct and Ethics
All of our directors, officers and employees, including our principal executive officer, principal financial officer and principal accounting officer, must act ethically at all times and in accordance with the policies comprising our code of business conduct and ethics set forth in Genworth’s Code of Ethics (“Code of Ethics”). If an actual or potential conflict of interest arises for a director, the director shall promptly inform the chief executive officer. To view our Code of Ethics, go to www.genworth.com, select “Investors,” then select “Corporate Governance,” then select “Code of Business Conduct & Ethics” and finally select “Genworth Code of Ethics.” Section 11 of our Governance Principles, which are available on our website, more fully addresses our Code of Ethics. Under our Governance Principles, the Board will not permit any waiver of any ethics policy for any director or executive officer. Within the time period required by the SEC and the NYSE, we will post on our website any amendment to our Code of Ethics.
Communication with Genworth’s Board of Directors
The Board of Directors has established a process for stockholders and other interested persons to communicate directly with Genworth and its non-management directors. Information regarding this process, including how to email or write our non-management directors, may be found on our website. To view this process, go to www.genworth.com, select “Investors,” then select “Corporate Governance” and finally select “Contact the Board.” Concerns relating to accounting, internal accounting controls and auditing matters may also be submitted confidentially and anonymously through the methods specified on our website. You may direct your communications to our non-management directors as a group or individually, or to any committee of the Board of Directors. The Corporate Secretary or Genworth’s ombudsperson monitors, reviews and sorts all written communications to the non-management directors. Communications related to matters that are within the scope of the responsibilities of the Board of Directors are forwarded to the Board of Directors, the relevant committee of the Board or an individual director, as appropriate.
The Corporate Secretary or Genworth’s ombudsperson forwards correspondence related to routine business and customer service matters to the appropriate management personnel. The Corporate Secretary or Genworth’s ombudsperson will immediately consult with the Audit Committee Chairman, who will determine whether to communicate further with the Audit Committee and/or the full Board of Directors with respect to the correspondence received relating to accounting, internal accounting controls, auditing matters or officer conduct.
Letters may be sent to the non-management directors as a group or individually, c/o the Corporate Secretary, Genworth Financial, Inc., 6620 West Broad Street, Building #1, Richmond, Virginia 23230.
Board of Directors and Committees
Board Composition
Our Board of Directors is composed of individuals with diverse experience at policy-making levels in business and government in areas that are relevant to the company. Each director was nominated on the basis of the unique set of qualifications and skills he or she brings to the Board, as well as how those qualifications and skills blend with those of the other members of the Board as a whole. The blend of our directors’ diverse backgrounds ensures that issues facing the company are examined and addressed with the benefit of a broad array of perspectives and expertise.
Genworth Financial, Inc. 10
|
Part III |
We believe that our directors have demonstrated leadership in a variety of positions across various professions and industries. Their experiences, qualifications, attributes and skills include:
Independent Director Experiences, Qualifications, Attributes and Skills
 |
 |
 |
 |
 |
 |
 | ||
 |
Chief Executive Officer Experience |
✓ | ✓ | |||||
 |
Chief Financial Officer Experience |
✓ | ✓ | |||||
 |
Insurance |
✓ | ✓ | ✓ | ✓ | |||
 |
Mortgage |
✓ | ||||||
 |
Risk |
✓ | ✓ | ✓ | ✓ | ✓ | ||
 |
Mergers & Acquisitions |
✓ | ✓ | ✓ | ✓ | ✓ | ✓ | |
 |
Finance and Investment Management |
✓ | ✓ | ✓ | ✓ | ✓ | ||
 |
Healthcare/Medical |
✓ | ✓ | |||||
 |
Consumer Marketing |
✓ | ||||||
 |
Distribution |
✓ | ✓ | ✓ | ||||
 |
Public Policy/Political |
✓ | ✓ | ✓ | ||||
 |
Public Company Board Experience |
✓ | ✓ | ✓ | ✓ | ✓ | ✓ | ✓ |
 |
Technology/IT |
✓ | ✓ | |||||
 |
Restructuring and Turnaround |
✓ | ✓ | ✓ | ||||
 |
Asset Management |
✓ | ✓ | ✓ | ✓ | |||
 |
International |
✓ | ✓ | ✓ | ✓ | ✓ |
See the Our Board of Directors section above for a description of each director’s complete biographical information, qualifications and skills.
11 Form 10-K/A
|
Part III |
Subject to the rights of the holders of any outstanding series of our preferred stock, our certificate of incorporation provides that the number of authorized directors of our company will be fixed from time to time by a resolution adopted by our Board of Directors, but will not be less than one nor more than fifteen. Our Governance Principles further state that the size of the Board should be in the range of seven to 15 directors. Our Board of Directors has set the size of the Board of Directors at eight members, but continues to evaluate the optimal size for the Board and may consider the addition of one or more independent directors to the Board in the future.
Our Governance Principles provide that directors who serve as chief executive officers or in equivalent positions for other public companies should not serve on more than two other boards of public companies in addition to the Genworth Board and other directors should not serve on more than four other boards of public companies in addition to the Genworth Board.
Board Committees
The four standing committees of the Board are the Audit Committee, Management Development and Compensation Committee, Nominating and Corporate Governance Committee and Risk Committee. These committees are described below. The Board has established written charters for each of its four standing committees. Our Board of Directors may also establish various other committees from time-to-time to assist it in carrying out its responsibilities.
Audit Committee
The Board has established the Audit Committee in accordance with Section 3(a)(58)(A) of the Exchange Act. The Audit Committee consists solely of “independent” directors as defined by the applicable rules of the NYSE and the SEC and by our Governance Principles. In addition, the Board has determined that all four of the Audit Committee’s current members, Messrs. Moloney, Restrepo and Riepe and Ms. Perry, are “audit committee financial experts,” as defined by SEC rules.
As more fully set forth in its charter, which can be found in the corporate governance section of our website (to view, go to www.genworth.com, select “Investors,” then select “Corporate Governance,” then select “Audit Committee” and finally select “Charter”), the purpose of the Audit Committee is to assist the Board in its oversight of the integrity of the company’s financial statements, the company’s compliance with legal and regulatory requirements, the independence and qualifications of the company’s independent registered public accounting firm and the performance of the company’s internal audit function and independent auditors. The Audit Committee’s duties include:
| ● | discussing with management and our independent registered public accounting firm our annual and quarterly financial statements, earnings releases and financial information and earnings guidance provided to analysts and rating agencies; |
| ● | selecting our independent registered public accounting firm and approving the terms of its engagement; |
| ● | discussing with management and our independent registered accounting firm any audit problems or difficulties and management’s response; |
| ● | independently and/or in coordination with the Risk Committee, overseeing risks associated with financial accounting and reporting, including the system of internal control, which includes reviewing and discussing with management and our independent registered public accounting firm the company’s risk assessment process and management policies with respect to the company’s major financial risk exposure and the procedures utilized by management to identify and mitigate the exposure to such risks; |
| ● | reviewing our financial reporting and accounting standards and principles; |
| ● | reviewing our internal system of financial controls and the results of internal audits; |
| ● | obtaining and reviewing formal written reports from the independent registered public accounting firm regarding its internal quality-control procedures; |
| ● | reviewing and investigating any matters pertaining to the integrity of management, including conflicts of interest, or adherence to standards of business conduct; |
Genworth Financial, Inc. 12
|
Part III |
| ● | preparing and publishing a committee report; |
| ● | establishing procedures for the hiring of employees or former employees of our independent registered public accounting firm; |
| ● | establishing procedures for the receipt, retention and treatment of complaints on accounting, internal accounting controls or auditing matters; and |
| ● | establishing policies and procedures for the review and approval of all proposed transactions with “Related Persons,” as that term is defined in Section 11(b) of our Governance Principles. |
The Audit Committee has determined that in view of the increased demands and responsibilities of the committee, its members generally should not serve on more than two additional audit committees of other public companies.
Management Development and Compensation Committee
The Management Development and Compensation Committee (the “Compensation Committee”) consists solely of “independent” directors as defined by the applicable rules of the NYSE and by our Governance Principles. As more fully set forth in its charter, which can be found in the corporate governance section of our website (to view, go to www.genworth.com, select “Investors,” then select “Corporate Governance,” then select “Management Development and Compensation Committee” and finally select “Charter”), the Compensation Committee’s responsibilities include:
| ● | reviewing and approving on an annual basis the corporate goals and objectives with respect to the compensation of our Chief Executive Officer (“CEO”), evaluating our CEO’s performance in light of these goals and objectives and setting our CEO’s compensation based on such evaluation; |
| ● | reviewing and approving on an annual basis the evaluation process and compensation structure for our other officers, including evaluating and setting the compensation for our senior executive officers; |
| ● | reviewing and approving our variable incentive compensation and other stock-based compensation plans; |
| ● | assisting the Board in developing and evaluating potential candidates for executive positions and overseeing the development of succession plans; |
| ● | assessing the structure and composition of the leadership of the company; |
| ● | reviewing and discussing our Compensation Discussion and Analysis, recommending to the Board its inclusion in our annual reports and proxy statements and publishing a committee report; |
| ● | overseeing risks relating to our compensation programs; and |
| ● | determining whether the work of any compensation consultant who had a role in determining or recommending the amount or form of executive or director compensation raised any conflict of interest. |
Under its charter, the Compensation Committee has authority to delegate any of its responsibilities to subcommittees as the Compensation Committee may deem appropriate in its sole discretion. The Compensation Committee’s report appears in Item 11 of this Amendment. Additional information regarding the Compensation Committee’s processes and procedures for consideration of executive compensation is also provided in Item 11— Compensation Discussion and Analysis section below.
Nominating and Corporate Governance Committee
The Nominating and Corporate Governance Committee (the “Nominating Committee”) consists solely of “independent” directors as defined by the applicable rules of the NYSE and by our Governance Principles. As more fully set forth in its charter, which can be found in the corporate governance section of our website (to view, go to www.genworth.com, select “Investors,” then select “Corporate Governance,” then select “Nominating and Corporate Governance Committee” and finally select “Charter”), the Nominating Committee’s responsibilities include:
| ● | leading the search for individuals qualified to become members of our Board; |
| ● | reviewing the Board’s committee structure and recommending committee members; |
| ● | developing and annually reviewing our Governance Principles; |
13 Form 10-K/A
|
Part III |
| ● | overseeing the annual self-evaluations of the Board and its committees; |
| ● | overseeing risks related to corporate governance; |
| ● | reviewing annually director compensation and benefits; and |
| ● | periodically reviewing the environmental, social and governance practices of the company. |
The Nominating Committee makes recommendations to the Board of Directors of candidates for election to our Board, and our Board of Directors nominates director candidates and makes recommendations to our stockholders. This committee will consider all stockholder recommendations for candidates for the Board, which should be sent to the Nominating and Corporate Governance Committee, c/o Corporate Secretary, Genworth Financial, Inc., 6620 West Broad Street, Building #1, Richmond, Virginia 23230.
The Nominating Committee believes all director nominees should meet certain qualifications and possess certain qualities or skills that, when considered in light of the qualities and skills of the other director nominees, assist the Board in overseeing our operations and developing and pursuing its strategic objectives. The Nominating Committee believes each director nominee should at a minimum:
| ● | possess the highest personal and professional ethics, integrity and values; |
| ● | be committed to representing the long-term interests of our stockholders; |
| ● | have an inquisitive and objective perspective, practical wisdom and mature judgment; |
| ● | bring a distinct skill set of value to the Board and the company when viewed alone and in combination with other directors; |
| ● | be willing and able to devote sufficient time to carrying out his or her duties and responsibilities effectively; and |
| ● | be committed to serve on the Board for an extended period of time. |
The Nominating Committee, as a matter of practice, takes diversity factors into account when considering potential director nominees. The company does not have a formal policy on Board diversity. The qualifications, qualities and skills required for directors are further set forth in Section 3 of Genworth’s Governance Principles, which are available on our website.
In addition to considering candidates suggested by stockholders, the Nominating Committee considers potential candidates recommended by current directors, company officers, employees and others. The Nominating Committee has also engaged an outside search firm to assist in identifying and evaluating potential director candidates. The Nominating Committee considers all potential candidates regardless of the source of the recommendation and determines whether potential candidates meet our qualifications, qualities and skills for directors. Where there is an interest in a particular candidate, the Nominating Committee’s review is multi-faceted and typically includes a review of written materials regarding the candidate, due diligence performed internally and externally, a review of a completed candidate questionnaire and one or more interviews with members of the Nominating Committee.
The Nominating Committee is also responsible for reviewing periodically the nature and amount of our political contributions, the operations of our Political Action Committee and our public disclosure regarding such activities. In addition, the Nominating Committee periodically reviews our policies and practices on matters of corporate citizenship, including philanthropic programs and financial and other support of charitable, education and cultural organizations.
Genworth Financial, Inc. 14
|
Part III |
Risk Committee
The purpose of the Risk Committee is to assist the Board in its oversight of all areas relating to Genworth’s enterprise risk management policies and the related risk profiles, including, but not limited to, the following major risk exposures: credit risks; market risks; insurance risks; housing risks; operational risks; model risks; information technology risks; and any other risk that poses a material threat to the viability of the company.
As more fully set forth in its charter, which can be found in the corporate governance section of our website (to view, go to www.genworth.com, select “Investors,” then select “Corporate Governance,” then select “Risk Committee” and finally select “Charter”), the Risk Committee’s responsibilities include:
| ● | reviewing and recommending annually for Board approval (i) the company’s enterprise risk management policies and (ii) the risk appetite of the company, and to oversee the implementation and maintenance of such policies and appetite; |
| ● | receiving regular reports on the efforts to implement and comply with regulatory requirements related to risk management; |
| ● | reviewing and overseeing the control, management and mitigation processes relating to Genworth’s enterprise risk management policies and risk appetite; |
| ● | reviewing Genworth’s ability to assess and manage significant and emerging risks; |
| ● | reviewing and analyzing Genworth’s major risk exposures, strategies, processes, and policies, with accompanying stress tests; |
| ● | reviewing and overseeing Genworth’s internal risk function; |
| ● | periodically reviewing and overseeing Genworth’s compliance processes and policies; |
| ● | periodically reviewing and overseeing Genworth’s information technology and information security systems, processes and policies, with a presentation on this topic to the full Board at least annually; |
| ● | receiving reports regarding risks associated with litigation and investigations/regulatory matters involving the company; and |
| ● | discussing with management the company’s overall investment portfolio and investment strategies. |
15 Form 10-K/A
|
Part III |
| Item 11. | Executive Compensation |
Report of the Management Development and Compensation Committee
The Management Development and Compensation Committee of the Board of Directors oversees the compensation programs of Genworth Financial, Inc. on behalf of the Board. In fulfilling its oversight responsibilities, the committee reviewed and discussed with management the Compensation Discussion and Analysis included in this document.
In reliance on the review and discussion referred to above, the Management Development and Compensation Committee recommended to the Board of Directors that the Compensation Discussion and Analysis be included in Genworth’s Form 10-K for the fiscal year ended December 31, 2019, which has been or will be filed with the U.S. Securities and Exchange Commission.
This report shall not be deemed to be incorporated by reference by any general statement incorporating by reference into any filing under the Securities Act of 1933, as amended, or the Securities Exchange Act of 1934, as amended, and shall not otherwise be deemed filed under such acts. This report is provided by the following independent directors, who constitute the committee:
David M. Moffett, Chair
Melina E. Higgins
Robert P. Restrepo Jr.
James S. Riepe
Genworth Financial, Inc. 16
|
Part III |
Compensation Discussion and Analysis
Named Executive Officers
This section provides an overview and analysis of our compensation programs and policies, including the material compensation decisions made under the programs with respect to the following executive officers, whom we refer to as our “named executive officers” or “NEOs:”
 |
 |
 |
| Thomas J. McInerney | Kelly L. Groh | Kevin D. Schneider |
| President and | Executive Vice President | Executive Vice President |
| Chief Executive Officer (“CEO”) | and Chief Financial Officer (“CFO”) | and Chief Operating Officer (“COO”) |
 |
 |
| Ward E. Bobitz | Daniel J. Sheehan IV |
| Executive Vice President | Executive Vice President |
| and General Counsel | and Chief Investment Officer |
| (“General Counsel”) | (“CIO”) |
17 Form 10-K/A
|
Part III |
2019 Company Performance
We aligned named executive officer incentives in 2019 with the execution of financial and other strategic initiatives that would improve our operating performance, enable strategic flexibility of our life and long-term care (“LTC”) insurance businesses, and increase returns in our mortgage insurance businesses. We met or exceeded key operational, strategic and financial objectives for 2019 across many of our businesses.
Our operating performance in 2019, as well as our trailing three-year performance, have directly impacted our named executive officer compensation, as follows:
| Key Annual Performance Objectives |
 |
Above Target |
The U.S. mortgage insurance business significantly exceeded goals for adjusted operating income and operating ROE The U.S. Life Insurance business exceeded goals related to risk-based capital and statutory pre-tax income targets |
| Key Annual Strategic Objectives |
|
Above Target |
Successfully completed the sale of Canadian mortgage insurance business, enabling progress towards the completion of the China Oceanwide transaction The U.S. mortgage insurance business significantly exceeded goals for adjusted business growth, capital management, and new business pricing returns |
| Long-Term Financial Objectives |
|
At Maximum |
Our 2017-2019 performance stock unit (“PSU”) awards payout was driven by strong mortgage insurance performance and LTC in-force management |
Highlights from our key performance results for 2019:
| Mortgage Insurance | U.S. Life Insurance |
|
●We significantly exceeded both financial and strategic objectives for our U.S. mortgage insurance business, including our targets for adjusted operating income, operating ROE, business growth, capital management, and new business pricing returns;
●Our Australia mortgage insurance business met its strategic objectives and its financial objectives with respect to capital management and new business growth, but underachieved its financial objective for adjusted operating income; and
●Our Canada mortgage business overall slightly underachieved its financial objectives and exceeded its strategic objectives in 2019 prior to its disposition in December 2019. We included the performance of the Canada mortgage insurance business in 2019 up to the point of disposition in our NEO performance results. |
●We exceeded our internal targets for premium rate increase filings and approvals on our unprofitable legacy blocks of LTC insurance in execution of our multi-year rate action filing plan;
●We exceeded our internal goals with respect to our U.S. statutory risk-based capital and long-term care insurance statutory pre-tax income targets; and
●We met or exceeded targets for operational goals, including product development goals, actuarial initiatives, and preparations for the close of the Oceanwide transaction. |
| Corporate and Other | |
|
●We had strong investment portfolio performance, exceeding our internal goals for net investment income, purchase yield, asset production, and impairments and trading losses for the year.
●We successfully completed the sale of our Canadian mortgage insurance business, generating $1.7 billion net proceeds and enabling progress towards the completion of the Oceanwide transaction.
| |
Genworth Financial, Inc. 18
|
Part III |
2019 Compensation Program Highlights
As previously disclosed in the 2019 Annual Proxy Statement, the Compensation Committee made a number of changes to our compensation programs and disclosure based on feedback received during the stockholder engagement process. In 2019, our Compensation Committee chair, Mr. David Moffett, reached out to our largest institutional stockholders, which represented in aggregate approximately 60% of our outstanding shares, to solicit their input on our compensation programs.
In addition, beginning with the 2019 Annual Proxy Statement, the Compensation Discussion and Analysis section was expanded to include specific annual incentive payout metrics and weightings for each NEO. See pages 27-29.
The following highlights key design and disclosure elements:
| ● | Eliminated time-based awards from the CEO pay program and transitioned target CEO long-term award values to 100% performance stock unit grants starting in 2019 |
| ● | Starting with the 2019 performance stock unit grant, the performance will be measured over a three-year cumulative period instead of three separate one-year measurement periods |
| ● | As we continue to believe a successful completion of the Oceanwide transaction is in the best interest of our stockholders and our company, the Compensation Committee will continue to consider all aspects of the Oceanwide transaction when reviewing short- and long-term incentive pay performance to ensure that both company financial performance and transaction related activities are incentivized and recognized |
Consideration of Last Year’s Advisory Stockholder Vote on Executive Compensation
Annual advisory votes to approve named executive officer compensation serve as a tool to help guide the Compensation Committee in evaluating the alignment of the company’s executive compensation programs with the interests of the company and our stockholders. In preparation for the 2019 advisory vote, we contacted many of our institutional stockholders in the fall of 2019 for their input on the company’s compensation and governance practices, and to address their questions. At the 2019 Annual Meeting, over 88% of the shares voted were cast in favor of the compensation paid to the named executive officers in 2018, as discussed and disclosed in the 2019 Annual Proxy Statement.
In considering the results of the 2019 advisory vote to approve named executive officer compensation, which dramatically improved versus the prior year, the Compensation Committee concluded that stockholders viewed the program changes outlined above favorably, and we did not make additional changes to our compensation programs directly in response to the 2019 advisory vote.
The Committee will continue to seek stockholder feedback in 2020 regarding its compensation programs.
Compensation Philosophy
Our objective in compensating executive officers is to attract, retain and motivate employees of superior ability who are dedicated to the long-term interests of our stockholders.
It is important to note that as a result of the transaction with Oceanwide, we believe our stock price has been effectively capped at the merger consideration of $5.43 per share, which limits both stockholder return and gains on equity awards provided to executives. Additionally, challenges from our legacy long-term care insurance blocks of business (underwritten or assumed from 1974 to 2007) have materially impaired the financial performance and stockholder value of the company, making it difficult to fully align executive pay with stockholder value.
19 Form 10-K/A
|
Part III |
The following principles guide our compensation program design and individual compensation decisions. Additionally, we have highlighted below key elements of our compensation programs or policies for named executive officers that illustrate how we support these principles in practice:
|
Our Guiding Principles |
Examples of Programs or Policies That Support Our Principles | |
|
Compensation should be primarily performance-based and align executive officer incentives with stockholder interests across multiple timeframes. |
●Annual incentives (short-term performance-based awards)
●Annual grants of long-term incentives to NEOs including equity-based PSUs (vest based on company performance after three years), restricted stock units (long-term stock appreciation with an emphasis on retention), and performance-based cash (vest based on company performance after three years) | |
|
At-risk pay and compensation design should reflect an executive officer’s impact on company performance over time. |
●A majority of annual compensation of our NEOs is completely at risk
●Our CEO has 86% of total target pay linked to company performance, through PSUs and annual incentives for 2019
●Our other NEOs have an average of 79% of total target pay linked to company performance through PSUs, restricted stock units (“RSUs”), and annual incentives for 2019
●Annual long-term incentive grants constitute the largest component of target compensation for NEOs | |
|
Total compensation opportunities should be competitive within the relevant marketplace. |
●Our compensation benchmarking approach, as described below, and annual review of the composition of our peer group | |
|
Our incentive compensation should reward financial and operational performance and allow for qualitative assessment. |
●In determining annual incentive awards, the Compensation Committee measures performance against specific financial objectives for the person’s area of responsibility, together with a qualitative assessment of operational performance and other results
●As noted above, this qualitative assessment is particularly important because of the significant impact on the performance of the company caused by the legacy LTC insurance blocks of business
●Our long-term equity- and cash-based performance awards reward achievement of specific longer-term company objectives | |
|
Plan designs and incentives should support appropriate risk management practices. |
●Executive officer stock ownership guidelines for our CEO (7x salary), our COO, CFO and CIO (3x) and for our other Executive Vice Presidents or Senior Vice Presidents (2x)
●50% retention ratio for net after-tax shares received from the vesting or exercise of all equity incentive awards until executive officers’ stock ownership guidelines are met, ensuring significant personal assets are aligned with long-term stockholder interests
●Exercises of previously awarded stock options and SARs are settled in stock and are subject to a nine-month net hold requirement
●Clawback, anti-hedging and anti-pledging policies |
Genworth Financial, Inc. 20
|
Part III |
Key Governance Practices
| ✓ |
Annual Advisory Approval of Executive Compensation |
| ✓ |
Use of Performance-Based Long-Term Incentives |
| ✓ |
Stock Ownership Requirements for Executive Officers (including CEO), as a Multiple of Base Salary |
| ✓ |
Retention Requirements for Equity Awards |
| ✓ |
Clawback Policy |
| ✓ |
Double-Trigger for Change of Control Benefits |
| ✓ |
No Excise Tax Gross-Ups for Change of Control Benefits |
Compensation Decision-Making Process
How We Determine Program Design
Role of Management and Compensation Consultants
Our CEO and Executive Vice President—Human Resources regularly attend meetings of the Compensation Committee to provide analysis, details and recommendations regarding the company’s executive compensation programs and plan design. During full Board meetings, members of the Compensation Committee also receive business performance and strategy updates that align with compensation incentive goals from other members of senior management. Our CEO provides the Compensation Committee with performance assessments and compensation recommendations in his role as a manager for individual named executive officers (other than himself). The Compensation Committee, typically in the first quarter of each year, then determines and approves annual incentive award payouts for the prior year, any adjustments to base salary, target annual incentives for the upcoming year, and awards of long-term incentives to executive officers. For more information on the compensation decisions made in 2019, see the Compensation Program Elements section below.
The Compensation Committee has retained Steven Hall & Partners, LLC, an independent compensation consultant, to assist in reviewing and analyzing compensation data for our CEO and other named executive officers. The compensation consultant regularly attends Compensation Committee meetings and meets with the Compensation Committee in executive session without management present. The Compensation Committee occasionally requests special studies, assessments of market trends and education regarding changing laws and regulations from the compensation consultant to assist the Compensation Committee in its decision-making processes for the CEO and other executive officers. The compensation consultant provides the Compensation Committee with advice, but does not determine the amount or form of compensation for our named executive officers. In 2019, the Compensation Committee assessed the independence of the compensation consultant and other advisors pursuant to SEC rules and concluded that no conflict of interest exists that would prevent the compensation consultant or other advisors from independently advising the Compensation Committee.
Role of the Compensation Committee
The Compensation Committee seeks a collaborative relationship with management, and currently uses an independent third-party compensation consultant to provide for a more informed decision-making process and objective perspective in this important governance matter. The Compensation Committee facilitates the annual review process of CEO performance and compensation decisions, with input from the Board and support of their independent compensation consultant. The Compensation Committee regularly meets in executive session without management present and retains the final authority to approve all compensation policies, programs and amounts paid to our named executive officers.
21 Form 10-K/A
|
Part III |
Benchmarking
We generally evaluate market competitiveness of our programs as an input into the process of designing plans and setting target compensation levels for named executive officers. We review each component of compensation for our named executive officers separately and in the aggregate, and also consider the internal relationships among the named executive officers to help determine appropriate pay levels. With respect to individual named executive officers, we compare the total target compensation opportunities for our named executive officers to target opportunities for similar positions at comparable companies. These benchmarks are a gauge for evaluating market competitiveness, but are not given greater weight than other key factors when making compensation decisions. For example, individual named executive officers may have higher or lower target compensation levels compared to market medians based on level of responsibility, individual experience and skills, performance trends, competitive dynamics, retention needs and internal equity considerations.
The Compensation Committee typically utilizes a combination of publicly available information related to a specific list of peer companies (the “Peer Group”), as well as information available through market compensation surveys to provide a broad perspective of market practice. While no individual company matches our lines of business precisely, the Peer Group is intended to represent, in the aggregate, companies with revenue sources and talent demands similar to the company. With respect to size, we generally look at revenue or total assets as indicators of comparability rather than market capitalization due to our legacy LTC insurance business and the potential for volatility year over year as stock prices change. The companies included in market surveys used by the company are not individually identifiable for a particular executive position (and therefore we are not benchmarking against any particular company within the survey), and also may change from year-to-year based on voluntary participation in the market surveys we use, mergers and divestitures, or changes in corporate structure.
To the extent we make changes to our business portfolio, or as peer companies adjust their own business lines or distribution channels, we will consider adding peers, or removing peers which no longer have revenue sources and talent demands similar to ours. The Compensation Committee will consider advice and recommendations developed by its compensation consultant to support our benchmarking principles. The Peer Group used when considering 2019 compensation actions was composed of the following companies:
|
Aflac, Inc. |
|
American Financial Group, Inc. |
|
Assurant, Inc. |
|
CNA Financial Corporation, |
|
CNO Financial Group, Inc. |
|
Fidelity National Financial |
|
First American Financial Corporation |
|
Hanover Insurance Group |
|
Lincoln National Corporation |
|
MGIC Investment Corporation |
|
Principal Financial Group, Inc. |
|
Radian Group |
|
Reinsurance Group of America, Inc. |
|
Unum Group |
The compensation consultant supported the Compensation Committee’s evaluation of the peer group to be used for benchmarking purposes and recommended no changes to the group. In 2019, and following determination of 2019 compensation for our named executive officers, our Compensation Committee reviewed our Peer Group and determined that no changes were needed as it is appropriate based on company size, sources of revenue and sources of talent.
Impact of Oceanwide Transaction on 2019 Executive Compensation
While we acknowledge the length of the pending transaction with Oceanwide is unusual because of unanticipated regulatory delays, our Board of Directors continues to believe that completion of this transaction is the best strategic outcome for Genworth and its stockholders. Our continued work toward closing the merger with Oceanwide has taken considerable effort and resources to obtain the various regulatory approvals necessary to consummate the transaction. Our compensation programs have continued to include incentives that encourage the achievement of metrics that will provide long-term value to Genworth, but we have also provided incentives to encourage the closing of the Oceanwide transaction as soon as possible despite geopolitical uncertainty.
Genworth Financial, Inc. 22
|
Part III |
The Merger Agreement with Oceanwide does not include any special compensation awards for any named executive officer. No cash payments or acceleration of equity awards will be triggered for executive officers based solely on the closing of the Oceanwide transaction(1). Outstanding equity awards held by executive officers immediately prior to the closing of the Oceanwide transaction will be automatically converted into the right to receive a cash payment equal to $5.43 per share, but will remain subject to their existing vesting schedule. For further information regarding executive compensation in connection with the Oceanwide transaction, see our proxy statement for the special meeting of stockholders held on March 7, 2017, which was filed on January 25, 2017.
| (1) |
This Compensation Discussion and Analysis, as well as certain compensation disclosures included in this Amendment, are presented without regard to the terms of the Oceanwide Transaction. For further information regarding the terms, conditions and interests of certain persons under the Oceanwide Transaction, see our proxy statement for the special meeting of stockholders held on March 7, 2017, which was filed on January 25, 2017. |
Key Compensation Program Elements
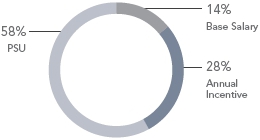
Our 2019 annual compensation program for named executive officers consists of the following key elements: base salary, annual incentive, and annual long-term incentive grants (including performance stock units (“PSUs”) for the CEO, and PSUs and restricted stock units (“RSUs”) for all other NEOs). A significant portion of annual compensation of our NEOs is completely at risk.
The below charts reflect the average target compensation mix for the NEOs. Additional details on their compensation elements is described on the following pages.
| 2019 CEO Target Compensation | 2019 Other NEO Target Compensation |
 |
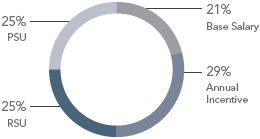 |
Base Salary
Base salaries are generally intended to reflect the scope of an executive officer’s responsibilities and level of experience, reward sustained performance over time and be market competitive. In February 2019, the Compensation Committee undertook its annual review of executive officer base salaries. The Compensation Committee approved a 2% and 5% salary increase for each of Ms. Groh and Mr. Bobitz, respectively, as a continuation of base salary progressions to market competitive levels following their promotions in 2015. The Compensation Committee determined to not make any base salary adjustments for the other named executive officers at that time as the existing base salaries were considered competitive within the marketplace for their roles.
23 Form 10-K/A
|
Part III |
Annual Incentive
In our annual incentive program, we review performance against clear financial objectives, together with a qualitative assessment of operational objectives and other accomplishments toward strategic priorities not necessarily reflected in annual financial results. Each named executive officer has an annual incentive target, expressed as a percentage of base salary. The 2019 target annual incentive opportunities for our named executive officers ranged from 100% to 200% of base salary, and payout opportunities for 2019 ranged from zero to 200% of their individual target amount. Individual annual incentive targets are reported in the 2019 Grants of Plan-Based Awards Table below.
Our annual incentive program is closely aligned with our annual business operating plan, which is reviewed by the Genworth Board of Directors. The Compensation Committee sets performance targets for the annual incentive program that align with achievement of the business operating plan, with above target payouts for exceeding the plan and below target or no payouts for not meeting the plan. When setting the annual business operating plan, many factors and assumptions are considered, such as the competitive landscape, the global economic environment, market trends, interest rates, and regulatory considerations. As a result, performance targets within our annual incentive plan may not always escalate on a yearly basis, and potentially may be set below the previous year’s targets or actual results.
The Compensation Committee determined to not make any adjustments to annual incentive target percentages for 2019 as the existing targets were considered competitive within the marketplace for their roles.
Why Metrics Were Chosen
The financial metrics chosen to measure 2019 performance, which are disclosed later in this document in the individual NEO scorecards, were identified as key drivers of our business operating plans. For example, net operating income (loss) and operating return on equity (ROE) represent key top-level measures of financial performance for our mortgage insurance businesses. In our U.S. life insurance companies, we measured incremental premiums approved for LTC insurance in-force rate actions, operating income metrics, and consolidated risk-based capital targets.
For 2019, the Compensation Committee also established the following key strategic priorities designed to have an impact on company financial performance and stockholder value:
|
Key Strategic Priority |
Rationale |
|
Close Oceanwide Transaction & Transition Execution |
●We signed the Merger Agreement with Oceanwide in October 2016 and have been working diligently to close the transaction
●When brought to the stockholders for approval, over 96% of our voting stockholders approved this transaction
●Completing the transaction has remained our top priority and stockholders have continually expressed their desire to see this transaction completed |
|
Meaningful Progress in Addressing National Association of Insurance Commissioners (“NAIC”) |
●Critical for future of LTC industry and key to on-going solvency of our legacy LTC insurance business to establish procedures and processes for potential future rate increases |
|
Asset Production |
●Effective management of asset purchases critical to obtaining appropriate returns and diversification on the company’s $75 billion investment portfolio |
|
Voluntary Employee Turnover |
●As we work through this period of transition, it is important to maintain stability and engagement within our workforce. |
Genworth Financial, Inc. 24
|
Part III |
How Metrics Performed
| Performance Unit | Key Financial Metrics | Unit | 2019 Target |
2019 Measured Result |
Variance | |||||||||||
| US Mortgage Insurance | U.S. Mortgage Insurance – Net Operating Income | $million | $ | 491 | $ | 569 | $ | 78 | ||||||||
| U.S. Mortgage Insurance – Operating ROE(1) | % | 15.8 | % | 18.0 | % | 220 bps | ||||||||||
| US Life Insurance | GLIC Consolidated Risk Based Capital(2) | % | 165 | % | 213 | % | 48 | % | ||||||||
| LTC in force Statutory pre-tax income metric(3) | $million | $ | 1,170 | $ | 1,317 | $ | 147 | |||||||||
| Gross incremental premiums approved for LTC in-force rate actions(4) | $million | $ | 275 | $ | 334 | $ | 59 | |||||||||
| Canada Mortgage Insurance | Canada Mortgage Insurance – Net Operating Income(5) | CAD | $million | $ | 462 | $ | 466 | $ | 4 | |||||||
| Canada Mortgage Insurance – Operating ROE(5)(6) | % | 12.0 | % | 11.7 | % | (30) bps | ||||||||||
| Australia Mortgage Insurance | Australia Mortgage Insurance – Net Operating Income(7) | AUS | $million | $ | 90 | $ | 77 | $ | (13 | ) | ||||||
| Australia Mortgage Insurance – Return of Capital Above Ordinary Dividends | AUS | $million | $ | 200 | $ | 200 | $ | — | ||||||||
| Investments | Net investment income(8) | $million | $ | 3,325 | $ | 3,357 | $ | 32 | ||||||||
| Total company adjusted U.S. GAAP impairments and trading losses(9) | $million | $ | (40 | ) | $ | 60 | $ | 100 | ||||||||
| U.S. Life Insurance statutory impairments and trading losses and capital/credit migration impact(10) | $million | $ | (130 | ) | $ | (48 | ) | $ | 82 | |||||||
| Purchase yield vs. external benchmark | % | 3.64 | % | 4.07 | % | 43 bps | ||||||||||
| (1) | Operating ROE for our U.S. mortgage insurance business equals adjusted operating income divided by average ending Genworth’s stockholders’ equity attributable to our U.S. mortgage insurance business, excluding accumulated other comprehensive income (loss), for the most recent five quarters. |
| (2) | The GLIC Consolidated Risk Based Capital measures the consolidated U.S. statutory results for Genworth Life Insurance Company (“GLIC”). |
| (3) | The LTC in force statutory pre-tax income measures the impact from in force premium rate actions on the results for GLIC, Genworth Life and Annuity Insurance Company (“GLAIC”) and Genworth Life Insurance Company of New York (“GLICNY”). |
| (4) | This metric measured the weighted-average increase on annualized LTC in-force premiums resulting from rate actions approved in 2019. |
| (5) | We included the performance of the Canada mortgage insurance business in 2019 up to the point of disposition in our NEO performance results. |
| (6) | Operating ROE for our Canada mortgage insurance business equals net operating income (reported under Canadian GAAP), divided by the average of the beginning and ending Genworth’s stockholders’ equity attributable to our Canadian mortgage insurance business, excluding accumulated other comprehensive income (loss). |
| (7) | Adjusted operating income for our Australia mortgage insurance business equals net profit after tax ($97 million) less after-tax realized investment security gains ($20 million) all reported under Australian GAAP. |
| (8) | 2019 measured result for net investment income was adjusted to include $131 million of net investment income from Canada mortgage insurance (included in discontinued operations for 2019) and also translated at planned foreign exchange rates, which decreased net investment income by $7 million. |
25 Form 10-K/A
|
Part III |
| (9) | Total company adjusted U.S. GAAP impairments and trading losses were calculated as follows: |
| (amounts in millions) | |||||
| Net investment gains (losses) | $ | 50 | |||
| Excludes: | |||||
| Losses on derivatives | 72 | ||||
| Foreign exchange impact | 1 | ||||
| Gains on sales of Treasury strips | (35 | ) | |||
| Other mark to market adjustments | (42 | ) | |||
| Canadian gains from trading | 14 | ||||
| Total company adjusted U.S. GAAP impairments and trading losses | $ | 60 |
| (10) | Investment impairments and trading losses are calculated in accordance with statutory accounting rules and the capital/credit migration impact represents statutory risk-based capital impact to U.S. Life Insurance companies from changes in NAIC rating of invested assets shown at a 300% multiple. |
The Compensation Committee took our strategic priorities into account when evaluating the performance of our named executive officers, and consideration was given for the accomplishments in their areas of responsibility. The key strategic priorities, and related accomplishments in 2019, included:
| Key Strategic Priority | 2019 Key Accomplishments/Results | |
| Close Oceanwide Transaction & Transition Execution |
●Following extensive efforts to obtain Canadian regulatory approval for the Oceanwide transaction, the company successfully completed a sale of its Canadian mortgage insurance business, generating $1.7 billion in net proceeds and enabling significant progress toward the completion of the Oceanwide transaction.
●The Committee determined target funding was warranted. | |
| Meaningful Progress in Addressing NAIC LTC Regulatory Framework (for CEO only) |
●Addressed the NAIC Task Force at its inaugural meeting and actively participated in both public hearings and information sessions to educate regulators and members of the public on the company’s current financial outlook, as well as the history, challenges and future potential of the private long-term care insurance market.
●Advocated for consistent, timely rate approvals and individual state accountability, which were instrumental in the formation of the NAIC LTC task force’s restructuring work group.
●Promoted the company’s active participation in the NAIC task force’s preliminary work to explore templates to obtain carrier information for reserve adequacy and other actuarial analyses.
●Secured key regulatory support for the annual re-rate regulatory model, resulting in the submission of a product filing with the Interstate Insurance Product Regulation Commission that will use the annual re-rate framework and is supported by four geographically-diverse states.
●The Committee determined above target funding was warranted. | |
| Asset Production |
●Exceeded asset purchase goals for the USLI, GMI, and strategic asset production targets.
●The Committee determined above target funding was warranted. | |
| Voluntary Employee Turnover (Target US Rate Under 15%) |
●Year-end voluntary turnover rate was approximately 7%
●The Committee determined above target funding was warranted. |
Genworth Financial, Inc. 26
|
Part III |
The Compensation Committee reviewed overall performance results against the applicable objectives in the pre-determined scorecard in determining the actual payouts of annual incentives and also considered the performance of each named executive officer in their respective area of responsibility. After discussion it was determined that each named executive officer would only receive annual incentives based on the achievement of the financial and strategic measures in their respective area of responsibility and no discretion would be employed in making the awards based on other individual performance. Amounts paid for 2019 are reported under the Non-Equity Incentive Plan Compensation—Annual Incentive column of the 2019 Summary Compensation Table.
NEO 2019 Scorecard Results
 |
Thomas J. McInerney Mr. McInerney’s annual incentive award could range from 0% of target to 200% of target based on results versus applicable performance targets. His 2019 target was $2,000,000 (or, 200% of base pay). Mr. McInerney’s approved annual incentive award for 2019 was $2,500,000, or approximately 126% of his targeted amount for 2019, based on the achievement of the following financial and strategic measures for the company: |
Financial Objectives(1)
| Performance Unit | Key Financial Metrics ($ in millions) | Weight | 2019 Target |
2019 Measured Results |
Funding % | ||||||||||
| U.S. Mortgage Insurance | Net operating income | 10 | % | $ | 491 | $ | 569 | 150% | |||||||
| Operating ROE (unlevered 5 pt average) | 10 | % | 15.8 | % | 18.0 | % | 150% | ||||||||
| U.S. Life Insurance |
GLIC Consolidated Risk-Based Capital | 10 | % | 165% | 213% | 150% | |||||||||
| Canada Mortgage Insurance (Canadian $ in millions) | Net operating income | 5 | % | $ | 462 | $ | 466 | 103% | |||||||
| Operating ROE (levered 5 pt average) | 5 | % | 12.0 | % | 11.7 | % | 93% | ||||||||
| Australia Mortgage Insurance (Australian $ in millions) |
Net operating income | 5 | % | $ | 90 | $ | 77 | 64% | |||||||
| Return of Capital Above Ordinary Dividends | 5 | % | $ | 200 | $ | 200 | 100% | ||||||||
| Investments | Results of Full Scorecard (Full Scorecard Details Available under Mr. Sheehan) | 10 | % | 100 | % | 134 | % | 134% | |||||||
| (1) | At the request of certain state insurance regulators, the company did not set specific incremental LTC premium increase financial targets for Mr. McInerney. In lieu of this, Mr. McInerney’s scorecard included a strategic objective to achieve meaningful progress in addressing the general NAIC LTC regulatory framework. |
Strategic Objectives
| Objective | Weight | Funding % | ||||||
| Close Oceanwide Transaction & Transition Execution | 20 | % | 100 | % | ||||
| Meaningful Progress in Addressing NAIC LTC Regulatory Framework (for CEO only) | 20 | % | 150 | % | ||||
| Overall % | 126 | % | ||||||
27 Form 10-K/A
|
Part III |
 |
Kelly L. Groh Ms. Groh’s annual incentive award could range from 0% of target to 200% of target based on results versus applicable performance targets. Her 2019 target was $844,000 (or, 125% of base pay). Ms. Groh’s approved annual incentive award for 2019 was $1,030,000, or approximately 122% of her targeted amount for 2019, based on the achievement of the financial and strategic measures indicated below. |
 |
Kevin D. Schneider Mr. Schneider’s annual incentive award could range from 0% of target to 200% of target based on results versus applicable performance targets. His 2019 target was $1,125,000 (or, 150% of base pay). Mr. Schneider’s approved annual incentive award for 2019 was $1,370,000, or approximately 122% of his targeted amount for 2019, based on the achievement of the financial and strategic measures indicated below. |
 |
Ward E. Bobitz Mr. Bobitz’s annual incentive award could range from 0% of target to 200% of target based on results versus applicable performance targets. His 2019 target was $575,000 (or, 100% of base pay). Mr. Schneider’s approved annual incentive award for 2019 was $700,000, or approximately 122% of his targeted amount for 2019, based on the achievement of the financial and strategic measures indicated below. |
Financial Objectives
| Performance Unit | Key Financial Metrics ($ in millions) | Weight | 2019 Target |
2019 Measured Results |
Funding % | |||||||||||
| U.S. Mortgage Insurance | Net operating income | 10 | % | $ | 491 | $ | 569 | 150 | % | |||||||
| Operating ROE (unlevered 5 pt average) | 10 | % | 15.8 | % | 18.0 | % | 150 | % | ||||||||
| U.S. Life Insurance | GLIC Consolidated Risk-Based Capital | 10 | % | 165 | % | 213 | % | 150 | % | |||||||
| Gross Incremental Premium Approved | 5 | % | $ | 275 | $ | 334 | 150 | % | ||||||||
| Core Statutory pre-tax income metric | 5 | % | $ | 1,170 | $ | 1,317 | 150 | % | ||||||||
| Canada Mortgage Insurance (Canadian $ in millions) |
Net operating income | 5 | % | $ | 462 | $ | 466 | 103 | % | |||||||
| Operating ROE (levered 2 pt average) | 5 | % | 12.0 | % | 11.7 | % | 93 | % | ||||||||
| Australia Mortgage Insurance (Australian $ in millions) | Adjusted operating income | 5 | % | $ | 90 | $ | 77 | 64 | % | |||||||
| Return of Capital Above Ordinary Dividends | 5 | % | $ | 200 | $ | 200 | 100 | % | ||||||||
| Investments | Results of Full Scorecard (Full Scorecard Details Available under Mr. Sheehan) | 10 | % | 100 | % | 134 | % | 134 | % | |||||||
Strategic Objectives
| Objective | Weight | Funding % | ||||||
| Close Oceanwide Transaction & Transition Execution | 20 | % | 100 | % | ||||
| Employee Voluntary Turnover (Target US Rate Under 15%) | 10 | % | 110 | % | ||||
| Overall % | 122 | % | ||||||
Genworth Financial, Inc. 28
|
Part III |
 |
Daniel J. Sheehan IV Mr. Sheehan’s annual incentive award could range from 0% of target to 200% of target based on results versus applicable performance. His 2019 target was $1,200,000. Mr. Sheehan’s approved annual incentive award for 2019 was $1,610,000, or approximately 134% of his targeted amount based on the achievement of the following financial and strategic measures for the investment function: |
Financial Objectives
| Objective | Weight | 2019 Target |
2019 Measured Results |
Funding % | ||||||||||
| Net Investment Income | 20 | % | $ | 3,325 | $ | 3,357 | 107 | % | ||||||
| Total company adjusted U.S. GAAP impairments and trading losses | 10 | % | $ | (40 | ) | $ | 60 | 150 | % | |||||
| U.S. Life Insurance statutory impairments and trading losses and capital/credit migration impact | 20 | % | $ | (130 | ) | $ | (48 | ) | 150 | % | ||||
| Purchase yield vs. external benchmark | 10 | % | 3.64 | % | 4.07 | % | 150 | % | ||||||
Strategic Objectives
| Objective | Weight | Funding % | ||||||
| US Life Private Asset Production | 20 | % | 130 | % | ||||
| GMI Global Asset Production | 10 | % | 117 | % | ||||
| Strategic Asset Production | 10 | % | 150 | % | ||||
| Overall % | 134 | % | ||||||
Annual Long-Term Incentives
We believe that the largest component of our annual compensation opportunities for named executive officers should be in the form of longer-term incentives, including annual long-term equity and cash grants.
Our long-term incentive program is closely aligned with a multi-year business plan, which is reviewed by the Genworth Board of Directors. The Compensation Committee sets performance targets for the long-term incentive program that align with achievement of a multi-year business plan, with above target payouts for exceeding the plan and below target or no payouts for not meeting the plan. When setting the multi-year business plan, many factors and assumptions are considered, such as the competitive landscape, the global economic environment, market trends, interest rates, and regulatory considerations. As a result, performance targets within our long-term incentive plan may not always escalate on a yearly basis, and potentially may be set below the previous year’s targets or actual results.
To determine annual long-term equity grant awards for the CEO, the Compensation Committee works with their independent compensation consultant in executive session. To determine long-term equity grant awards to all other executive officers, the CEO prepares a recommendation for each of such executive officers for the Compensation Committee’s consideration and approval. In addition, when determining long-term equity award values for each executive officer (including our CEO), the Compensation Committee considers competitive pay levels, alignment of total pay at risk with the individual’s ability to impact long-term company performance, the individual’s sustained performance over time, and long-term succession and retention needs.
29 Form 10-K/A
|
Part III |
The company uses a 20-day historical average closing price in February and/or March to create an estimate of the grant-date fair value of a share for planning purposes. The compensation value is converted to a number of shares, typically rounded, for Compensation Committee approval. This approach mitigates the impact of short-term fluctuations in stock price on award levels, allows for clear understanding of both share levels and approximate compensation values at the time of Compensation Committee approval, and facilitates delivering rounded award amounts. The Compensation Committee approves a number of shares at the end of this process using the 20-day trading average up to and including the date of grant.
For the 2019-2021 PSUs and RSUs, our Compensation Committee reviewed the proposed compensation values for all executive officers, determined aggregate award sizes based on the approach described above using an estimated share value and granted the awards in May 2019 and subsequently approved the performance goals and terms and conditions for the PSUs in December 2019.
In addition, and in response to stockholder feedback, the Compensation Committee changed Mr. McInerney’s long-term incentive awards in 2019 to 100% PSUs, rather than 50% PSUs and 50% RSUs.
NEO LTI Target Amounts
Annual equity grants made in 2017 through 2019 to the CEO have been awarded in the following amounts:
| Named Executive Officer | Reported Year |
Approximate Compensation Value Intended to be Delivered(1) |
# of RSUs Awarded |
“Target” # of PSUs Awarded | |||||
| Mr. McInerney | 2019 | $ | 4,125,000 | — | 1,114,865 | ||||
| 2018 | $ | 4,125,000 | 739,000 | 739,000 | |||||
| 2017 | $ | 4,125,000 | 554,000 | 554,000 | |||||
| (1) | Due to differences in how the grant-date fair value of awards is determined for accounting purposes, these amounts will differ from the amounts reflected as the grant date fair value of the awards in the 2019 Summary Compensation Table. |
The 2019 target annual long-term incentive opportunities for our named executive officers average 54% of target compensation. Individual long-term incentive targets are listed in the 2019 Grants of Plan-Based Awards Table below.
Genworth Financial, Inc. 30
|
Part III |
The intended value of the annual long-term incentive awards made in 2017 through 2019 to the other NEOs were awarded in the following amounts:
| Named Executive Officer | Reported Year |
Approximate Compensation Value Intended to be Delivered(1) |
# of RSUs Awarded |
“Target” # of PSUs Awarded |
“Target” $ Value of PCAs Awarded(2) | |||||||
| Ms. Groh | 2019 | $ | 2,000,000 | 270,271 | 270,271 | — | ||||||
| 2018 | $ | 1,500,000 | — | — | $ | 1,500,000 | ||||||
| 2017 | $ | 1,000,000 | 134,000 | 134,000 | — | |||||||
| Mr. Sheehan | 2019 | $ | 2,000,000 | 270,271 | 270,271 | — | ||||||
| 2018 | $ | 1,500,000 | — | — | $ | 1,500,000 | ||||||
| 2017 | $ | 1,500,000 | 202,000 | 202,000 | — | |||||||
| Mr. Schneider | 2019 | $ | 2,000,000 | 270,271 | 270,271 | — | ||||||
| 2018 | $ | 2,000,000 | — | — | $ | 2,000,000 | ||||||
| 2017 | $ | 2,000,000 | 269,000 | 269,000 | — | |||||||
| Mr. Bobitz | 2019 | $ | 750,000 | 101,352 | 101,352 | — | ||||||
| 2018 | $ | 900,000 | — | — | $ | 900,000 | ||||||
| 2017 | $ | 633,000 | 85,000 | 85,000 | — | |||||||
| (1) | Due to differences in how the grant-date fair value of awards is determined for accounting purposes, these amounts will differ from the amounts reflected as the grant date fair value of the awards for 2017 and 2019 in the 2019 Summary Compensation Table. 2018 Amounts noted for PCAs reflect performance-based cash long-term incentives that are not reflected in the 2019 Summary Compensation Table. |
| (2) | The NEOs (other than the CEO) received long-term PCAs in lieu of stock based long-term incentives in 2018. The PCAs awarded were cash-based and therefore not reflected in the 2019 Summary Compensation Table for 2018. |
Long-Term Incentive Award Design
Our long-term incentive awards to executive officers have included, over time, different combinations of SARs, PSUs, RSUs and performance-based cash awards (“PCAs”). Taken together, we believe our annual long-term incentive grants provide our named executive officers with effective retention value and appropriate incentives to achieve long-term company performance objectives, while aligning our executive officer compensation program with the long-term interests of our stockholders.
For 2019, our named executive officers’ long-term equity grants were awarded 100% in PSUs for our CEO, and 50% PSUs and 50% RSUs for our other named executive officers. In 2019, the Compensation Committee eliminated RSUs from the CEO pay program and transitioned to 100% PSU grants. Therefore, beginning in 2019, Mr. McInerney’s long-term incentives are 100% performance-based.
Additional Information Regarding Awards of Restricted Stock Units
RSUs vest 33% per year, beginning on the first anniversary of the grant date. As noted above, CEO equity grants in 2019 were changed to 100% PSUs. Net after-tax shares acquired by named executive officers through the grant or exercise of all company equity incentive awards are subject to a 50% retention ratio until stock ownership guidelines are met. Awards of RSUs are generally forfeited upon termination of employment with the company prior to vesting, except for limited instances described in the Executive Compensation—Potential Payments upon Termination or Change of Control section below.
Additional Information Regarding Awards of Performance Cash Awards
As disclosed in the 2019 Annual Proxy Statement, with not enough shares available for the 2018 long-term incentive awards granted in May 2018, the Compensation Committee altered the traditional pay structure for our named executive officers other than the CEO to have 100% of their long-term incentives be PCAs to ensure continued alignment with stockholder interests was maintained. At the 2018 Annual Meeting, stockholders approved a new omnibus plan which allowed long-term incentives beginning in 2019 to all named executive officers to again be equity-based. As a result, no PCAs were awarded to named executive officers in 2019.
31 Form 10-K/A
|
Part III |
Additional Information Regarding 2019-2021 Performance Stock Units
Awards of 2019-2021 PSUs vest based on the company’s achievement of performance goals relating to consolidated Genworth U.S. GAAP Adjusted Operating Income, measured over one cumulative three-year performance measurement period. The target number of PSUs noted above was fixed for each participant at the time of grant and following the performance period any unvested PSUs will be forfeited. No payout is earned for performance below threshold level for the performance measurement period, while performance at threshold would result in a 50% payout, and performance at the maximum payout would result in 200% of target.
As noted on page 19, in 2019, our Compensation Committee chair, David Moffett, reached out to our largest institutional stockholders, representing in aggregate approximately 60% of our outstanding shares, to solicit their feedback and input on our compensation programs. Based on this feedback, performance measured over a three-year cumulative period instead of three discrete one-year measurement periods is preferred by many of our stockholders.
At its May 2019 meeting, the Compensation Committee approved the grant amount, terms and conditions of the 2019-2021 PSUs, subject to the specific performance goals for the PSUs being determined at a later meeting. After chair David Moffett reached out to our largest institutional stockholders to solicit their feedback and input on our compensation programs in the fall of 2019, the Compensation Committee determined that the performance goals for the 2019-2021 PSUs would be measured over a three-year cumulative period instead of three separate one-year measurement periods. At its December 2019 meeting, the Compensation Committee set the specific targets and payout ranges for the 2019-2021 PSUs.
2019-2021 Performance Stock Unit Metrics and Goals
| Consolidated Genworth U.S. GAAP Adjusted Operating Income(1) | |||||||||||||
| Performance Measurement Period | Weight (% of Target) |
Threshold (50% Payout) |
Target (100% Payout) |
Maximum (200% Payout) |
Current Estimated Result | ||||||||
| January 1, 2019—December 31, 2021 ($MM) | 100% | $ | 840 | $ | 1,050 | $ | 1,260 | Not Available | |||||
| (1) | Consolidated Genworth U.S. GAAP Adjusted Operating Income will be measured excluding impacts from the proposed merger with Oceanwide related to Purchase-GAAP accounting adjustments, such as legal fees and settlement costs related to merger & acquisition litigation, and any strategic deal-related expenses (e.g. 3rd party legal, actuarial or reinsurance support for negotiating or implementing a transaction). In addition, Adjusted Operating Income may be adjusted to exclude the impacts from in-force reserve changes from future period assumption changes (e.g. mortality, interest rate, expense, lapse, morbidity), methodology changes (e.g. changes that would arise from a system conversion), changes in foreign exchange rates, and tax changes based on updated regulations, guidance, assessments, or refinements related to technical areas of the Tax Cuts and Jobs Act. It is expected that all threshold, target and maximum performance goals for each Performance Measurement Period will be adjusted (up or down, as appropriate) at the time the Company closes its proposed merger with Oceanwide in order to account for the impact of Purchase-GAAP accounting adjustments on the performance goals. |
Additional Information Regarding 2018-2020 Performance Stock Unit and Performance-Based Cash Grants
Awards of 2018-2020 PSUs and PCAs vest based on the company’s achievement of performance goals relating to consolidated Genworth U.S. GAAP Adjusted Operating Income, measured over three discrete performance measurement periods as noted below. The target number of PSUs and the PCA target value noted above was fixed for each participant at the time of grant and following the performance period any unvested PSUs and PCAs will be forfeited. Following the final performance measurement period, performance under each measurement period is independently weighted, with the results for each performance measurement period multiplied by the applicable weightings, then added together. As the first two performance measurement periods were complete as of December 31, 2019, the estimated results are noted below. No payout is earned for performance below threshold level for a given performance measurement period, while performance at threshold would result in a 50% payout, and performance at the maximum payout would result in 200% of target.
Genworth Financial, Inc. 32
|
Part III |
2018-2020 Performance Stock Unit and Performance Cash Award Metrics and Goals
| Consolidated
Genworth U.S. GAAP Adjusted Operating Income(1) | |||||||||||||
| Performance Measurement Period | Weight
(% of Target) |
Threshold (50% Payout) |
Target (100% Payout) |
Maximum (200% Payout) |
Current Estimated Result | ||||||||
| January 1, 2018—December 31, 2018 ($MM) | 34% | $ | 400 | $ | 500 | $ | 600 | Above Target | |||||
| January 1, 2019—December 31, 2019 ($MM) | 33% | $ | 530 | $ | 665 | $ | 800 | Above Target | |||||
| January 1, 2020—December 31, 2020 ($MM) | 33% | $ | 500 | $ | 625 | $ | 750 | Not Available | |||||
| (1) | Consolidated Genworth U.S. GAAP Adjusted Operating Income will be measured excluding impacts from in-force reserve changes from future period assumption changes (e.g., mortality, interest rate, expense, laps, morbidity), methodology changes (e.g., changes that would arise from a system conversion), changes in foreign exchange rates, tax changes based on updated regulations, guidance, assessments, or refinements related to technical areas of the Tax Cuts and Jobs Act, and litigation related to the proposed merger with Oceanwide (legal fees and settlement costs), and any strategic deal-related expenses (e.g., third-party legal, actuarial or reinsurance support for negotiating or implementing a transaction). It is expected that all threshold, target and maximum performance goals for each Performance Measurement Period will be adjusted (up or down, as appropriate) at the time the company closes its proposed merger with Oceanwide in order to account for the impact of Purchase-GAAP accounting adjustments on the performance goals. |
Additional Information Regarding 2017-2019 Performance Stock Unit Grants
Awards of 2017-2019 PSUs vested based on the company’s achievement of performance goals relating to consolidated Genworth U.S. GAAP Adjusted Operating Income, measured over three discrete performance measurement periods as noted below. The target number of PSUs noted above was fixed for each participant at the time of grant, and following the performance period any unvested PSUs were forfeited. Following the final performance measurement period, performance under each measurement period was independently weighted, with the results for each performance measurement period multiplied by the applicable weightings, then added together. No payout would have been earned for performance below threshold level for a given performance measurement period, while performance at threshold would result in a 50% payout, and performance at the maximum payout would result in 150% of target.
Based on the below financial results over the three-year performance period, an overall payout of 150% of target was earned.
2017-2019 Performance Stock Unit Metrics and Goals
| Consolidated
Genworth U.S. GAAP Adjusted Operating Income(1) | ||||||||||||||
| Performance Measurement Period | Weight
(% of Target) |
Threshold (50% Payout) |
Target (100% Payout) |
Maximum (150% Payout) |
Result | |||||||||
| January 1, 2017—December 31, 2017 ($MM) | 34% | $ | 370 | $ | 460 | $ | 510 | $ | 827 | |||||
| January 1, 2018—December 31, 2018 ($MM) | 33% | $ | 385 | $ | 485 | $ | 535 | $ | 554 | |||||
| January 1, 2019—December 31, 2019 ($MM) | 33% | $ | 480 | $ | 600 | $ | 660 | $ | 780 | |||||
| (1) | Consolidated Genworth U.S. GAAP Adjusted Operating Income was measured excluding impacts from in-force reserve changes from future period assumption changes (e.g., mortality, interest rate, expense, lapse, morbidity), methodology changes (e.g., changes that would arise from a system conversion), changes in foreign exchange rates, expense associated with the Australia IPO Class Action lawsuit and litigation related to the proposed merger with Oceanwide (legal fees and settlement costs), and any strategic deal-related expenses (e.g., third party legal, actuarial or reinsurance support for negotiating or implementing a transaction). We included the performance of the Canada mortgage insurance business in 2019 up to the point of disposition in our NEO performance results. |
33 Form 10-K/A
|
Part III |
Other Benefit Programs
Severance Benefits—Involuntary Termination without a Change of Control
The Compensation Committee annually reviews the provisions and participants of executive-level severance benefits in order to monitor competitiveness and appropriate levels of benefits to meet the plan objectives. After such a review, we adopted the 2015 Key Employee Severance Plan (the “2015 Severance Plan”), effective as of January 1, 2015, in order to offer competitive termination benefits, promote retention of a selected group of key employees, including our named executive officers, and to provide key protections to the company in the form of restrictive covenants.
The specific terms of the 2015 Severance Plan, and the potential payments and benefits upon a termination of employment without “cause” or by the executive for “good reason” for each of our named executive officers are described more fully in the Executive Compensation—Potential Payments upon Termination or Change of Control section below.
Severance Benefits—Involuntary Termination Following a Change of Control
The Compensation Committee annually reviews the provisions and participants of our change in control plans to monitor competitiveness and appropriate levels of benefits to meet plan objectives. After such a review, we adopted the 2014 Change of Control Plan (the “2014 Change of Control Plan”) in order to provide change of control severance benefits for a select group of key executives, including our named executive officers, in the event that the executive’s employment is terminated without “cause” or by the executive for “good reason” within two years following a change of control of the company (each a “Qualified Termination”).
The change of control severance benefits are intended to keep participating key leaders “neutral” to the possibility of corporate transactions in the best interests of stockholders by removing the fear of job loss and other distractions that may result from potential, rumored or actual changes of control of the company. All benefits under our change of control plan are “double-trigger” benefits, meaning that no compensation will be paid to participants solely upon the occurrence of a change of control so as to not create an unintended incentive. We believe that this structure is appropriate for employees whose jobs are in fact terminated in such a transaction, without providing a windfall to those who continue employment following the transaction.
The specific terms of the 2014 Change of Control Plan, and the potential payments and benefits upon a Qualified Termination for each of our named executive officers are described more fully in the Executive Compensation—Potential Payments upon Termination or Change of Control section below.
The Merger Agreement does not include any special compensation awards for any named executive officer as a result of the Oceanwide transaction. The “double-trigger” provisions of the change of control severance benefits apply to the Oceanwide transaction, meaning that no compensation will be paid to participants solely upon the closing of the transaction, so as not to create an unintended incentive regarding the transaction.
Retirement Benefits
Retirement benefits also fulfill an important role within our overall executive compensation program because they provide a competitive financial security component that supports attraction and retention of talent. We maintain the Genworth Financial, Inc. Retirement and Savings Plan (the “Retirement and Savings Plan”), a tax-qualified, defined contribution plan in which our U.S. employees, including our named executive officers, are eligible to participate. The Retirement and Savings Plan has two features: the “401(k) Savings Feature,” in which participants can defer savings on a pre-tax basis and receive company matching contributions, subject to certain Internal Revenue Service limits, and a “Retirement Account Feature,” which includes only company contributions made annually based on a schedule of completed years of service and age. In addition, we offered the following non-qualified retirement and deferred compensation plans in 2019 that were available to certain of our named executive officers:
| ● | Genworth Financial, Inc. Supplemental Executive Retirement Plan (the “SERP”), which is a defined benefit plan that was closed to new participants after December 31, 2009; |
| ● | Genworth Financial, Inc. Retirement and Savings Restoration Plan (the “Restoration Plan”), which is a defined contribution plan; and |
| ● | Genworth Financial, Inc. Deferred Compensation Plan (the “Deferred Compensation Plan”), which was closed to new contributions after December 31, 2015. |
Genworth Financial, Inc. 34
|
Part III |
We continually assess our benefit offerings and seek to align benefit offerings with competitive market levels. It is important to us to keep our benefit design and costs competitive with our peers so that we can continue to attract and retain talent while managing our expenses. Each of the above non-qualified retirement plans is described in more detail in the Executive Compensation—Pension Benefits and Non-Qualified Deferred Compensation sections below.
Other Benefits and Perquisites
We regularly review the benefits and perquisites provided to our named executive officers to ensure that our programs align with our overall principles of providing competitive compensation and benefits that maximize the interests of our stockholders. We provide executive officers with an individually-owned universal life insurance policy (the “Leadership Life Program”) available to all of our U.S.-based executives, an enhanced company-owned life insurance program (the “Executive Life Program”) and a limited number of perquisites intended to keep executive officers healthy and focused on company business with minimal distraction. The perquisites provided to named executive officers are the opportunity to receive financial planning services and annual physical examinations.
We also provide certain benefits in the event of death, total disability or sale of a business unit to a successor employer. Amounts payable to named executive officers in those limited circumstances are described in more detail in the Executive Compensation—Potential Payments upon Termination or Change of Control section below.
Other Key Compensation Governance Policies
In addition to our compensation programs described above, the company maintains the following policies and practices intended to strengthen the overall long-term stockholder alignment and governance of our compensation programs.
Executive Officer Stock Ownership Guidelines, Retention Ratio and Net Hold Policy
The company maintains stock ownership guidelines for the amount of common stock that must be held by the company’s executive officers. The stock ownership guidelines specify the value of company stock, as a multiple of the executive officer’s base salary, which must be held by each executive officer.
| Position | Multiple | |||
| CEO | 7x Salary |
 | ||
| CFO, CIO and COO | 3x Salary |
 | ||
| Other Executive Vice Presidents | 2x Salary |
 |
The ownership multiple is used to calculate a target number of shares for each designated executive officer as of January 1 of each year (or, in the case of a newly-designated executive officer, as of the date such executive officer first becomes subject to the ownership guidelines). The target number of shares is individually determined by multiplying the executive officer’s then-current annual base salary by the applicable multiple, and dividing the result by the average closing price of the company’s common stock during the 60 trading days immediately preceding the measurement date.
Compliance with the stock ownership requirements is also measured as of January 1 of each year. In the event that an executive officer has not reached the required level of stock ownership as of any measurement date, the executive officer will be subject to a 50% retention ratio that requires the executive officer to retain (and not sell or transfer) at least 50% of the after-tax “profit” shares resulting from the grant or exercise of all company equity incentive awards until the next measurement date.
35 Form 10-K/A
|
Part III |
In order to meet this stock ownership requirement, an executive officer may count (i) all shares of common stock owned by the executive officer, including common stock held in the company’s Retirement and Savings Plan, (ii) any outstanding RSUs, but excluding any unvested RSUs that vest based on achievement of performance goals (such as PSUs), and (iii) a number of shares representing the aggregate “spread value” of vested and in-the-money stock options and SARs (with such number being calculated as of January 1 of each year on a pre-tax basis, based on the 60 trading day average closing price of the company’s common stock on such date). None of our named executive officers sold shares in 2017, 2018, or 2019.
The following table shows the number of shares of common stock considered to be held, and the applicable stock ownership requirements, for each of our named executive officers, as of January 1, 2020:
| Named Executive Officer | Stock
Requirement as of January 1, 2020, based on $4.20 stock price average (#) |
Number
of Shares Deemed Held as of January 1, 2020, based on $4.20 stock price average (#) |
Stock
Held as a % of Guidelines as of January 1, 2020 |
Subject
to 50% Net Share Retention Ratio For Duration of 2019 | ||||
| Mr. McInerney | 1,665,873 | 2,164,238 | >100% | No | ||||
| Ms. Groh | 481,913 | 645,933 | >100% | No | ||||
| Mr. Sheehan | 428,367 | 888,108 | >100% | No | ||||
| Mr. Schneider | 535,459 | 1,035,420 | >100% | No | ||||
| Mr. Bobitz | 273,679 | 339,360 | >100% | No |
|
Retention Ratio An executive officer is subject to retain |
Net Hold Policy Executive officers are required to hold the shares of Genworth stock that they receive for at least | |
|
50% of after-tax “profit” shares if the executive officer has not reached the required level of stock ownership as of any measurement date. |
nine months in order to minimize any possible appearance of an incentive for executive officers to seek to cause short-term increases in the price of Genworth shares in order to exercise stock options or SARs and sell the stock for unwarranted personal gains. |
Anti-Hedging and Anti-Pledging Policies for Directors and Executive Officers
The company maintains an anti-hedging policy, which prohibits executive officers and directors from buying or selling options (puts or calls) on Genworth securities on an exchange or in any other organized market, and also prohibits certain forms of hedging or monetization transactions with respect to Genworth securities, such as prepaid variable forward contracts, equity swaps, collars, forward sale contracts and exchange funds. The company maintains this policy because hedging transactions, which might be considered short-term bets on the movement of the company’s securities, could create the appearance that the person is trading based on inside information. In addition, transactions in options may also focus the person’s attention on short-term performance at the expense of our long-term objectives.
Genworth Financial, Inc. 36
|
Part III |
The company also maintains an anti-pledging policy, which prohibits its executive officers and directors from holding Genworth securities in a margin account or otherwise pledging Genworth securities as collateral for a loan. Securities held in a margin account as collateral for a margin loan may be sold by the broker without the customer’s consent if the customer fails to meet a margin call. Similarly, securities pledged as collateral for a loan may be sold in foreclosure if the borrower defaults on the loan. The company maintains this policy because a margin sale or foreclosure sale may occur at a time when the pledger is aware of material nonpublic information or otherwise is not permitted to trade in Genworth securities and the margin sale or foreclosure sale of Genworth securities during such time could also create the appearance that the person is trading based on inside information.
Clawback Policy
The company maintains a clawback policy under which the company will seek to recover, at the discretion and direction of the Compensation Committee, and after it has considered the costs and benefits of doing so, incentive compensation earned by, awarded or paid to a covered officer for performance periods beginning after January 1, 2011, if the result of a performance measure upon which the award was based or paid is subsequently restated or otherwise adjusted in a manner that would reduce the size of the award or payment (other than a restatement or adjustment due to a change in applicable accounting principles, rules or interpretations). In addition, if a covered officer engaged in fraud or intentional misconduct that contributed to an award or payment of incentive compensation to him or her that is greater than would have been paid or awarded in the absence of the misconduct, the company may take other remedial and recovery actions, as determined by the Compensation Committee.
Tax and Accounting Considerations
We consider accounting and tax implications when designing our executive compensation and incentive programs. For example, it has been our intent to maximize the deductibility of executive compensation while retaining flexibility to compensate executive officers in a manner commensurate with performance and the competitive landscape for executive talent. The exemption from Section 162(m)’s deduction limit for performance-based compensation, however, has been repealed by the Tax Cuts and Jobs Act enacted in December 2017, such that compensation paid to our covered executive officers in excess of $1,000,000 will not be deductible unless it qualifies for transition relief applicable to certain arrangements in place as of November 2, 2017.
Evaluation of Compensation Program Risks
The Compensation Committee annually reviews a report prepared by management regarding the design and operation of our compensation arrangements for employees, including executive officers, for the purpose of determining whether such programs might encourage inappropriate risk-taking that could have a material adverse effect on the company. Following that review for 2019 compensation, the Compensation Committee agreed with management’s conclusion that the company’s compensation plans, programs and policies do not encourage employees to take risks that are reasonably likely to have a material adverse effect on the company.
37 Form 10-K/A
|
Part III |
Executive Compensation Tables
The following table provides information relating to compensation earned by or paid to our named executive officers in all capacities:
2019 Summary Compensation Table
| Name and Principal Position | Year | Salary ($) |
Bonus ($) |
Stock Awards ($)(1)(2) |
Option Awards ($) |
Non-equity Incentive Plan Compensation ($)(3) |
Change in Pension Value and Nonqualified Deferred Compensation Earnings ($)(4) |
All Other Compensation ($)(5) |
Total ($) | |||||||||
| Thomas J. McInerney | 2019 | 1,000,000 | 0 | 5,139,528 | 0 | 2,500,000 | 0 | 463,106 | 9,102,634 | |||||||||
| President and Chief | 2018 | 996,804 | 0 | 5,291,240 | 0 | 2,500,000 | 0 | 523,900 | 9,311,944 | |||||||||
| Executive Officer | 2017 | 996,804 | 0 | 4,443,080 | 0 | 3,000,000 | 0 | 525,327 | 8,965,211 | |||||||||
| Kelly L. Groh | 2019 | 672,115 | 0 | 2,154,060 | 0 | 1,030,000 | 187,928 | 197,500 | 4,241,603 | |||||||||
| Executive Vice President and | 2018 | 646,389 | 0 | 0 | 0 | 1,000,000 | 0 | 186,929 | 1,833,318 | |||||||||
| Chief Financial Officer | 2017 | 588,498 | 658,250 | 1,074,680 | 0 | 900,000 | 135,675 | 175,661 | 3,532,764 | |||||||||
| Daniel J. Sheehan IV | 2019 | 600,000 | 0 | 2,154,060 | 0 | 1,610,000 | 1,265,016 | 137,914 | 5,766,990 | |||||||||
| Executive Vice President and | 2018 | 598,083 | 0 | 0 | 0 | 1,650,000 | 209,148 | 149,469 | 2,606,700 | |||||||||
| Chief Investment Officer | 2017 | 598,083 | 1,000,000 | 1,620,040 | 0 | 1,900,000 | 1,309,516 | 148,615 | 6,576,254 | |||||||||
| Kevin D. Schneider | 2019 | 750,000 | 0 | 2,154,060 | 0 | 1,370,000 | 1,144,086 | 165,810 | 5,583,956 | |||||||||
| Executive Vice President and | 2018 | 742,811 | 0 | 0 | 0 | 1,360,000 | 272,779 | 175,969 | 2,551,559 | |||||||||
| Chief Operating Officer | 2017 | 722,683 | 1,000,000 | 2,157,380 | 0 | 1,630,000 | 1,122,686 | 165,872 | 6,798,621 | |||||||||
| Ward E. Bobitz | 2019 | 570,192 | 0 | 807,776 | 0 | 700,000 | 674,596 | 115,740 | 2,868,304 | |||||||||
| Executive Vice President and | 2018 | 538,657 | 425,000 | 0 | 0 | 665,000 | 295,559 | 116,232 | 2,040,448 | |||||||||
| General Counsel | 2017 | 484,025 | 0 | 681,700 | 0 | 750,000 | 735,668 | 111,429 | 2,762,822 |
| (1) |
Reflects the aggregate grant date fair value of RSUs and PSUs awarded during the period, determined in accordance with FASB ASC Topic 718. Grant date fair value for the RSUs is based on the grant date fair value of the underlying shares. Grant date fair value for the PSUs is based on the grant date fair value of the underlying shares at target performance and the probable outcome of performance-based conditions at the time of grant, excluding the effect of estimated forfeitures. The 2019 value for each named executive officer includes the grant date fair value of PSUs granted, and for all except Mr. McInerney, also includes the grant date fair value of RSUs awarded. Assuming achievement of the PSU performance conditions at the highest level (rather than at target level), the aggregate grant date fair value of awards reflected in this column would be higher by the following amounts: Mr. McInerney, $5,139,528; Ms. Groh, $1,245,949; Mr. Sheehan, $1,245,949; Mr. Schneider, $1,245,949 and Mr. Bobitz $467,233. |
| (2) |
The NEOs (other than the CEO) received long-term PCAs in lieu of stock based long-term incentives in 2018. The PCA grant date fair value amounts awarded in for these NEOs are: $1,500,000 for Ms. Groh; $1,500,000 for Mr. Sheehan; $2,000,000 for Mr. Schneider; and $900,000 for Mr. Bobitz. The PCAs awarded were cash-based and therefore not reflected in the Summary Compensation Table above for 2018. |
| (3) |
Reflects the value of cash incentives paid pursuant to our annual incentive program as described in the Compensation Discussion and Analysis section above. |
Genworth Financial, Inc. 38
|
Part III |
| (4) |
Reflects the annual change in actuarial present values of the eligible named executive officers’ accumulated benefits under the SERP. The SERP was closed to new participants effective January 1, 2010. A description of the SERP precedes the 2019 Pension Benefits Table below. |
| (5) |
See the 2019 All Other Compensation - Details table below: |
2019 All Other Compensation—Details
| Name | Company Contributions to the Retirement Plans ($)(a) |
Life Insurance Premiums ($)(b) |
Executive Physical ($) |
Financial Counseling ($) |
Total ($) | ||||||
| Mr. McInerney | 417,308 | 22,373 | 3,440 | 19,985 | 463,106 | ||||||
| Ms. Groh | 167,212 | 10,303 | 0 | 19,985 | 197,500 | ||||||
| Mr. Sheehan | 126,500 | 11,414 | 0 | 0 | 137,914 | ||||||
| Mr. Schneider | 119,500 | 22,885 | 3,440 | 19,985 | 165,810 | ||||||
| Mr. Bobitz | 75,760 | 16,555 | 3,440 | 19,985 | 115,740 |
| (a) |
Reflects contributions made on behalf of the named executive officers for each of the following programs: (i) company matching contributions made in 2019 to the 401(k) Savings Feature of the Retirement and Savings Plan; (ii) company contributions made in 2020 to the Retirement Account Feature of the Retirement and Savings Plan, which are based on 2019 earnings; and (iii) company contributions made in 2020 to the Restoration Plan, which are based on 2019 earnings. | |
| (b) |
Represents premium payments made in 2019 for the following programs: (i) Leadership Life Program, an individually owned universal life insurance policy provided to all of our executives; and (ii) Executive Life Program, a $1 million company-owned life insurance policy for which the participating named executive officers may identify a beneficiary for payment by us in the event of his or her death. Premiums for the Leadership Life Program are graded through age 59, with escalation in particular between age 50 and 59, and level thereafter. |
Grants of Plan-Based Awards
The table below provides information on the following plan-based awards that were made in 2019:
| ● | Annual Incentive. Annual incentive opportunities awarded to our named executive officers are earned based on company performance measured against one-year financial objectives and key strategic priorities, together with a qualitative assessment of performance, including individual performance objectives. Additional information regarding the design of the annual incentive program and 2019 awards are included in the Compensation Discussion and Analysis section above. Annual incentives are identified as “AI” in the Award Type column of the following table. |
| ● | Restricted Stock Units. Each RSU represents a contingent right to receive one share of our common stock in the future. If the company pays dividends on its common stock, dividend equivalents accrue with respect to the RSUs and are paid in cash at the time that the corresponding RSUs vest. Additional information regarding RSUs is included in the Compensation Discussion and Analysis section above. |
| ● | Performance Stock Units. PSUs consist of performance-vesting stock units that may convert to shares following the end of the performance period based on achievement of certain pre-established performance goals. PSUs are granted with respect to a target number of shares, will be forfeited if performance falls below a designated threshold level of performance, and may be earned up to 200% of the target number of shares for exceeding a designated maximum level of performance. At its May 2019 meeting, the Compensation Committee approved the grant amounts, terms and conditions of the 2019-2021 PSUs, subject to the specific performance goals for the PSUs being determined at a later meeting. After chair David Moffett reached out to our largest institutional stockholders to solicit their feedback and input on our compensation programs in the fall of 2019, the Compensation Committee determined that the performance goals for the 2019-2021 PSUs would be measured over a three-year cumulative period instead of three separate one-year measurement periods. At its December 2019 meeting, the Compensation Committee set the specific targets and payout ranges for the 2019-2021 PSUs. Additional information regarding PSUs is included in the Compensation Discussion and Analysis section above. |
39 Form 10-K/A
|
Part III |
2019 Grants of Plan-Based Awards Table
| Award Type |
Approval Date(2) |
Grant Date(2) |
|
Estimated Future Payouts Under Equity Incentive Plan Awards (#)(1) |
All Other Stock Awards: Number of Shares of Stock or Units (#)(3) |
Grant Date Fair Value of Stock and Option Awards ($)(4) | ||||||||||||||||
| Name | Threshold | Target | Max | Threshold |
|
Target |
|
Max | ||||||||||||||
| Mr. McInerney | AI | 0 |
2,000,000 |
|
4,000,000 |
|
|
|
||||||||||||||
| PSU | 5/16/2019 | 12/13/2019 | 557,433 | 1,114,865 | 2,229,730 | 5,139,528 | ||||||||||||||||
| Ms. Groh | AI | 0 | 0 844,000 | 1,688,000 | ||||||||||||||||||
| RSU | 5/16/2019 | 5/16/2019 | 270,271 | 908,111 | ||||||||||||||||||
| PSU | 5/16/2019 | 12/13/2019 | 135,136 | 270,271 | 540,542 | 1,245,949 | ||||||||||||||||
| Mr. Sheehan | AI | 0 | 1,200,000 | 2,400,000 | ||||||||||||||||||
| RSU | 5/16/2019 | 5/16/2019 | 270,271 | 908,111 | ||||||||||||||||||
| PSU | 5/16/2019 | 12/13/2019 | 135,136 | 270,271 | 540,542 | 1,245,949 | ||||||||||||||||
| Mr. Schneider | AI | 0 | 1,125,000 | 2,250,000 | ||||||||||||||||||
| RSU | 5/16/2019 | 5/16/2019 | 270,271 | 908,111 | ||||||||||||||||||
| PSU | 5/16/2019 | 12/13/2019 | 135,136 | 270,271 | 540,542 | 1,245,949 | ||||||||||||||||
| Mr. Bobitz | AI | 0 | 575,000 | 1,150,000 | ||||||||||||||||||
| RSU | 5/16/2019 | 5/16/2019 | 101,352 | 340,543 | ||||||||||||||||||
|
PSU |
5/16/2019 |
12/13/2019 |
50,676 | 101,352 | 202,704 | 467,233 | ||||||||||||||||
| (1) |
The 2019-2021 PSUs may be earned and become vested based on our level of achievement of certain pre-established performance goals over the performance period ending on December 31, 2021. |
| (2) |
The Compensation Committee approved grants of 2019-2021 PSUs to the named executive officers on May 16, 2019; however, the specific performance goals applicable to the awards were not determined and communicated to participants until December 13, 2019, which is deemed to be the grant date of the awards for accounting purposes. |
| (3) |
The RSUs granted are scheduled to vest one-third per year beginning on the first anniversary of the grant date. |
| (4) |
Reflects the aggregate grant date fair value of the award determined in accordance with FASB ASC Topic 718. Grant date fair value for the RSUs is based on the grant date fair value of the underlying shares. Grant date fair value for the PSUs is based on the grant date fair value of the underlying shares at target performance and the probable outcome of performance-based conditions at the time of grant, excluding the effect of estimated forfeitures. |
Genworth Financial, Inc. 40
|
Part III |
Outstanding Equity Awards at 2019 Fiscal Year-End Table
The table below provides information with respect to stock options, SARs, RSUs and PSUs outstanding on December 31, 2019:
| Option Awards | Stock Awards | |||||||||||||||||
| Name | Number of Securities Underlying Unexercised Options (#) Exercisable |
Number of Securities Underlying Unexercised Options (#) Unexercisable |
Option Exercise Price ($) |
Option Expiration Date |
Number of Shares or Units of Stock That Have Not Vested (#) |
Market Value of Shares or Units of Stock That Have Not Vested ($)(4) |
Equity Incentive Plan Awards: Number of Unearned Shares, Units or Other Rights That Have Not Vested (#) |
Equity Incentive Plan Awards: Market or Payout Value of Unearned Shares, Units or Other Rights That Have Not Vested ($)(4) | ||||||||||
| Mr. McInerney | 1,200,000 | 0 | 7.90 | 01/02/2023 | 184,666 | (1) | 812,530 | 554,000 | (5) | 3,656,402 | ||||||||
| 492,666 | (2) | 2,167,730 | 739,000 | (6) | 6,503,200 | |||||||||||||
| 1,114,865 | (7) | 9,810,812 | ||||||||||||||||
| Ms. Groh | 39,000 | 0 | 14.18 | 02/10/2020 | 44,666 | (1) | 196,530 | 134,000 | (5) | 884,402 | ||||||||
| 24,000 | 0 | 12.75 | 02/09/2021 | 270,271 | (3) | 1,189,192 | 270,271 | (7) | 2,378,385 | |||||||||
| 30,000 | 0 | 8.88 | 02/14/2022 | |||||||||||||||
| 26,000 | 0 | 9.06 | 02/15/2023 | |||||||||||||||
| 14,650 | 0 | 15.23 | 02/20/2024 | |||||||||||||||
| Mr. Sheehan | 40,000 | 0 | 14.18 | 02/10/2020 | 67,333 | (1) | 296,265 | 202,000 | (5) | 1,333,200 | ||||||||
| 24,000 | 0 | 12.75 | 02/09/2021 | 270,271 | (3) | 1,189,192 | 270,271 | (7) | 2,378,385 | |||||||||
| 32,400 | 0 | 8.88 | 02/14/2022 | |||||||||||||||
| 120,000 | 0 | 5.96 | 10/31/2022 | |||||||||||||||
| 135,000 | 0 | 9.06 | 02/15/2023 | |||||||||||||||
| 100,000 | 0 | 15.23 | 02/20/2024 | |||||||||||||||
| 275,000 | 0 | 7.99 | 02/20/2025 | |||||||||||||||
| Mr. Schneider | 85,000 | 0 | 14.18 | 02/10/2020 | 89,666 | (1) | 394,530 | 269,000 | (5) | 1,775,402 | ||||||||
| 85,000 | 0 | 12.75 | 02/09/2021 | 270,271 | (3) | 1,189,192 | 270,271 | (7) | 2,378,385 | |||||||||
| 152,000 | 0 | 8.88 | 02/14/2022 | |||||||||||||||
| 200,000 | 0 | 5.96 | 10/31/2022 | |||||||||||||||
| 100,000 | 0 | 5.13 | 06/01/2022 | |||||||||||||||
| 215,000 | 0 | 9.06 | 02/15/2023 | |||||||||||||||
| 150,000 | 0 | 15.23 | 02/20/2024 | |||||||||||||||
| 265,000 | 0 | 7.99 | 02/20/2025 | |||||||||||||||
| Mr. Bobitz | 22,000 | 0 | 14.18 | 02/10/2020 | 28,333 | (1) | 124,665 | 85,000 | (5) | 561,000 | ||||||||
| 13,200 | 0 | 12.75 | 02/09/2021 | 101,352 | (3) | 445,949 | 101,352 | (7) | 891,898 | |||||||||
| 15,300 | 0 | 8.88 | 02/14/2022 | |||||||||||||||
| 17,000 | 0 | 9.06 | 02/15/2023 | |||||||||||||||
| 21,000 | 0 | 15.23 | 02/20/2024 | |||||||||||||||
| 90,000 | 0 | 7.99 | 02/20/2025 | |||||||||||||||
| (1) |
Remaining RSUs vested 100% on 3/15/2020. |
| (2) |
Remaining RSUs vest 50% on 5/22/2020 and 5/22/2021. |
| (3) |
RSUs vest one-third on 5/16/2020, 5/16/2021 and 5/16/2022. |
| (4) |
Market value is calculated based on the closing price of our common stock on December 31, 2019 of $4.40 per share. |
| (5) |
2017-2019 PSUs were earned and became vested based on our level of achievement of certain pre-established performance goals over the performance period ending on December 31, 2019. Amounts reported here reflect actual levels of achievement of the performance following the end of the performance period. For more information regarding the payout of these PSUs, see the Compensation Discussion and Analysis section above. |
41 Form 10-K/A
|
Part III |
| (6) |
2018-2020 PSUs may be earned and become vested based on our level of achievement of certain pre-established performance goals over the performance period ending on December 31, 2020. Amounts reported here reflect maximum levels of achievement of the performance goals pursuant to applicable reporting requirements. For more information regarding the 2018-2020 PSUs, see the Compensation Discussion and Analysis section above. |
| (7) |
2019-2021 PSUs may be earned and become vested based on our level of achievement of certain pre-established performance goals over the performance period ending on December 31, 2021. Amounts reported here reflect maximum levels of achievement of the performance goals pursuant to applicable reporting requirements. For more information regarding the 2019-2021 PSUs, see the 2019 Grants of Plan Based Awards Table and the Compensation Discussion and Analysis section above. |
2019 Options Exercised and Stock Vested Table
The table below provides information regarding stock options and SARs that were exercised and RSUs that vested during 2019. Net shares received by each named executive officer upon exercise or vesting of equity awards, after shares are withheld for taxes, are subject to the stock ownership guidelines and a 50% retention ratio, as well as the nine-month holding period policy with respect to exercises of stock options and SARs, each as described in the Compensation Discussion and Analysis section above.
| Option Awards | Stock Awards | |||||||
| Name | Number of Shares Underlying Options/SARs Exercised (#) |
Value Realized on Exercise ($)(1) |
Number of Shares Acquired on Vesting (#)(2) |
Value Realized on Vesting ($)(3) | ||||
| Mr. McInerney | 0 | 0 | 2,216,001 | 8,621,410 | ||||
| Ms. Groh | 0 | 0 | 326,642 | 1,296,516 | ||||
| Mr. Sheehan | 0 | 0 | 486,249 | 1,930,223 | ||||
| Mr. Schneider | 0 | 0 | 645,683 | 2,563,128 | ||||
| Mr. Bobitz | 23,500 | 50,525 | 165,433 | 656,960 | ||||
| (1) |
Reflects the excess of the fair market value of the underlying shares at the time of exercise over the base price of the stock options. Mr. Bobitz’s 2009 stock option grant, set to expire in 2019, was automatically exercised on his behalf pursuant to the terms of the plan. |
| (2) |
Reflects the gross number of shares received upon the vesting of RSUs and PSUs. Based on the tax withholding payment election, a portion of the shares reflected above may have been withheld to cover taxes due. |
| (3) |
Reflects the fair market value of the underlying shares as of the vesting date. |
Pension Benefits
The SERP is a non-qualified, defined benefit plan maintained to provide eligible executives with additional retirement benefits. The SERP was closed to new participants after December 31, 2009; therefore, Mr. McInerney was not eligible for the SERP when he joined the company in 2013. The annual SERP benefit is a life annuity equal to a fixed percentage multiplied by the participant’s years of benefit service, and the participant’s average annual compensation (based on the highest consecutive 36-month period within the last 120-month period prior to separation from service) with the result not to exceed 40% of the participant’s average annual compensation. Benefit service is defined as service since the plan’s inception date (September 27, 2005) or date of SERP participation, whichever is later. The SERP benefit is then reduced by the value of the participant’s account balance under the Retirement Account Feature of our Retirement and Savings Plan as converted to an annual annuity. Compensation for SERP purposes generally includes only base salary and annual cash incentive (each whether or not deferred).
Genworth Financial, Inc. 42
|
Part III |
The annual SERP benefit is calculated as described below:
|
SERP |
 |
1.45% x Average |
 |
1.1% x Average |
 |
Annuitized value |
Each participant in the SERP will partially vest with regard to their benefit when they reach age 55 and have earned five years of “future service” (i.e. service occurring after December 31, 2015). Once a SERP participant has earned five years of “future service” and has reached at least age 55, the participant will become partially vested based on a scale ranging from 50% at age 55 and increasing by 10% each year until the participant reaches full vesting at age 60. This could result in the potential for earlier partial vesting for participants if they complete the required years of “future service.” If a participant resigns before vesting, then his or her SERP benefit will be forfeited. Only in certain circumstances will the SERP become fully vested upon termination prior to age 60, as described in the Executive Compensation-Potential Payments upon Termination or Change of Control section below. Benefit payments under the SERP will begin following a participant’s qualifying separation from service, but not earlier than age 60. The SERP has no provisions for acceleration of payout before age 60. There are also no provisions for the granting of extra years of service. Material assumptions used to calculate the present value of the accumulated benefit are as follows:
| ● | The accumulated benefit represents the current accrued benefit first available at age 60 utilizing actual service and compensation as of December 31, 2019; |
| ● | Interest rate of 3.22%; |
| ● | Mortality prescribed in Section 417(e) of the Internal Revenue Code (the “Code”) for lump sum payments from qualified plans; |
| ● | Form of payment actuarially equivalent to a five-year certain and life benefit; and |
| ● | Payments are guaranteed for the life of the participant. |
All SERP benefit accruals will freeze as of December 31, 2020. In addition, existing SERP participants were offered an opportunity to make an irrevocable, one-time election before the end of 2015 to freeze their SERP benefit accruals early, effective December 31, 2015, and begin receiving restoration benefits under the Restoration Plan as of January 1, 2016 (Ms. Groh made this election; Messrs. Sheehan, Schneider, and Bobitz did not).
The table below reflects the present value of the accrued benefit as of December 31, 2019.
2019 Pension Benefits Table
| Name | Plan Name |
Number of Years Credited Service (#) |
Present Value of Accumulated Benefits ($) |
Payments During Last Fiscal Year ($) | ||||
| Mr. McInerney(1) | * | — | — | — | ||||
| Ms. Groh(2) | SERP | 10.33 | 921,722 | — | ||||
| Mr. Sheehan | SERP | 14.33 | 5,340,705 | — | ||||
| Mr. Schneider | SERP | 14.33 | 5,527,716 | — | ||||
| Mr. Bobitz | SERP | 14.33 | 2,690,064 | — |
| (1) |
The SERP was closed to new participants after December 31, 2009; therefore, Mr. McInerney was not eligible for the SERP when he joined the company in 2013. |
| (2) |
Ms. Groh elected to freeze her SERP benefit as of December 31, 2015 in order to begin receiving restoration benefits under our Restoration Plan as described in the Pension Benefits section above. |
43 Form 10-K/A
|
Part III |
Non-Qualified Deferred Compensation
The company maintains the Restoration Plan, a non-qualified defined contribution plan, which provides eligible executives, including our named executive officers, with benefits generally equal to any matching contributions that they are precluded from receiving under the 401(k) Savings Feature of our Retirement and Savings Plan as a result of restrictions under the Code (the “Restoration 401(k) Savings Feature”). For 2019, we provided a contribution credit equal to 5% of the participant’s eligible pay (base salary and annual cash incentive paid) in excess of the annual compensation limit in Section 401(a)(17) of the Code ($280,000 in 2019).
Since January 1, 2010, newly hired or promoted executive officers who were not already participants in the SERP have been eligible for up to two additional types of contributions within the Restoration Plan. For those eligible executive officers, the Restoration Plan provides supplemental benefits equal to the amount of contributions that executives are precluded from receiving under the Retirement Account Feature of our qualified Retirement and Savings Plan (the “Restoration Retirement Account Feature”). Current participants in the SERP will become eligible to receive Restoration Retirement Account Feature contributions effective as of the day their respective benefit accruals under the SERP become frozen, which was either on January 1, 2016 if they elected to freeze benefit accruals early (as Ms. Groh did), or on January 1, 2021 (applicable to Messrs. Sheehan, Schneider and Bobitz).
Participants become vested with respect to the Restoration 401(k) Savings Feature and Restoration Retirement Account Feature account balances as of the earlier of reaching age 60 or attaining three years of “future service” (i.e., service occurring after December 31, 2015).
In addition, certain executive officers are eligible for an additional 3% contribution credit on all eligible pay (the “Supplemental Contribution”). The Supplemental Contribution was closed to new participants after December 31, 2015, and is being eliminated entirely effective December 31, 2020. In 2019, Mr. McInerney was the only named executive officer eligible for this Supplemental Contribution provided under the Restoration Plan. The portion of the Restoration Plan balance attributable to the Supplemental Contribution vested upon his attainment of age 60 with at least five years of service.
Eligible executives, including our named executive officers, have had the opportunity to request that their Restoration Plan contribution credits (balances) be invested in or track a diverse array of generally available mutual fund investment options.
The company previously offered a voluntary Deferred Compensation Plan that provided participants with the ability to annually defer receipt of a portion of their base salary and/or annual incentive award in order to save and accumulate additional retirement funds on a before-tax basis. Earnings (and losses) were credited to executive accounts based on participant choices between 10 generally available mutual fund investment options. A participant could defer between 10% and 75% of his or her salary and between 25% and 85% of his or her annual incentive award and could elect to have such deferred amount, plus any earnings (or losses) thereon, paid upon the participant’s termination of employment (in a lump sum or over up to 10 annual installments), or elect to receive an in-service lump sum payment upon a specific date. Participants were always 100% vested in their Deferred Compensation Plan accounts. As of December 31, 2019, Ms. Groh and Mr. Bobitz were the only named executive officers who had a balance in the Deferred Compensation Plan. Effective for plan years beginning January 1, 2016, the company suspended future contributions to the plan.
Genworth Financial, Inc. 44
|
Part III |
2019 Non-Qualified Deferred Compensation Table
| Name | Plan Name | Executive Contributions in Last FY ($) |
Registrant Contributions in Last FY ($)(1) |
Aggregate Earnings in Last FY ($) |
Aggregate Withdrawals/ Distributions ($) |
Aggregate Balance at Last FYE ($)(2) | ||||||
| Mr. McInerney | Restoration | — | 394,800 | 410,811 | — | 2,848,191 | ||||||
| Ms. Groh | Restoration | — | 139,212 | 100,917 | — | 743,241 | ||||||
| Deferred Compensation | — | — | 33,233 | — | 180,883 | |||||||
| Mr. Sheehan | Restoration | — | 98,500 | 174,625 | — | 1,096,815 | ||||||
| Mr. Schneider | Restoration | — | 91,500 | 190,111 | — | 1,171,405 | ||||||
| Mr. Bobitz | Restoration | — | 47,760 | 56,522 | — | 377,227 | ||||||
| Deferred Compensation | — | — | 11,366 | — | 57,415 |
| (1) | Reflects company contributions to the Restoration Plan made in 2020, which are based on 2019 earnings. The contributions are reported as compensation for 2019 in the All Other Compensation column of the 2019 Summary Compensation Table. |
| (2) | Aggregate balances reported as of December 31, 2019 for the named executive officers include amounts that were reported in the Summary Compensation Tables for 2019 and years prior. For the Restoration Plan, the amount of compensation reported in the Summary Compensation Tables for 2019 and years prior is $2,266,815 for Mr. McInerney, $482,308 for Ms. Groh, $616,043 for Mr. Sheehan, $725,770 for Mr. Schneider, and $177,163 for Mr. Bobitz. |
Potential Payments upon Termination or Change of Control
The following tables and narrative disclosure summarize the (i) compensation and benefits payable to each of the named executive officers in the event of a termination of employment under various circumstances, assuming that such termination was effective as of December 31, 2019. The compensation and benefits described and quantified below are in addition to the compensation and benefits that would already be earned or vested upon such named executive officer’s termination, including accrued but unpaid salary, accrued and unused vacation pay, and payments and benefits accrued under our broad-based benefit programs, including any vested contributions we made under the 401(k) Savings and Retirement Account Features of our Retirement and Savings Plan.
Involuntary Termination of Employment (Without a Change of Control)
In December 2014, the Compensation Committee approved the 2015 Severance Plan, which became effective as of January 1, 2015, in order to promote the retention of a select group of key employees, including our named executive officers, by providing severance benefits in the event their employment is terminated under certain circumstances and to align with severance benefits commonly provided in our market for competing executive talent. The 2015 Severance Plan replaced the company’s prior severance plan, which expired by its terms on December 31, 2014.
In the event the employment of a named executive officer was terminated without “cause” or by the executive for “good reason” (as such terms are defined in the 2015 Severance Plan) during 2019, such named executive officer would be entitled to receive the following severance benefits under the 2015 Severance Plan:
| ● | Severance payment. The named executive officer would receive a lump sum cash severance payment, payable within 60 days of the date of termination in an amount equal to two times the sum of base salary and target annual incentive, in the case of Mr. McInerney, and one times base salary plus one times target annual incentive for the other named executive officers. |
| ● | Pro rata annual incentive award. The named executive officer would receive a lump sum cash payment based on the annual incentive award that would have been payable with respect to the fiscal year in which the qualified termination occurs (determined at the end of such year based on actual performance results), prorated to the nearest half month to reflect the portion of the fiscal year that had elapsed prior to the date of termination. |
45 Form 10-K/A
|
Part III |
| ● | Benefits payment. The named executive officer would receive a lump sum cash payment, payable within 60 days of the date of termination, equal to the monthly cost of the employer portion to provide the group medical, dental, vision, and/or prescription drug plan benefits the employee had been receiving before the termination, multiplied by 12. |
| ● | Partial vesting of time-based long-term incentive awards. Stock options, SARs, RSUs and other cash and equity awards with time-based vesting restrictions held by the named executive officer would become immediately vested as of the participant’s termination, but only with respect to a number of awards that otherwise would have become vested on the award’s next regularly scheduled vesting date based on continued employment (the remainder of such awards would be forfeited), and stock options and SARs would remain exercisable until the earlier of the first anniversary of the date of the qualified termination or the award’s regular expiration date. The named executive officers did not have any unvested stock options or SARs as of December 31, 2019. |
| ● | Vesting of performance-based long-term incentive awards. Performance-based equity and cash awards held by the named executive officer would remain outstanding and would be earned, if at all, based on actual performance through the end of the performance period, prorated to the nearest half-month to reflect the portion of the performance period year that had elapsed prior to the date of termination. |
| ● | Retirement plan provisions. The named executive officer would become fully vested in any funded or unfunded nonqualified pension, retirement or deferred compensation plans in which he or she participates, provided he or she has been employed by the company for at least five years. All named executive officers are already fully vested in the Restoration Plan balances as noted above in the 2019 Non-Qualified Deferred Compensation Plans Table. |
To receive severance benefits under the 2015 Severance Plan, the executive would have to execute and deliver to us a general release of claims and agree to certain restrictive covenants, including a 12-month non-compete provision, 24-month restrictions on the solicitation of customers and employees, and restrictions on the use of confidential information.
The following table summarizes the payments and benefits that would have been payable to the named executive officers under the 2015 Severance Plan and other retention incentives in the event of a termination without “cause” or by the executive for “good reason” on December 31, 2019.
Involuntary Termination of Employment (Without a Change of Control)
| Mr. McInerney | Ms. Groh | Mr. Sheehan | Mr. Schneider | Mr. Bobitz | |||||||||||
| Cash Severance(1) | $ | 6,000,000 | $ | 1,519,000 | $ | 1,800,000 | $ | 1,875,000 | $ | 1,150,000 | |||||
| Annual Incentive(2) | 2,500,000 | 1,030,000 | 1,610,000 | 1,370,000 | 700,000 | ||||||||||
| Payments Related to Health Benefits(3) | 17,209 | 6,643 | 24,601 | 23,432 | 27,574 | ||||||||||
| RSU Vesting(4) | 1,896,396 | 592,926 | 692,661 | 790,926 | 273,315 | ||||||||||
| PSU Vesting(5) | 9,627,004 | 1,280,800 | 1,729,597 | 2,171,800 | 709,650 | ||||||||||
| PCA Vesting(5) | N/A | 2,000,000 | 2,000,000 | 2,666,667 | 1,200,000 | ||||||||||
| SERP Vesting(6) | — | 921,722 | 5,340,705 | 5,527,716 | 2,690,064 | ||||||||||
| Total | $ | 20,040,609 | $ | 7,351,091 | $ | 13,197,564 | $ | 14,425,541 | $ | 6,750,603 | |||||
| (1) | Reflects a cash severance in the amount of two times the sum of base salary and target annual incentive in the case of Mr. McInerney, and one times base salary plus one times target annual incentive in the case of the other named executive officers. |
| (2) | Reflects an annual incentive award based on actual performance results through the end of 2019. Annual incentive awards under the 2015 Severance Plan are determined based on actual pro rata performance. |
| (3) | Represents a lump sum cash payment equal to the company cost of 12 months of continued health coverage. |
| (4) | Reflects the aggregate value of RSUs (based on the closing price of Genworth common stock on December 31, 2019 of $4.40) that would immediately vest as of the executive’s termination (the awards for which vesting would accelerate are those awards that would have become vested on the award’s next regularly scheduled vesting date based on continued employment). |
| (5) | Reflects the aggregate value of 2017-2019, 2018-2020 and 2019-2021 PSUs and 2018-2020 PCAs that would remain outstanding following the executive’s termination, and could be earned, if at all, at the end of the performance period based on actual results, prorated to the nearest half-month to reflect the portion of the performance period year that had elapsed prior to the date of termination. Reflects a payout of 2017-2019 PSUs based on actual performance through the end of the performance period, a pro rata payout of 2018-2020 PSUs and PCAs based on a maximum level of performance and a pro rata payout of 2019-2021 PSUs based on a target level of performance. |
| (6) | Reflects the present value of each participating named executive officer’s accumulated benefits under the SERP, as noted in the 2019 Pension Benefits Table, which would become fully vested. |
Genworth Financial, Inc. 46
|
Part III |
Involuntary Termination Following a Change of Control
In December 2014, the Compensation Committee adopted the 2014 Change of Control Plan in order to continue to provide severance benefits to a select group of key executives, including our named executive officers, in the event that the executive’s employment is terminated without “cause” or by the executive for “good reason” following a change of control of the company. If an executive becomes eligible to receive benefits under the 2014 Change of Control Plan, he or she will not be eligible to receive benefits under the 2015 Severance Plan. The 2014 Change of Control Plan replaced and consolidated the company’s two prior change of control plans. As noted on page 34, the “double-trigger” provisions of the change of control severance benefits apply to the Oceanwide transaction. Therefore, the payment of the change of control severance benefits requires that Genworth terminates an executive officer’s employment without “cause” or by the executive officer for “good reason” within two years after the close of the Oceanwide transaction.
Pursuant to the 2014 Change of Control Plan, a named executive officer would receive payments and benefits in the event of a termination of employment without “cause” or by the executive with “good reason” within two years following a change of control of the company (each a “Qualified Termination” as defined in the Change of Control Plan). In the event of a Qualified Termination during 2019, such named executive officer would be eligible to receive the following severance benefits under the 2014 Change of Control Plan:
| ● | Severance payment. The named executive officer would receive a lump sum cash severance payment in an amount equal to two and one-half times the sum of his base salary and target annual incentive in the case of Mr. McInerney, and two times the sum of his or her base salary and target annual incentive in the case of the other named executive officers, payable within 60 days following termination. |
| ● | Pro rata annual incentive award. The named executive officer would receive a lump sum cash payment based on the annual incentive award that would have been payable with respect to the fiscal year in which the Qualified Termination occurs (determined based on actual pro rata performance, to the extent such performance can be reasonably established, or otherwise based on an assumed achievement of all relevant performance goals at “target”), prorated to the nearest half-month to reflect the portion of the fiscal year that had elapsed prior to the Qualified Termination, and payable within 60 days following termination. |
| ● | Vesting of time-based long-term incentive awards. Stock options, SARs, RSUs and other cash and stock awards with time-based vesting restrictions held by the named executive officer would become immediately vested as of a Qualified Termination and would remain exercisable until the award’s regular expiration date. The named executive officers did not have any unvested stock options or SARs as of December 31, 2019. |
| ● | Vesting of performance-based long-term incentive awards. Performance-based equity and cash awards held by the named executive officer would become vested and be deemed earned based on actual pro rata performance as of the date of a Qualified Termination, to the extent such performance can be reasonably established, or otherwise based on an assumed achievement of all relevant performance goals at “target,” prorated to the nearest half-month to reflect the portion of the performance period that had elapsed prior to the Qualified Termination, and payable within 60 days following termination. |
| ● | Payment related to health and life insurance benefits. The named executive officer would receive a lump sum cash payment, payable within 60 days of the date of termination, equal to the monthly cost of the employer portion to provide the group medical, dental, vision, and/or prescription drug plan benefits the employee had been receiving before the qualified termination, multiplied by 18, and he or she would continue to receive life insurance coverage for 18 months. |
| ● | Retirement plan provisions. The named executive officer would become fully vested in any funded or unfunded nonqualified pension, retirement or deferred compensation plans in which he or she participates. All named executive officers are already fully vested in the Restoration Plan balances as noted above in the 2019 Non-Qualified Deferred Compensation Plans Table above as of December 31, 2019. |
47 Form 10-K/A
|
Part III |
The 2014 Change of Control Plan provides that in the event the participant would be subject to a 20% excise tax under Section 4999 of the Code (imposed on individuals who receive compensation in connection with a change of control that exceeds certain specified limits), the payments and benefits would be reduced to the maximum amount that does not trigger the excise tax, unless the executive would retain greater value (on an after-tax basis) by receiving all payments and benefits and paying all excise and income taxes.
The following table summarizes the payments and benefits that would have been payable to the named executive officers under the 2014 Change of Control Plan and other retention incentives in the event of a Qualified Termination as of December 31, 2019:
Involuntary Termination of Employment Following a Change of Control
| Mr. McInerney | Ms. Groh | Mr. Sheehan | Mr. Schneider | Mr. Bobitz | ||||||||||||
| Cash Severance(1) | $ | 7,500,000 | $ | 3,038,000 | $ | 3,600,000 | $ | 3,750,000 | $ | 2,300,000 | ||||||
| Annual Incentive(2) | 2,500,000 | 1,030,000 | 1,610,000 | 1,370,000 | 700,000 | |||||||||||
| Payments Related to Health Benefits(3) | 25,814 | 9,965 | 36,901 | 35,148 | 41,361 | |||||||||||
| RSU Vesting(4) | 2,980,261 | 1,385,723 | 1,485,458 | 1,583,723 | 570,614 | |||||||||||
| PSU Vesting(5) | 9,627,004 | 1,280,800 | 1,729,597 | 2,171,800 | 709,650 | |||||||||||
| PCA Vesting(5) | N/A | 2,000,000 | 2,000,000 | 2,666,667 | 1,200,000 | |||||||||||
| SERP Vesting(6) | — | 921,722 | 5,340,705 | 5,527,716 | 2,690,064 | |||||||||||
| Continued Life Insurance(7) | 35,583 | 17,043 | 17,942 | 38,362 | 27,655 | |||||||||||
| 280G Cut-Back(8) | — | (211,050 | ) | — | — | — | ||||||||||
| Total | $ | 22,668,662 | $ | 9,472,203 | $ | 15,820,603 | $ | 17,143,416 | $ | 8,239,344 | ||||||
| (1) | Reflects a lump sum cash severance payment, payable within 60 days of the date of termination in an amount equal to two and one-half times the sum of base salary and target annual incentive in the case of Mr. McInerney, and two times base salary plus two times target annual incentive in the case of the other named executive officers. |
| (2) | Reflects lump sum cash payment of the current-year annual incentive award based on actual performance results through the end of 2019. Annual incentive awards under the 2014 Change of Control Plan are determined based on actual pro rata performance, to the extent such performance can be reasonably established, or otherwise based on an assumed achievement of all relevant performance goals at “target.” |
| (3) | Represents a lump sum cash payment equal to the company cost of 18 months of continued health coverage. |
| (4) | Reflects the aggregate value of RSUs (based on the closing price of Genworth common stock on December 31, 2019 of $4.40) that would immediately vest as of the executive’s termination. |
| (5) | Pursuant to the 2014 Change of Control Plan, 2017-2019, 2018-2020 and 2019-2021 PSUs and 2018-2020 PCAs would become vested and be deemed earned based on actual pro rata performance as of the date of a participant’s Qualified Termination, to the extent such performance can be reasonably established in the sole discretion of the Compensation Committee, or otherwise based on an assumed achievement of all relevant performance goals at “target.” Amounts in the table above reflect the aggregate value of 2017-2019 PSUs (based on the closing price of Genworth common stock on December 31, 2019 of $4.40) based on actual performance through the end of the performance period, a pro rata payout of 2018-2020 PSUs and PCAs based on a maximum level of performance and a pro rata payout of 2019-2021 PSUs based on a target level of performance. |
| (6) | Reflects the present value of each participating named executive officer’s accumulated benefits under the SERP, as noted in the 2019 Pension Benefits Table, which would become fully vested. |
| (7) | Reflects the estimated value of premium payments for 18 months of continued coverage under the Leadership Life and Executive Life Programs. |
| (8) | If an executive’s total parachute payments exceed the 280G threshold amount by less than 10%, then the compensation payable to the executive will be reduced such that the total parachute payments to the executive do not exceed the 280G threshold amount (the amount of any such reduction is referred to as a “280G Cut-Back”). |
Death or Disability
In the event of death or total disability, named executive officers (or their designated beneficiary) would generally be eligible to receive the following:
| ● | Long-Term Incentive Awards. In the event of death: (i) all unvested stock options and SARs would become vested and exercisable; (ii) all unvested RSUs would become vested; (iii) any unvested PSUs or PCAs granted prior to 2019 and held for at least one year would become vested on a pro rata basis as of the date of termination based on the number of full months elapsed from the inception of the performance |
Genworth Financial, Inc. 48
|
Part III |
| period until the date of termination; and (iv) any unvested PSUs granted in 2019 or later would become vested on a pro rata basis as of the date of termination based on the number of full months elapsed from the inception of the performance period until the date of termination. Furthermore, all such performance-based awards would pay out at the end of the regular performance period based on actual performance. In the event of termination due to total disability, the treatment of outstanding stock options, SARs, RSUs, PCAs and PSUs is the same as in the event of death. The named executive officers did not have any unvested stock options or SARs as of December 31, 2019. | |
| ● | Annual Incentive. Named executive officers (or their designated beneficiary) would receive a pro-rated portion of any annual incentive award, based on actual performance results. |
| ● | Retirement Programs. Executive officers (or their designated beneficiary) would become vested in the SERP benefits shown in the 2019 Pension Benefits Table. Named executive officers are vested in the balance of the Restoration Plan reported in the 2019 Non-Qualified Deferred Compensation Table (which includes the 2019 contribution to the Restoration Plan, based on 2019 compensation) as of December 31, 2019. |
| ● | Life Insurance Programs. In the event of death, the beneficiary of the named executive officer would receive payments pursuant to the Leadership Life and Executive Life Programs in the form of death benefits. In the event of disability, the named executive officer would receive one year of continued Leadership Life Program premiums. |
The following table summarizes the payments and benefits payable to the named executive officers (or their designated beneficiary) in the event of death or total disability as of December 31, 2019:
Death or Disability
| Mr. McInerney | Ms. Groh | Mr. Sheehan | Mr. Schneider | Mr. Bobitz | ||||||||||||||||||||||||||
| Death | Disability | Death | Disability | Death | Disability | Death | Disability | Death | Disability | |||||||||||||||||||||
| RSU Vesting(1) | $ | 2,980,261 | $ | 2,980,261 | $ | 1,385,723 | $ | 1,385,723 | $ | 1,485,458 | $ | 1,485,458 | $ | 1,583,723 | $ | 1,583,723 | $ | 570,614 | $ | 570,614 | ||||||||||
| PSU Vesting(2) | 9,627,004 | 9,627,004 | 1,280,800 | 1,280,800 | 1,729,597 | 1,729,597 | 2,171,800 | 2,171,800 | 709,650 | 709,650 | ||||||||||||||||||||
| PCA Vesting(2) | N/A | N/A | 2,000,000 | 2,000,000 | 2,000,000 | 2,000,000 | 2,666,667 | 2,666,667 | 1,200,000 | 1,200,000 | ||||||||||||||||||||
| Pro-Rated Annual Incentive Award(3) |
2,500,000 | 2,500,000 | 1,030,000 | 1,030,000 | 1,610,000 | 1,610,000 | 1,370,000 | 1,370,000 | 700,000 | 700,000 | ||||||||||||||||||||
| SERP Vesting(4) | — | — | 921,722 | 921,722 | 5,340,705 | 5,340,705 | 5,527,716 | 5,527,716 | 2,690,064 | 2,690,064 | ||||||||||||||||||||
| Leadership Life Program(5) |
2,000,000 | 17,415 | 2,000,000 | 7,541 | 2,000,000 | 7,014 | 2,000,000 | 20,246 | 2,000,000 | 13,776 | ||||||||||||||||||||
| Executive Life Program(6) |
1,746,725 | — | 1,746,725 | — | 1,785,395 | — | 1,734,605 | — | 1,746,725 | — | ||||||||||||||||||||
| Total | $ | 18,853,990 | $ | 15,124,680 | $ | 10,364,970 | $ | 6,625,786 | $ | 15,951,155 | $ | 12,172,774 | $ | 17,054,511 | $ | 13,340,152 | $ | 9,617,053 | $ | 5,884,104 | ||||||||||
| (1) | Reflects the aggregate value of RSUs (based on the closing price of Genworth common stock on December 31, 2019 of $4.40) which would immediately vest as of the executive’s death or total disability. |
| (2) | Reflects a payout of 2017-2019 PSUs based on actual amounts awarded, a pro rata payout of 2018-2020 PSUs and PCAs based on a maximum level of performance, and a pro rata payout of 2019-2021 PSUs based on a target level of performance. |
| (3) | Reflects a pro rata portion of any annual incentive award, based on actual performance results. |
| (4) | Reflects the present value of each participating named executive officer’s accumulated benefits under the SERP, as noted in the 2019 Pension Benefits Table, which would become fully vested. |
| (5) | Represents death benefits payable to the named executive officer’s beneficiary in the event of death, or the value of one year of continued premium payments in the event of total disability. |
| (6) | Pursuant to the terms of the Executive Life Program, we will use the proceeds from a company-owned life insurance policy to pay the named executive officer’s beneficiary a $1 million payment, plus a gross-up on federal and state income taxes related to that payment. |
49 Form 10-K/A
|
Part III |
Retirement
Each of our executive benefit and compensation programs has varying retirement definitions. Upon a voluntary termination, a retirement-eligible executive would be eligible to receive the following:
| ● | Retirement Programs. The current definition of retirement for purposes of the SERP is attainment of age 60 with five years of service. As described above, participants in the SERP may partially vest sooner after they reach age 55 and have earned five years of “future service” (i.e., service occurring after December 31, 2015) based on a scale ranging from 50% at age 55 and increasing by 10% each year until the participant reaches full vesting at age 60. The SERP was closed to new participants effective January 1, 2010; therefore, Mr. McInerney is not eligible for our SERP. The Restoration Plan currently vests upon termination if the participant is at least age 60 with respect to the Restoration 401(k) Savings and Restoration Retirement Account Feature account balances, and after age 60 with five years of service with respect to any Supplemental Contribution account balance. |
| As amended and described above, the Restoration Plan may also become vested after attaining three years of “future service” (i.e., service occurring after December 31, 2015) with respect to the Restoration 401(k) Savings Feature and Restoration Retirement Account Feature (there is no change to the vesting requirements for Supplemental Contributions). Benefits will be paid from the Restoration Plan in 10 annual installments if the account balance is $50,000 or more at retirement or paid in a lump sum if the account balance is less than $50,000 at retirement. | |
| ● | Life Insurance Programs. The definition of retirement under the Leadership Life Program is age 60 with 10 years of service. If this eligibility is met, we will continue to pay Leadership Life Program premiums until the later of age 65 or until a total of 10 annual premium payments have been made. For participants under the Executive Life Program prior to January 1, 2007, we will continue to pay the premium if the executive retires at age 60 with 10 years of service. For participants who joined the Executive Life Program after January 1, 2007, coverage will cease at termination. |
| ● | Long-Term Incentive Awards. All unvested stock option, SAR and RSU awards that have been held for one year at the time of retirement would immediately vest and become exercisable if the participant is at least age 60 with five years of service at retirement. PSUs and PCAs would become vested on a pro rata basis, based on actual performance for the entire performance period. |
Mr. McInerney was the only named executive officer eligible for retirement under definitions of retirement for many of the plans in 2019. He became fully vested in January 2019 in the Restoration Plan balance noted in the Non-Qualified Deferred Compensation Table above upon meeting the required age and service requirements. Assuming retirement on December 31, 2019, Mr. McInerney would have been eligible to receive the following payments and benefits:
Retirement
| Mr. McInerney | |||
| RSU Vesting(1) | $ | 2,980,261 | |
| PSU Vesting(2) | 7,991,869 | ||
| Pro-Rated Annual Incentive Award(3) | 2,500,000 | ||
| Total | $ | 13,472,130 | |
| (1) | Reflects the aggregate value of RSUs (based on the closing price of Genworth common stock on December 31, 2019 of $4.40) which would immediately vest as of the executive’s retirement. |
| (2) | Based on current progress towards goals, the table reflects a payout of 2017-2019 PSUs based on actual amounts awarded and a pro-rata payout of 2018-2020 PSUs based on a maximum level of performance (in each case based on the closing price of Genworth common stock on December 31, 2019 of $4.40). Performance-based equity awards that have been held for less than one year at the time of termination are forfeited, and therefore, Mr. McInerney would have forfeited his 2019-2021 PSUs granted on May 16, 2019. |
| (3) | Reflects a pro rata portion of any annual incentive award, based on actual performance results. |
Genworth Financial, Inc. 50
|
Part III |
CEO Pay Ratio
The CEO pay ratio figures below are a reasonable estimate calculated in a manner consistent with Item 402(u) of Regulation S-K under the Exchange Act.
We determined that as of December 31, 2019, our total number of U.S. employees was 2,896 and our total number of non-U.S. employees was 269. We excluded from this employee population a total of 52 employees from: Mexico (39), India (12), and Hong Kong (1), as the total number of employees from these non-U.S. jurisdictions was less than 5% of our total employee population.
As previously disclosed, on December 12, 2019, we completed the sale of our majority interest in Genworth Canada. With the divestiture of this subsidiary, 258 employees were removed from our employee population, which we consider to potentially have a significant impact on our pay ratio assessment. Consequently, we have identified our median employee based on the employee population as of December 31, 2019.
To determine our median employee pay, we chose the sum of base salary and target annual incentive as our consistently applied compensation measure. For hourly employees, we used their anticipated hours worked to determine annual base pay. Using this methodology, and after ranking all included employees by this measurement, we identified the median employee for 2019, and calculated their total annual compensation.
This median employee’s total annual compensation for 2019 was $90,616. The annual total compensation of our CEO for 2019, as shown in the Summary Compensation Table, was $9,102,634. Accordingly, the ratio of CEO pay to median employee pay was 100:1.
Compensation of Directors
The Nominating Committee has the responsibility for annually reviewing and recommending to the Board compensation and benefits for “non-management directors.” Non-management directors are those directors who are not executive officers of Genworth or its affiliates. Accordingly, all directors, other than Mr. McInerney, are regarded as non-management directors. Mr. McInerney does not receive any compensation for serving as a director. As part of its 2019 review, the Nominating Committee engaged Steven Hall & Partners, LLC to provide competitive market data and advice regarding non-management director compensation. Based on its review, the Nominating Committee determined not to recommend any changes to the company’s non-management director compensation and benefits program.
In 2019, the company’s compensation components for non-management directors were as follows:
| Cash | DSUs | Total | |||||||
| Annual Retainer | $ | 100,000 | $ | 142,000 | $ | 242,000 | |||
| Annual Retainer for Non-Executive Chairman | $ | 80,000 | $ | 120,000 | $ | 200,000 | |||
| Annual Retainer for Lead Director | $ | 20,000 | |||||||
| Annual Retainer for Committee Chairs | |||||||||
| Audit | $ | 23,000 | |||||||
| Management Development and Compensation | $ | 16,000 | |||||||
| Other Committees | $ | 12,000 | |||||||
| ● | Annual Retainer. Each non-management director is paid an annual retainer of $242,000 in quarterly installments, following the end of each quarter of service. Of this amount, $100,000 of the annual retainer is paid in cash and $142,000 is paid in deferred stock units (“DSUs”). Instead of receiving a cash payment, non-management directors may elect to have 100% of their annual retainer paid in DSUs; provided, however, that no more than 30,000 DSUs may be granted to any non-management director in any one calendar year. To the extent this limit would be exceeded, the remainder of a director’s annual retainer will be paid in cash. |
51 Form 10-K/A
|
Part III |
| ● | Annual Retainer for Non-Executive Chairperson. As additional compensation for service as Non-Executive Chairperson, the Non-Executive Chairperson receives a $200,000 annual retainer in addition to the regular annual retainer. Such amount is paid in quarterly installments, following the end of each quarter of service. Of this amount, $80,000 is paid in cash and $120,000 is paid in DSUs. Instead of receiving a cash payment, the Non-Executive Chairperson may elect to have 100% of the additional annual retainer paid in DSUs; provided, however, that no more than 25,000 DSUs may be granted to the Non-Executive Chairperson in any one calendar year with respect to the additional annual retainer. To the extent this limit would be exceeded, the remainder of the additional annual retainer will be paid in cash. |
| ● | Fee for Lead Director. If a Lead Director is appointed in the absence of an independent Non-Executive Chairperson, the Lead Director would receive an annual cash retainer of $20,000 in quarterly installments, as additional compensation for service as Lead Director. |
| ● | Fees for Committee Chairs. As additional compensation for service as chairperson of a committee, each chairperson will receive an additional annual cash retainer payable in quarterly installments, as follows: Audit Committee chair, $23,000; Management Development and Compensation Committee chair, $16,000; and each other standing committee chair, $12,000. |
| ● | Deferred Stock Units. The number of DSUs granted is determined by dividing the DSU value to be delivered by the fair market value of our common stock on the date of grant. Each DSU represents the right to receive one share of our common stock in the future, following termination of service as a director, as set forth below. DSUs accumulate regular quarterly dividends, if any, which are reinvested in additional DSUs. The DSUs will be settled in shares of common stock on a one-for-one basis beginning one year after the director leaves the Board in a single installment or installments over ten years, at the election of the director. Additionally, grants of DSUs made after January 1, 2010, regardless of whether a non-management director elects to convert his DSUs on a single date or in a series of annual installments, will convert and settle in shares of common stock earlier upon the death of the non-management director. |
The company’s benefits for non-management directors in 2019 are as follows:
| ● | Matching Gift Program. The company offers a matching gift program that provides for the matching of employee and director charitable contributions pursuant to the contribution guidelines established by the Genworth Foundation. Each non-management director is eligible for such charitable contributions to be matched on a 50% basis, up to a maximum matching contribution of $10,000 during any calendar year. |
| ● | Reimbursement of Certain Expenses. Non-management directors are reimbursed for reasonable travel and other Board-related expenses, including expenses to attend Board and committee meetings, other business-related events and director education seminars, in accordance with policies approved from time to time. |
The following table sets forth information concerning compensation paid or accrued by us in 2019 to our non-management directors:
2019 Director Compensation Table
| Name | Fees Earned or Paid in Cash ($)(1) |
Stock Awards ($)(2)(3) |
All Other Compensation ($)(4) |
Total ($) | ||||||||
| William H. Bolinder(5) | $ | 123,662 | $ | 81,373 | $ | 10,000 | $ | 215,036 | ||||
| G. Kent Conrad(6) | 133,994 | 81,373 | — | 215,367 | ||||||||
| Melina E. Higgins | 126,494 | 81,373 | 8,333 | 216,200 | ||||||||
| David M. Moffett | 142,494 | 81,373 | 5,000 | 228,867 | ||||||||
| Thomas E. Moloney | 138,494 | 81,373 | 10,000 | 229,867 | ||||||||
| Debra J. Perry | 126,494 | 81,373 | 6,500 | 214,367 | ||||||||
| Robert P. Restrepo Jr. | 149,494 | 81,373 | 10,000 | 240,867 | ||||||||
| James S. Riepe | 230,408 | 149,083 | 7,500 | 386,991 | ||||||||
| (1) | Amounts include the portion of the annual retainer (described above) that was paid in cash. Messrs. Bolinder, Conrad, Moffett, Moloney, Restrepo and Riepe and Mses. Higgins and Perry reached the maximum deferral of 30,000 DSUs with their fourth quarter retainer payment and Mr. Riepe reached the maximum deferral of 25,000 DSUs as Non-Executive Chairman of the Board with his fourth quarter retainer payment; therefore, a portion of their fourth quarter payment was made in cash. Amounts also include applicable committee chair fees and the cash portion of the retainer for the Non-Executive Chairman of the Board of Directors. |
Genworth Financial, Inc. 52
|
Part III |
| (2) | Reflects the aggregate grant date fair value of DSUs, determined in accordance with FASB ASC Topic 718. The fair value of stock unit awards for purposes of Topic 718 typically equals the price of the underlying stock on the date of grant; however, amounts in the table are lower because the DSUs do not convert to transferable shares until one year after the director leaves the Board of Directors, and Topic 718 provides that the impact of transferability restrictions that remain in place after an award of stock based compensation vests may be considered when determining the fair value of the award for accounting purposes. The Finnerty option pricing model was, therefore, used to factor in these post-vest holding requirements with the following assumptions: (i) expected post vesting restriction period of 7.9 years; (ii) expected volatility of 82.0%; (iii) risk-free interest rate of 1.60%; (iv) expected dividend yield of 0.00%; and (v) calculated discount for post vest restriction period of 31.8%. |
| (3) | The following table shows for each non-management director the total number of DSUs held as of December 31, 2019 (rounded down to the nearest whole share): |
| Name | Total Number of DSUs Held as of December 31, 2019 | |
| William H. Bolinder | 199,671 | |
| G. Kent Conrad | 162,832 | |
| Melina E. Higgins | 157,837 | |
| David M. Moffett | 171,725 | |
| Thomas E. Moloney | 207,415 | |
| Debra J. Perry | 91,403 | |
| Robert P. Restrepo Jr. | 91,403 | |
| James S. Riepe | 402,055 |
| (4) | Amounts reflect company charitable match contributions. |
| (5) | Mr. Bolinder did not stand for re-election at our 2019 annual meeting of stockholders on December 12, 2019 and therefore retired from the Board of Directors effective that date. |
| (6) | On May 15, 2019, Mr. Bolinder stepped down from, and Mr. Conrad was appointed to serve as, chair of the Nominating Committee. As a result, each of Mr. Bolinder and Mr. Conrad received a portion of the annual retainer fee for Nominating Committee chair in 2019. |
Director Stock Ownership Policy
To help promote the alignment of the personal interests of the company’s non-management directors with the interests of our stockholders, we have established a robust stock ownership policy for all non-management directors. Under the policy, each non-management director is expected to hold common stock and/or DSUs while serving as a director of Genworth having a value equal to five times the value of the cash portion of the annual retainer payable to non-management directors, which is currently $100,000. Therefore, the ownership guideline is $500,000. Non-management directors are expected to satisfy this ownership guideline over time after their initial appointment to the Board and are not permitted to sell any shares of Genworth common stock received from us until the ownership guideline has been met. The DSUs held by the non-management directors settle in shares of common stock beginning one year after the director leaves the Board of Directors in a single payment or in payments over 10 years, at the election of the director, or earlier upon the death of the director.
53 Form 10-K/A
|
Part III |
The following table shows the stock ownership as of December 31, 2019, of our current non-management directors, the percentage of the ownership guideline that they have reached, and the number of years that have elapsed since the director was initially made subject to the policy. The value of each non-management director’s stock ownership is based on the closing price of our common stock on December 31, 2019 ($4.40).
2019 Director Stock Ownership
| Name | Number of Shares / DSUs Held (#) |
Value as of December 31, 2019 ($) |
Stock Held as % of Ownership Guideline |
Years Subject to Ownership Policy | |||||
| William H. Bolinder | 202,671 | $ | 891,752 | >100% | 9 | ||||
| G. Kent Conrad | 162,832 | $ | 716,461 | >100% | 6 | ||||
| Melina E. Higgins | 157,837 | $ | 694,483 | >100% | 6 | ||||
| David M. Moffett | 171,725 | $ | 755,590 | >100% | 7 | ||||
| Thomas E. Moloney | 218,415 | $ | 961,026 | >100% | 10 | ||||
| Debra J. Perry | 91,403 | $ | 402,173 | 80% | 3 | ||||
| Robert P. Restrepo Jr. | 91,403 | $ | 402,173 | 80% | 3 | ||||
| James S. Riepe | 470,055 | $ | 2,068,242 | >100% | 13 | ||||
Genworth Financial, Inc. 54
|
Part III |
| Item 12. | Security Ownership of Certain Beneficial Owners and Management and Related Stockholder Matters |
Information Relating to Directors, Executive Officers and Significant Stockholders
Ownership of Genworth Common Stock
The following table sets forth information as of March 2, 2020, except as indicated in the footnotes to the table, regarding the beneficial ownership of our common stock by:
| ● | all persons (including any “group” as that term is used in Section 13(d)(3) of the Exchange Act) known by us to own beneficially more than 5% of any class of our common stock (based on the most recently available information filed with the SEC); |
| ● | the named executive officers included in the 2019 Summary Compensation Table as set forth in Item 11; |
| ● | each of our current directors; and |
| ● | all current directors and executive officers as a group. |
Beneficial ownership is determined in accordance with the rules of the SEC. Except as indicated in the footnotes to the table, each of the directors and executive officers possesses sole voting and investment power with respect to all shares set forth opposite his or her name. In computing the number of shares beneficially owned by a person and the percentage ownership of that person, shares of common stock issuable upon the exercise of stock options or SARs or upon the conversion of RSUs held by that person that are currently exercisable or convertible, or are exercisable or convertible within 60 days of March 2, 2020, are deemed to be issued and outstanding. These shares, however, are not deemed outstanding for purposes of computing percentage ownership of any other stockholder. The number of shares issuable upon exercise of SARs is calculated based on the excess of the closing price of our common stock on March 2, 2020 over the base price of the SARs. As of March 2, 2020, there were 504,767,950 shares of common stock outstanding and no shares of any other class of voting securities outstanding.
The address of each director and executive officer listed below is c/o Genworth Financial, Inc., 6620 West Broad Street, Richmond, Virginia 23230.
Ownership of Genworth Common Stock
| Beneficial Ownership | Other Non-Management Director Stock-Based Holdings(1) | ||||||
| Name of Beneficial Owner | Number of Shares |
Percentage | |||||
| BlackRock, Inc.(2) | 59,792,202 | 11.9 | % | ||||
| The Vanguard Group, Inc.(3) | 47,171,375 | 9.36 | % | ||||
| Thomas J. McInerney(4) | 2,655,854 | * | |||||
| Kevin D. Schneider(5) | 1,023,317 | * | |||||
| Daniel J. Sheehan IV(6) | 815,698 | * | |||||
| Kelly L. Groh(7) | 515,637 | * | |||||
| Ward E. Bobitz(8) | 319,286 | * | |||||
| G. Kent Conrad | — | — | 162,832 | ||||
| Melina E. Higgins | — | — | 157,837 | ||||
| David M. Moffett | — | — | 171,725 | ||||
| Thomas E. Moloney | 11,000 | * | 207,415 | ||||
| Debra J. Perry | — | — | 91,403 | ||||
| Robert P. Restrepo Jr. | — | — | 91,403 | ||||
| James S. Riepe | 68,000 | * | 402,055 | ||||
| All directors and executive officers as a group (13 persons)(9) | 5,408,792 | 1.07 | % | ||||
| * | Less than 1%. |
55 Form 10-K/A
|
Part III |
| (1) | Represents DSUs held by the non-management directors that settle in shares of common stock beginning one year after the director leaves the Board in a single payment or in payments over 10 years, at the election of the director, or earlier upon the death of the director. See Item 11—Compensation of Directors for more information regarding DSUs. |
| (2) | Information obtained solely by reference to the Schedule 13G/A filed with the SEC on February 4, 2020 by BlackRock, Inc. (“BlackRock”). BlackRock reported that it has sole power to vote or direct the vote of 58,344,209 shares and that it has sole power to dispose or to direct the disposition of 59,792,202 shares. The address for BlackRock is 55 East 52nd Street, New York, NY 10055. |
| (3) | Information obtained solely by reference to the Schedule 13G/A filed with the SEC on February 12, 2020 by The Vanguard Group, Inc. (“Vanguard”). Vanguard reported that it has sole power to vote or direct the vote of 484,561 shares that it beneficially owns, and has shared power to vote or direct to vote of 95,243 shares, and that it has sole power to dispose or to direct the disposition of 46,653,624 shares and has shared power to dispose or to direct the disposition of 517,751 shares. Vanguard further reported that (a) Vanguard Fiduciary Trust Company, a wholly-owned subsidiary of Vanguard, is the beneficial owner of 422,508 shares, or 0.08%, of our common stock as a result of its serving as investment manager of collective trust accounts and (b) Vanguard Investments Australia, Ltd., a wholly-owned subsidiary of The Vanguard Group, Inc., is the beneficial owner of 157,296 shares, or 0.03%, of our common stock as a result of its serving as investment manager of Australian investment offerings. The address for Vanguard is 100 Vanguard Blvd., Malvern, Pennsylvania 19355. |
| (4) | Includes 184,666 shares of common stock in the form of restricted stock units that are scheduled to vest within 60 days of the calculation date; also includes 492,666 shares of common stock in the form of restricted stock units that would vest immediately if Mr. McInerney were to retire. |
| (5) | Includes 89,666 shares of common stock in the form of restricted stock units that are scheduled to vest within 60 days of the calculation date. |
| (6) | Includes 67,333 shares of common stock in the form of restricted stock units that are scheduled to vest within 60 days of the calculation date. |
| (7) | Includes 44,666 shares of common stock in the form of restricted stock units that are scheduled to vest within 60 days of the calculation date. |
| (8) | Includes 28,333 shares of common stock in the form of restricted stock units that are scheduled to vest within 60 days of the calculation date. |
| (9) | Represents ownership by all current directors and executive officers. |
Ownership of Public Company Genworth Subsidiary
Genworth Mortgage Insurance Australia Limited
In May 2014, Genworth Mortgage Insurance Australia Limited (“Genworth Australia”), our indirect, majority-owned subsidiary, completed an initial public offering of its common shares. As of March 2, 2020, we beneficially owned approximately 52% of the common shares of Genworth Australia. The following table sets forth information as of March 2, 2020, regarding the beneficial ownership of the common shares of Genworth Australia by the named executive officers and all of our directors and executive officers as a group. As of March 2, 2020, none of our current directors beneficially owned any common shares of Genworth Australia. Beneficial ownership is determined in accordance with the rules of the SEC. The executive officers that hold Genworth Australia common shares possess sole voting and investment power with respect to all shares set forth by their name. As of March 2, 2020, there were 412,514,184 common shares of Genworth Australia outstanding and no shares of any other class of voting securities outstanding.
| Beneficial Ownership | |||||
| Name of Beneficial Owner | Number of Shares |
Percentage | |||
| Thomas J. McInerney | — | — | |||
| Kelly L. Groh | — | — | |||
| Kevin D. Schneider | 33,419 | * | |||
| Ward E. Bobitz | — | — | |||
| Daniel J. Sheehan IV | — | — | |||
| All directors and executive officers as a group (13 persons)(1) | 33,419 | * | |||
| * | Less than 1%. |
| (1) | Represents ownership by all current directors and executive officers. |
Genworth Financial, Inc. 56
|
Part III |
Equity Compensation Plans
The following table gives information as of December 31, 2019 about common stock that may be issued under all of our existing equity compensation plans:
| Plan Category | (a) Number of Securities to be Issued Upon Exercise of Outstanding Options, Warrants and Rights(2) |
(b) Weighted-Average Exercise Price of Outstanding Options, Warrants and Rights(3) |
(c) Number of Securities Remaining Available for Future Issuance Under Equity Compensation Plans (Excluding Securities Reflected in Column(a))(4) | ||||
| Equity Compensation Plans Approved by Shareholders(1) |
14,166,747 | $ | 14.17 | 16,222,591 | |||
| (1) | 2004 Genworth Financial, Inc. Omnibus Incentive Plan, 2012 Genworth Financial, Inc. Omnibus Incentive Plan and 2018 Genworth Financial, Inc. Omnibus Incentive Plan. |
| (2) | Includes shares issuable pursuant to the exercise or conversion of stock options, SARs, RSUs, PSUs and DSUs. The number of shares issuable upon exercise of SARs is calculated based on the excess, if any, of the closing price of our common stock on December 31, 2019 of $4.40 over the base price of the SARs. The number of shares issuable upon conversion of PSUs is calculated based on maximum payout levels until the performance period closes and the award settles. |
| (3) | Calculation of weighted-average exercise price of outstanding awards includes SARs (which are exercisable for shares of common stock for no consideration) and stock options, but does not include RSUs, PSUs and DSUs that convert to shares of common stock for no consideration. The weighted-average exercise price of outstanding stock options is $14.17. The weighted-average base price of outstanding SARs is $10.09. |
| (4) | Reflects shares reserved and available for future issuance under the 2018 Genworth Financial, Inc. Omnibus Incentive Plan. Under the Plan, each stock option and SAR counts as one share against the share reserve, and each full-value award counts as 1.25 shares against the share reserve. Accordingly, a total of approximately 12,978,072 shares are available for issuance pursuant to grants to full-value stock awards. |
Changes in Control
On October 21, 2016, Genworth entered into the Merger Agreement with Parent and Merger Sub, pursuant to which Merger Sub will merge with and into Genworth, subject to the terms and conditions of the Merger Agreement, with Genworth surviving the Merger as an indirect, wholly owned subsidiary of Asia Pacific Insurance, which is owned by Oceanwide. The transaction has received all required U.S. insurance regulatory approvals. Oceanwide will continue focusing on the final steps needed to complete the Merger, which include finalizing the details of its financing plan, then discussing currency conversion and transfer of funds with China’s State Administration of Foreign Exchange (SAFE).
57 Form 10-K/A
|
Part III |
| Item 13. | Certain Relationships and Related Transactions, and Director Independence. |
Certain Relationships and Related Transactions
Our Board of Directors has established a policy, which is set forth in our Governance Principles, that Genworth will not enter into a transaction with a “related person” except in circumstances where there is a verifiable Genworth business interest supporting the transaction and the transaction otherwise meets Genworth’s standards that apply to similar transactions with unaffiliated entities or persons. For purposes of our policy, “related person” means any of our executive officers, directors, nominees for director, any persons known by us to beneficially own in excess of 5% of any class of our voting securities, any person who is an immediate family member of the foregoing and any firm, corporation or other entity in which any of the foregoing persons is an executive officer, general partner, principal or in a similar position or in which such person is deemed to have a 10% or greater beneficial ownership interest. Our policy applies to all transactions with “related persons,” including modifications of previously approved transactions, other than: (1) transactions available to all employees generally; and (2) transactions involving the payment of compensation or the entry into compensatory agreements or arrangements that are approved by the Compensation Committee or paid pursuant to an agreement, plan or arrangement approved by the Compensation Committee. The Board has delegated to the Audit Committee the responsibility of establishing policies and procedures for the review and approval of transactions with related persons, and the Audit Committee has established certain key practices related thereto. Our Governance Principles are in writing and can be found in the corporate governance section of our website. To view, go to www.genworth. com, select “Investors,” then select “Corporate Governance” and then select “Governance Principles.” Our Audit Committee’s key practices are in writing and can be found in the corporate governance section of our website. To view, go to www.genworth.com, select “Investors,” then select “Corporate Governance,” then select “Audit Committee” and finally select “Key Practices.”
Director Independence
Our Board currently consists of eight directors, seven of whom are independent (as defined by our Governance Principles and NYSE listing standards) and one of whom is our CEO, Mr. McInerney. For a director to be independent, the Board must determine that the director does not have any direct or indirect material relationship with Genworth. The Board has established guidelines to assist it in determining director independence, which conform to, or are more exacting than, the independence requirements of the NYSE. The independence guidelines are set forth in Section 4 of our Governance Principles, which are available on our website (to view, go to www.genworth.com, select “Investors,” then select “Corporate Governance” and then select “Governance Principles”). In addition to applying these guidelines, the Board will consider all relevant facts and circumstances in making an independence determination. Our Board has determined that the purchase of Genworth products and services on the same terms available to unaffiliated entities or persons does not impair a director’s independence and therefore such purchases are not considered by our Board when making independence determinations. The Board has determined that Sen. Conrad, Ms. Higgins, Mr. Moffett, Mr. Moloney, Ms. Perry, Mr. Restrepo and Mr. Riepe satisfy the NYSE’s independence requirements and Genworth’s independence guidelines. The Board also previously determined that William H. Bolinder, who served on the Board in 2019 until the annual meeting of stockholders held on December 12, 2019, satisfied the NYSE’s independence requirements and Genworth’s independence guidelines.
In addition to the independence guidelines discussed above, members of the Audit Committee also must satisfy additional independence requirements established by the SEC and the NYSE. Specifically, they may not accept, directly or indirectly, any consulting, advisory or other compensatory fee from Genworth or any
Genworth Financial, Inc. 58
|
Part III |
of its subsidiaries other than their directors’ compensation and they may not be affiliated with Genworth or any of its subsidiaries. The Board has determined that all the members of the Audit Committee satisfy the relevant SEC and NYSE independence requirements.
Further, in affirmatively determining the independence of any director who will serve on the Compensation Committee, the Board has also considered all factors specifically relevant to determining whether a director has a relationship to Genworth that is material to that director’s ability to be independent from management in connection with the duties of a member of the Compensation Committee, including: (1) the source of compensation of the director, including any consulting, advisory or other compensatory fee paid by Genworth to such director; and (2) whether the director is affiliated with Genworth, its subsidiaries or its affiliates.
Meetings of Non-Management and Independent Directors
All of our current non-management directors are independent (as determined in accordance with the NYSE listing standards and our Governance Principles) and our non-management directors met without management present at regularly scheduled Board meetings during 2019. Our Governance Principles provide that the non-management directors will meet regularly without management present. Mr. McInerney, our CEO, is currently the only employee of the company who serves on our Board. In addition, our Governance Principles provide that if the non-management directors include individuals who are not independent, as determined in accordance with the NYSE listing standards and our Governance Principles, then the independent directors on our Board will separately meet at least one time each year. Our Governance Principles provide that the Non-Executive Chairman of the Board, currently Mr. Riepe, will preside at the meetings of the non-management directors and the independent directors; in the absence of Mr. Riepe, the non-management directors present will select an independent committee chair to preside at such session. The independent Non-Executive Chairman of the Board may periodically call meetings of the non-management and independent directors, including at the request of the non-management or independent directors.
59 Form 10-K/A
|
Part III |
| Item 14. | Principal Accounting Fees and Services |
Independent Registered Public Accounting Firm
Upon the approval of the Audit Committee, Genworth retained KPMG LLP (“KPMG”) to audit our consolidated financial statements for 2019 and to attest to the effectiveness of the company’s internal control over financial reporting. In addition, Genworth retained KPMG, as well as other accounting firms, to provide other accounting and advisory services in 2019.
We understand the need for KPMG to maintain objectivity and independence in its audit of our consolidated financial statements. As required by the Audit Committee’s charter and applicable SEC and Public Company Accounting Oversight Board (“PCAOB”) rules and regulations, the Audit Committee pre-approves all audit, audit-related, tax and other permitted non-audit services performed by KPMG, including the amount of fees payable for such services, to ensure that the provision of such services does not impair KPMG’s independence. The Audit Committee may not delegate this responsibility to management. Certain audit and audit-related services and fees are pre-approved by the Audit Committee on an annual basis in connection with the engagement of KPMG as the company’s independent registered public accounting firm for the fiscal year. Other audit, audit-related and permitted non-audit services have been pre-approved by the Audit Committee pursuant to our Audit Committee’s Key Practices and are subject to fee caps. Any other audit, audit-related and permitted non-audit services and all tax services must be specifically pre-approved by the Audit Committee.
The aggregate fees billed by KPMG in 2019 and 2018 for professional services rendered were:
| 2019 | 2018 | |||||
| Type of Fees | (in millions) | |||||
| Audit Fees(1) | $ | 9.3 | $ | 9.0 | ||
| Audit-Related Fees(2) | 1.3 | 1.1 | ||||
| Tax Fees(3) | — | — | ||||
| All Other Fees(4) | 0.1 | 0.1 | ||||
| Total | $ | 10.7 | $ | 10.2 | ||
| (1) |
Fees for services to perform an audit or review in accordance with either the standards of the PCAOB or similar bodies in other countries, or generally accepted auditing standards and services that generally only Genworth’s independent registered public accounting firm can reasonably provide, such as the audit of Genworth’s consolidated financial statements included in public offerings or filings, the review of the financial statements included in our Quarterly Reports on Form 10-Q, and for services that are normally provided by accountants in connection with statutory and regulatory filings or engagements. |
| (2) |
Fees for assurance and related services that are traditionally performed by Genworth’s independent registered public accounting firm, such as audit and related services for employee benefit plan audits, internal control reviews, document production requests, attest services not required by statute or regulation, and consultation concerning financial accounting and reporting standards, including in connection with the pending Oceanwide Transaction. |
| (3) |
Fees for tax compliance, consultation and planning services. Tax compliance generally involves preparation of original and amended tax returns, claims for refunds, tax payment planning services and assistance with tax audits and filing appeals and totaled $48,915 for 2019 and $44,540 for 2018. Tax consultation and tax planning encompass a diverse range of services, including assistance in connection with tax advice related to mergers and acquisitions, employee benefit plans and requests for rulings or technical advice from taxing authorities and totaled $0 for 2019 and 2018. |
| (4) |
Fees not considered audit or audit-related, such as the actuarial services, workpaper access for strategic due diligence, and advice and assistance for the dissolution of entities. |
Genworth Financial, Inc. 60
|
|
Part IV
| Item 15. | Exhibits |
| 31.3 | Certification Pursuant to Section 302 of the Sarbanes-Oxley Act of 2002—Thomas J. McInerney | |
| 31.4 | Certification Pursuant to Section 302 of the Sarbanes-Oxley Act of 2002—Kelly L. Groh | |
| 104 | The cover page for the Companys Amendment No. 1 to Annual Report on Form 10-K for the year ended December 31, 2019, has been formatted in Inline XBRL |
61 Form 10-K/A
|
Part IV |
Signatures
Pursuant to the requirements of Section 13 or 15(d) of the Securities Exchange Act of 1934, the Registrant has duly caused this report to be signed on its behalf by the undersigned, thereunto duly authorized.
| Genworth Financial, Inc. | |
| By: | /s/ Thomas J. McInerney |
| Thomas J. McInerney | |
| President and Chief Executive Officer | |
Date: April 10, 2020
Genworth Financial, Inc. 62