
UNITED STATES
SECURITIES AND EXCHANGE COMMISSION
WASHINGTON, D.C. 20549
FORM 10-K
| x | ANNUAL REPORT PURSUANT TO SECTION 13 OR 15(d) OF THE SECURITIES EXCHANGE ACT OF 1934 |
For the fiscal year ended December 31, 2013
OR
| ¨ | TRANSITION REPORT PURSUANT TO SECTION 13 OR 15(d) OF THE SECURITIES EXCHANGE ACT OF 1934 |
For the transition period from to
Commission file number 001-32195
GENWORTH FINANCIAL, INC.
(Exact name of registrant as specified in its charter)
| Delaware | 80-0873306 | |
| (State or other jurisdiction of incorporation or organization) |
(I.R.S. Employer Identification No.) | |
| 6620 West Broad Street Richmond, Virginia |
23230 | |
| (Address of principal executive offices) | (Zip Code) | |
(804) 281-6000
(Registrant’s telephone number, including area code)
Securities registered pursuant to Section 12(b) of the Act
| Title of Each Class |
Name of each exchange on which registered | |
| Class A Common Stock, par value $.001 per share | New York Stock Exchange |
Securities registered pursuant to Section 12(g) of the Act
None
Indicate by check mark if the registrant is a well-known seasoned issuer, as defined in Rule 405 of the Securities Act. Yes x No ¨
Indicate by check mark if the registrant is not required to file reports pursuant to Section 13 or Section 15(d) of the Act. Yes ¨ No x
Indicate by check mark whether the registrant (1) has filed all reports required to be filed by Section 13 or 15(d) of the Securities Exchange Act of 1934 during the preceding 12 months (or for such shorter period that the registrant was required to file such reports) and (2) has been subject to such filing requirements for the past 90 days. Yes x No ¨
Indicate by check mark whether the registrant has submitted electronically and posted on its corporate Web site, if any, every Interactive Data File required to be submitted and posted pursuant to Rule 405 of Regulation S-T (§232.405 of this chapter) during the preceding 12 months (or for such shorter period that the registrant was required to submit and post such files). Yes x No ¨
Indicate by check mark if disclosure of delinquent filers pursuant to Item 405 of Regulation S-K (§229.405 of this chapter) is not contained herein, and will not be contained, to the best of registrant’s knowledge, in definitive proxy or information statements incorporated by reference in Part III of this Form 10-K or any amendment to this Form 10-K. x
Indicate by check mark whether the registrant is a large accelerated filer, an accelerated filer, a non-accelerated filer, or a smaller reporting company. See the definitions of “large accelerated filer,” “accelerated filer” and “smaller reporting company” in Rule 12b-2 of the Exchange Act. (Check one):
| Large accelerated filer | x | Accelerated filer | ¨ | |||
| Non-accelerated filer | ¨ | Smaller reporting company | ¨ | |||
Indicate by check mark whether the registrant is a shell company (as defined in Rule 12b-2 of the Exchange Act). Yes ¨ No x
As of February 12, 2014, 495,357,422 shares of Class A Common Stock, par value $0.001 per share were outstanding.
The aggregate market value of the common equity (based on the closing price of the Class A Common Stock on the New York Stock Exchange) held by non-affiliates of the registrant on June 28, 2013, the last business day of the registrant’s most recently completed second fiscal quarter, was approximately $5.6 billion. All executive officers and directors of the registrant have been deemed, solely for the purpose of the foregoing calculation, to be “affiliates” of the registrant.
DOCUMENTS INCORPORATED BY REFERENCE
Certain portions of the registrant’s definitive proxy statement pursuant to Regulation 14A of the Securities Exchange Act of 1934 in connection with the 2014 annual meeting of the registrant’s stockholders are incorporated by reference into Part III of this Annual Report on Form 10-K.
| Page | ||||||
| Item 1. |
4 | |||||
| Item 1A. |
55 | |||||
| Item 1B. |
88 | |||||
| Item 2. |
88 | |||||
| Item 3. |
88 | |||||
| Item 4. |
91 | |||||
| Item 5. |
92 | |||||
| Item 6. |
94 | |||||
| Item 7. |
Management’s Discussion and Analysis of Financial Condition and Results of Operations |
97 | ||||
| Item 7A. |
210 | |||||
| Item 8. |
216 | |||||
| Item 9. |
Changes in and Disagreements With Accountants on Accounting and Financial Disclosure |
363 | ||||
| Item 9A. |
363 | |||||
| Item 9B. |
365 | |||||
| Item 10. |
366 | |||||
| Item 11. |
371 | |||||
| Item 12. |
Security Ownership of Certain Beneficial Owners and Management and Related Stockholder Matters |
371 | ||||
| Item 13. |
Certain Relationships and Related Transactions, and Director Independence |
371 | ||||
| Item 14. |
371 | |||||
| Item 15. |
372 | |||||
2
Cautionary Note Regarding Forward-looking Statements
This Annual Report on Form 10-K, including Management’s Discussion and Analysis of Financial Condition and Results of Operations, contains certain “forward-looking statements” within the meaning of the Private Securities Litigation Reform Act of 1995. Forward-looking statements may be identified by words such as “expects,” “intends,” “anticipates,” “plans,” “believes,” “seeks,” “estimates,” “will,” or words of similar meaning and include, but are not limited to, statements regarding the outlook for our future business and financial performance. Forward-looking statements are based on management’s current expectations and assumptions, which are subject to inherent uncertainties, risks and changes in circumstances that are difficult to predict. Actual outcomes and results may differ materially due to global political, economic, business, competitive, market, regulatory and other factors and risks, including the items identified under “Part I—Item 1A—Risk Factors.”
We undertake no obligation to publicly update any forward-looking statement, whether as a result of new information, future developments or otherwise.
Note Regarding This Annual Report
As previously announced, on April 1, 2013, we completed a holding company reorganization in connection with a comprehensive capital plan for our U.S. mortgage insurance business, which is discussed in further detail in note 1 in our consolidated financial statements under “Part II—Item 8—Financial Statements and Supplementary Data” of this Annual Report on Form 10-K. Pursuant to the reorganization, the public holding company historically known as “Genworth Financial, Inc.” (now renamed Genworth Holdings, Inc. (“Genworth Holdings”)) became a direct, 100% owned subsidiary of a new public holding company that it had formed and that now has been renamed Genworth Financial, Inc. (“Genworth Financial”). In connection with the reorganization, all of the stockholders of Genworth Holdings immediately prior to the completion of the reorganization automatically became stockholders of Genworth Financial, owning the same number of shares of stock in Genworth Financial that they owned in Genworth Holdings immediately prior to the reorganization. Genworth Financial, as the successor issuer to Genworth Holdings (pursuant to Rule 12g-3(a) under the Securities Exchange Act of 1934, as amended (the “Exchange Act”)), began making filings under the Securities Act of 1933, as amended, and the Exchange Act, from April 1, 2013.
References to “Genworth,” the “Company,” “we” or “our” in this Annual Report on Form 10-K (including in the consolidated financial statements and notes thereto in this report) have the following meanings, unless the context otherwise requires:
| • | For periods prior to April 1, 2013: Genworth Holdings and its subsidiaries |
| • | For periods from and after April 1, 2013: Genworth Financial and its subsidiaries |
3
| Item 1. | Business |
Overview
Genworth Holdings, Inc. (“Genworth Holdings”) (formerly known as Genworth Financial, Inc.) was incorporated in Delaware in 2003 in preparation for an initial public offering (“IPO”) of Genworth common stock, which was completed on May 28, 2004. On April 1, 2013, Genworth Holdings completed a holding company reorganization pursuant to which Genworth Holdings became a direct, 100% owned subsidiary of a new public holding company that it had formed. The new public holding company was incorporated in Delaware on December 5, 2012, in connection with the reorganization, under the name Sub XLVI, Inc., and was renamed Genworth Financial, Inc. (“Genworth Financial”) upon the completion of the reorganization.
We are a leading financial services company dedicated to providing insurance, investment and financial solutions to our customers, with a presence in more than 25 countries. We are headquartered in Richmond, Virginia and have approximately 5,000 employees.
We are dedicated to helping solve the life insurance, retirement and homeownership needs of our customers. Our life insurance offerings protect people during unexpected events and help address the needs of the uninsured and underserved middle market. We help people achieve financial goals and independence by providing retirement offerings. In the United States, retirement products include various types of annuity and guaranteed retirement income products, as well as individual and group long-term care insurance to meet growing consumer needs for long-term care. We enable homeownership in the United States and internationally by providing mortgage insurance products that allow people to purchase homes with low down payments while protecting lenders against the risk of default. Through our homeownership education and assistance programs, we also help people keep their homes when they experience financial difficulties. Our payment protection coverages in Europe, Canada and Mexico help consumers meet specified payment obligations in time of need. Across all of our businesses, we differentiate through product innovation and by providing valued services such as education and training, care coordination and wellness programs, support services and technology linked to our insurance, investment and financial products that address both consumer and distributor needs. In doing so, we strive to be easy to do business with and help our business partners grow more effectively.
Our products and services are designed to help consumers meet key financial security needs. Our primary products and related services are targeted at markets that are benefiting from positive demographic, legislative and market trends, including the aging population across the countries in which we operate, and the growing reality that responsibility for building financial security resides primarily with the individual. We distribute our products and services through diversified channels that include financial intermediaries, advisors, independent distributors, affinity groups and dedicated sales specialists. We are committed to our distribution partners and policyholders and continue to invest in key distribution relationships, product innovation and service capabilities.
We operate through three divisions: U.S. Life Insurance, Global Mortgage Insurance and Corporate and Other. The U.S. Life Insurance Division includes the U.S. Life Insurance segment. The Global Mortgage Insurance Division includes the International Mortgage Insurance and U.S. Mortgage Insurance segments. The Corporate and Other Division includes the International Protection and Runoff segments and Corporate and Other activities. The following reflects a discussion of our operating segments:
| • | U.S. Life Insurance. We offer and manage a variety of insurance and fixed annuity products in the United States. Our primary products include life insurance, long-term care insurance and fixed annuities. For the year ended December 31, 2013, our U.S. Life Insurance segment’s income from continuing operations available to Genworth Financial, Inc.’s common stockholders and net operating income improved to $384 million and $394 million, respectively. |
| • | International Mortgage Insurance. We are a leading provider of mortgage insurance products and related services in Canada and Australia and also participate in select European and other countries. Our products predominantly insure prime-based, individually underwritten residential mortgage loans, also |
4
| known as flow mortgage insurance. We also selectively provide mortgage insurance on a structured, or bulk, basis that aids in the sale of mortgages to the capital markets and helps lenders manage capital and risk. Additionally, we offer services, analytical tools and technology that enable lenders to operate efficiently and manage risk. For the year ended December 31, 2013, our International Mortgage Insurance segment’s income from continuing operations available to Genworth Financial, Inc.’s common stockholders and net operating income were $372 million and $361 million, respectively. |
| • | U.S. Mortgage Insurance. In the United States, we offer mortgage insurance products predominantly insuring prime-based, individually underwritten residential mortgage loans, also known as flow mortgage insurance. We selectively provide mortgage insurance on a bulk basis with essentially all of our bulk writings prime-based. Additionally, we offer services, analytical tools and technology that enable lenders to operate efficiently and manage risk. For the year ended December 31, 2013, our U.S. Mortgage Insurance segment’s income from continuing operations available to Genworth Financial, Inc.’s common stockholders and net operating income improved significantly to $37 million for each measure. |
| • | International Protection. We are a leading provider of payment protection coverages (referred to as lifestyle protection) in multiple European countries and have operations in select other countries. Our lifestyle protection insurance products primarily help consumers meet specified payment obligations should they become unable to pay due to accident, illness, involuntary unemployment, disability or death. For the year ended December 31, 2013, our International Protection segment’s income from continuing operations available to Genworth Financial, Inc.’s common stockholders and net operating income were $39 million and $24 million, respectively. |
| • | Runoff. The Runoff segment includes the results of non-strategic products which are no longer actively sold. Our non-strategic products primarily include our variable annuity, variable life insurance, institutional, corporate-owned life insurance and other accident and health insurance products. Institutional products consist of: funding agreements, funding agreements backing notes (“FABNs”) and guaranteed investment contracts (“GICs”). In January 2011, we discontinued new sales of retail and group variable annuities while continuing to service our existing blocks of business. Effective October 1, 2011, we completed the sale of our Medicare supplement insurance business. For the year ended December 31, 2013, our Runoff segment’s income from continuing operations available to Genworth Financial, Inc.’s common stockholders and net operating income were $49 million and $66 million, respectively. |
We also have Corporate and Other activities which include debt financing expenses that are incurred at the Genworth Holdings level, unallocated corporate income and expenses, eliminations of inter-segment transactions and the results of other businesses that are managed outside of our operating segments, including discontinued operations. For the year ended December 31, 2013, Corporate and Other activities had a loss from continuing operations available to Genworth Financial, Inc.’s common stockholders and a net operating loss of $309 million and $266 million, respectively.
Discontinued operations consisted of our wealth management business. Through this business, we offered and managed a variety of wealth management products that included managed account programs together with advisor support and financial planning services. On August 30, 2013, we sold our wealth management business to AqGen Liberty Acquisition, Inc., a subsidiary of AqGen Liberty Holdings LLC, a partnership of Aquiline Capital Partners and Genstar Capital, for approximately $412 million. Historically, this business had been reported as a separate segment. This business was accounted for as discontinued operations and its financial position, results of operations and cash flows were separately reported for all periods presented. Also included in discontinued operations was our tax and advisor unit, Genworth Financial Investment Services (“GFIS”), which was part of our wealth management business until the closing of the sale on April 2, 2012. Loss from discontinued operations, net of taxes, was $12 million for the year ended December 31, 2013.
We had $15.6 billion of total Genworth Financial, Inc.’s stockholders’ equity and $108.0 billion of total assets as of December 31, 2013. For the year ended December 31, 2013, our revenues were $9.4 billion and we had net income available to Genworth Financial, Inc.’s common stockholders of $560 million.
5
Positioning for the Future
We have two core businesses: (1) U.S. Life Insurance, which includes our life insurance, long-term care insurance and fixed annuities businesses and (2) Global Mortgage Insurance, which includes mortgage insurance in the United States, Canada, Australia and other markets.
In our U.S. Life Insurance business, we are focused on the execution of our long-term care insurance strategy, which includes: obtaining significant premium rate increases on our older generation in-force blocks of long-term care insurance to improve profitability and reduce the strain on capital; requesting smaller rate increases more proactively on newer in-force blocks of long-term care insurance as needed; and introducing new products with appropriate price benefits, using more conservative assumptions. We also plan to review our life insurance products with a focus on universal life and indexed universal life insurance products and on balancing sales between term and permanent life insurance. This should help improve the new business profile of our life insurance business and reduce risk, while improving profitability and maximizing capital efficiency.
In our Global Mortgage Insurance business, we are working to accelerate earnings growth of our U.S. mortgage insurance business, rebalance business risk in mortgage insurance through a partial sale of our Australian mortgage insurance business, increase the use of third-party reinsurance and manage our exposure in Europe by limiting new sales to four countries where we believe the market conditions are more favorable. We remain focused on executing loss mitigation strategies, maintaining our distribution network and writing profitable new business. In addition, the government-sponsored entities (the “GSEs”) are currently considering changes to their respective capital standards which would impact our U.S. mortgage insurance business. We plan to address any new capital requirements once these changes are finalized.
We have identified the following businesses as non-core: (1) International Protection and (2) businesses included in our Runoff segment, which primarily consist of our variable annuity and institutional products. In International Protection, we expect to manage new business to maintain or increase the value that can be realized, while generating cash and capital, for example, through an ultimate sale. We also intend to generate positive earnings and maximize the embedded value of the overall business in International Protection through re-sizing the current European franchise, while pursuing opportunities in new markets. We are narrowing the focus in Europe to key relationships and managing pricing to protect margins during the prolonged European financial crisis. We believe these changes will add to the embedded value of the business while maintaining dividends to the holding company, enhancing our ability to realize increased value from a potential sale of the business in the next few years if economic and business conditions permit.
We believe all of these actions support our goals of building strength and flexibility at the holding company. We are positioning our core businesses to pay consistent dividends to the holding company, while generating cash and capital from our non-core businesses. Our approach is designed to help us rebuild stockholder value through pursuit of the following key initiatives:
| • | Improve business performance. We strive to improve operating income and return on equity, while maintaining appropriate risk thresholds in our product offerings. We re-priced products in our long-term care, life, U.S. mortgage and lifestyle protection insurance businesses, as well as in certain of our international mortgage insurance markets. We continue to review our pricing and underwriting guidelines and make adjustments as necessary. We are narrowing our distribution relationships and refining our products and target markets in our lifestyle protection insurance business. We further reduced our mortgage insurance risk in-force in Europe which was primarily driven by reductions in Ireland and we are limiting new sales to four countries where we believe the market conditions are more favorable. We maintain active loss mitigation efforts in our U.S. mortgage insurance business, including pursuing appropriate loan and claim modifications, investigating loans for underwriting and master policy compliance and, where appropriate, executing loan rescissions. Additionally, we pursue targeted loss mitigation strategies in mortgage insurance markets outside the United States. |
6
| • | Simplify our business portfolio. As we focus on our core businesses, we continue to concentrate on market segments that we see as most attractive where we believe we have a competitive advantage due to scale, automation or experience and that best fit with our profitability targets and risk tolerance. We seek to adapt to changes and proactively manage risk as it relates to our businesses. For example, as part of our regular reviews of business performance and risk tolerance, we may make changes to future offerings, which could reduce demand for those products. |
| • | Generate capital. Our objective is to maintain appropriate levels of capital in the event of unforeseen events, while still meeting our targeted goals. We generate statutory capital from earnings on our in-force business, as well as from ongoing capital management and efficiency strategies such as use of reinsurance, management of new business levels and cost reductions. We also continue to evaluate opportunities to redeploy capital from lower returning blocks of business. In addition, we will manage our non-core businesses to enhance and generate capital, as well as seek to execute a partial sale of our Australian mortgage insurance business. |
| • | Increase financial strength and flexibility. At Genworth Holdings, we anticipate continuing to maintain cash and highly liquid securities of at least one and half times debt service plus a $350 million buffer in the near term and focus on deleveraging over time. Our goal is also to position our subsidiaries to provide regular dividends to the holding company and cover their share of debt service costs. We also plan to increase financial flexibility by improving elements of our credit profile which impact our financial strength ratings. |
U.S. Life Insurance Division
U.S. Life Insurance
Through our U.S. Life Insurance segment, we offer various forms of life insurance, long-term care insurance and fixed annuities.
The following table sets forth financial information regarding our U.S. Life Insurance segment as of or for the periods indicated. Additional selected financial information and operating performance measures regarding our U.S. Life Insurance segment as of or for these periods are included under “Part II—Item 7—Management’s Discussion and Analysis of Financial Condition and Results of Operations—U.S. Life Insurance.”
| As of or for the years ended December 31, | ||||||||||||
| (Amounts in millions) |
2013 | 2012 | 2011 | |||||||||
| Revenues: |
||||||||||||
| Life insurance |
$ | 1,982 | $ | 1,926 | $ | 2,042 | ||||||
| Long-term care insurance |
3,316 | 3,207 | 3,002 | |||||||||
| Fixed annuities |
1,032 | 1,117 | 1,086 | |||||||||
|
|
|
|
|
|
|
|||||||
| Total revenues |
$ | 6,330 | $ | 6,250 | $ | 6,130 | ||||||
|
|
|
|
|
|
|
|||||||
| Net operating income: |
||||||||||||
| Life insurance |
$ | 173 | $ | 151 | $ | 180 | ||||||
| Long-term care insurance |
129 | 101 | 99 | |||||||||
| Fixed annuities |
92 | 82 | 78 | |||||||||
|
|
|
|
|
|
|
|||||||
| Total net operating income |
394 | 334 | 357 | |||||||||
| Net investment gains (losses), net of taxes and other adjustments |
(1 | ) | (16 | ) | (32 | ) | ||||||
| Expenses related to restructuring, net of taxes |
(9 | ) | — | — | ||||||||
| Gains (losses) on early extinguishment of debt, net of taxes |
— | 3 | 31 | |||||||||
| Gains (losses) from life block transactions, net of taxes |
— | (47 | ) | — | ||||||||
|
|
|
|
|
|
|
|||||||
| Income from continuing operations available to Genworth Financial, Inc.’s common stockholders |
$ | 384 | $ | 274 | $ | 356 | ||||||
|
|
|
|
|
|
|
|||||||
| Total segment assets |
$ | 77,261 | $ | 79,214 | $ | 75,547 | ||||||
|
|
|
|
|
|
|
|||||||
7
Life insurance
Our life insurance business markets and sells products that provide a personal financial safety net for individuals and their families. These products provide protection against financial hardship after the death of an insured. Some of these products also offer a savings element that can help accumulate funds to meet future financial needs. We continue to enhance our sales support services and product offerings. Our key objective is to assist producers selling to our primary target market of consumers with household incomes of between $50,000 and $250,000. Embedded in these services is a simplified fulfillment process which enables more efficient and timely placement for policies being sold.
Products
Our current life insurance offerings include universal life and term life. Our universal life insurance products are designed to provide permanent protection for the life of the insured. In addition, we also offer a linked-benefits product for customers who have traditionally self-funded long-term care risk or seek multiple benefits. Our linked-benefits product combines universal life insurance with long-term care insurance coverage in a single policy that provides cash value, death benefits and long-term care benefits.
On October 22, 2012, we announced changes to our life insurance portfolio designed to update and expand our product offerings, and further adjust pricing to reflect the current low interest rate market environment and recent regulatory changes. In late October 2012, we launched a new traditional term life insurance product, which replaced our term universal life insurance product. In addition, effective November 12, 2012, we modified our guaranteed universal life insurance portfolio by expanding and re-pricing certain product offerings. In the second quarter of 2013, we launched our first indexed universal life insurance product, Asset Builder IUL. This product was developed to provide the opportunity for greater policy value growth by linking the crediting strategy to an equity market index while protecting against negative market returns by flooring the crediting rate at 0% even if the index experiences a negative return. Monthly charges and fees will continue regardless of the crediting rate and will reduce policy value. In December 2013, we launched our second indexed universal life insurance product, Foundation Builder IUL, designed to offer affordable death benefit protection plus the opportunity to build cash value. We plan to continue to broaden our life insurance product mix and improve service delivery platforms. This may include further re-pricing of our life insurance products or introducing new universal life insurance offerings, which may continue to include optional long-term care insurance riders.
Our existing in-force blocks of term life insurance products provide coverage with guaranteed level premiums for a specified period of time and generally have little or no buildup of cash value. We also have in-force blocks of term universal life and whole life insurance; however, we no longer solicit sales of these products.
Underwriting and pricing
Underwriting and pricing are significant drivers of profitability in our life insurance business, and we have established underwriting and pricing practices. We have generally reinsured risks in excess of $5 million per individual life policy. We set pricing assumptions for expected claims, lapses, investment returns, expenses and customer demographics based on our historical experience and other factors.
We target individuals primarily in standard or better risk categories, which include healthier individuals who generally have family histories that do not present increased mortality risk. We also have expertise in evaluating applicants with health problems and offer appropriately priced coverage based on pre-established underwriting criteria.
Distribution
We offer life insurance products through an extensive network of independent brokerage general agencies (“BGAs”) throughout the United States and through financial intermediaries and insurance marketing organizations. We believe there are opportunities to expand our sales in each of these and other distribution channels through additional product offerings, services and marketing strategies.
8
Competition
Competition in our life insurance business comes from many sources, including traditional insurance companies as well as non-traditional providers, such as banks and structured finance or private equity markets. The life insurance market is highly fragmented. Competitors have multiple access points to the market through BGAs, financial institutions, career sales agents, multi-line exclusive agents, e-retail and other life insurance distributors. We operate primarily in the BGA channel and have built additional capabilities in other channels. We believe our competitive advantage in the life insurance market comes from our long history serving this market and our reputation for service excellence.
Long-term care insurance
We established ourselves as a pioneer in long-term care insurance nearly 40 years ago and remain a leading provider in the industry. Our experience helps us plan for disciplined growth built on a foundation of risk management, product innovation, a diversified distribution strategy and claims processing expertise. We believe our hedging strategies and reinsurance reduce some of the risks associated with these products.
Products
Our individual and group long-term care insurance products provide defined levels of protection against the significant and escalating costs of long-term care services provided in the insured’s home or in assisted living or nursing facilities. Insureds become eligible for covered benefits if they become incapable of performing two activities of daily living. In contrast to health insurance, long-term care insurance provides coverage for skilled and custodial care provided outside of a hospital or health-related facility. Long-term care insurance claims typically have an average duration of approximately three years.
In 2013, we introduced a product that includes gender distinct pricing for single applicants and blood and lab underwriting requirements for all applicants. As of December 31, 2013, this new product has been launched in 39 states and we have approvals in eight additional states of which we plan to have the majority launched in the first quarter of 2014. We suspended sales of our individual long-term care insurance product in California effective March 21, 2013 and then launched a new individual long-term care insurance product approved by California in the third quarter of 2013. In the fourth quarter of 2013, we began filing for regulatory approval of a new product, scheduled for release in 2014, subject to regulatory approvals. Effective June 1, 2013, we also no longer offer AARP-branded long-term care insurance products.
We also offer access to a Wellness Program designed to promote healthier lifestyle alternatives for our policyholders as part of certain of our individual long-term care insurance products.
Underwriting and pricing
We employ medical underwriting procedures to assess and quantify risks before we issue our individual long-term care insurance policies, similar to, but separate from, those we use in underwriting life insurance products. Our group long-term care insurance product utilizes various underwriting processes, including modified guaranteed underwriting for actively at work employees, simplified underwriting for spouses of actively at work employees and full medical underwriting for employees outside their enrollment window, retirees or others.
We have accumulated extensive pricing and claims experience, and believe we have the largest claims database in the industry. The overall profitability of our long-term care insurance business depends primarily on the accuracy of our pricing assumptions for claims experience, morbidity and mortality experience, persistency and investment yields. Our claims database provides us with substantial data that has helped us develop pricing methodologies for our newer policies. We tailor pricing based on segmented risk categories, including couples,
9
gender, medical history and other factors. Profitability on older policies issued without the full benefit of this experience has been lower than initially assumed in pricing of those blocks. We continually monitor trends and developments and update assumptions that may affect the risk, pricing and profitability of our long-term care insurance products and adjust our new product pricing and other terms, as appropriate. We also work with a medical advisory board comprised of independent experts from the medical field that provides insights on emerging morbidity and medical trends, enabling us to be more proactive in our risk segmentation, pricing and product development strategies.
In July 2012, we introduced changes to our individual long-term care insurance product to improve profitability and reduce risk. Lifetime benefits coverage and limited pay options are no longer available, underwriting was further tightened, first-year commissions were lowered in certain channels and certain discounts were reduced or suspended effectively increasing average pricing by more than 20% on the products impacted.
In the third quarter of 2012, we initiated a round of long-term care insurance in-force premium rate increases with the goal of achieving an average premium increase in excess of 50% on the older generation policies and an average premium increase in excess of 25% on an earlier series of new generation policies. Subject to regulatory approval, this premium rate increase is expected to generate approximately $250 million to $300 million of additional annual premiums when fully implemented. We also expect our reserve levels, and thus our expected profitability, to be impacted by policyholder behavior in cases where policyholders elect to take reduced benefits or non-forfeiture options within their policy coverage. The goal of our rate actions is to mitigate losses on the older generation products and help offset higher than priced-for loss ratios due to unfavorable business mix and lower lapse rates than expected on certain newer generation products which remain profitable but with returns lower than in pricing assumptions. As of December 31, 2013, this round of rate actions had been approved in 41 states representing approximately $195 million to $200 million of the targeted premium increase when fully implemented in 2017.
In the third quarter of 2013, we began filing for regulatory approval for premium rate increases ranging between 6% and 13% on more than $800 million in annualized in-force premiums on another series of new generation policies. As of December 31, 2013, we have received approvals in four states.
The approval process of an in-force rate increase and the amount of the rate increase approved varies by state. In certain states, the decision to approve or disapprove a rate increase can take several years. Upon approval, insureds are provided with written notice of the increase and increases are generally applied on the insured’s policy anniversary date. Therefore, the benefits of any rate increase are not fully realized until the implementation cycle is complete.
Distribution
We have a broad and diverse distribution network for our long-term care insurance products. We distribute our products through diversified sales channels consisting of appointed independent producers, financial intermediaries, dedicated sales specialists and affinity groups. We have made significant investments in our servicing and support for both independent and dedicated sales specialists and we believe our product features, distribution support and services are leading the industry.
Competition
Competition in the long-term care insurance industry is primarily from a limited segment of insurance companies. Our products compete by providing consumers with an array of long-term care coverage solutions, coupled with long-term care support services. We offer a diverse product portfolio with a wide range of price points and benefits designed to appeal to a broad spectrum of the population who are concerned about mitigating the costs of future long-term care needs. We believe our significant historical experience and risk disciplines provide us with a competitive advantage in the form of product features, benefits, support services and pricing.
10
Over the past several years, the competitive landscape of the long-term care insurance market has changed significantly, with several competitors announcing their intent to exit the market and several others re-entering in either targeted state markets or nationwide. Since 2012, several competitors have announced changes to their individual long-term care insurance product benefits and pricing similar to our product changes previously discussed. Continued changes in the competitive landscape of the long-term care insurance market will continue to impact our sales levels.
Fixed annuities
We are focused on helping individuals create dependable income streams for life or for a specified period of time and helping them save and invest to achieve financial goals. We believe our product designs, investment strategy, hedging disciplines and use of reinsurance reduce some of the risks associated with these products.
Products
Single premium deferred annuities
We offer fixed single premium deferred annuities which require a single premium payment at time of issue and provide an accumulation period and an annuity payout period. The annuity payout period in these products may be defined as either a defined number of years, the annuitant’s lifetime or the longer of a defined number of years or the annuitant’s lifetime. During the accumulation period, we credit the account value of the annuity with interest earned at a crediting rate guaranteed for no less than one year at issue, but which may be guaranteed for up to seven years, and thereafter is subject to annual crediting rate resets at our discretion. The crediting rate is based upon many factors including prevailing market rates, spreads and targeted returns, subject to statutory and contractual minimums. The majority of our fixed single premium deferred annuity contractholders retain their contracts for five to ten years.
We also offer fixed indexed annuities as part of our product suite of single premium deferred annuities. Fixed indexed annuities provide an annual crediting rate that is based on the performance of a defined outside index rather than a rate that is declared by the insurance company. The outside index we use is the S&P 500®. There are currently four separate index crediting strategies, each of which credits interest based on how the index performs and the limit for that strategy. In addition, there are currently two fixed interest rate options.
Single premium immediate annuities
In exchange for a single premium, immediate annuities provide a fixed amount of income for either a defined number of years, the annuitant’s lifetime or the longer of a defined number of years or the annuitant’s lifetime.
Structured settlements
Structured settlement annuity contracts provide an alternative to a lump sum settlement, generally in a personal injury lawsuit or workers compensation claim, and typically are purchased by property and casualty insurance companies for the benefit of an injured claimant. The structured settlements provide scheduled payments over a fixed period or, in the case of a life-contingent structured settlement, for the life of the claimant with a guaranteed minimum period of payments. In 2006, we discontinued sales of our structured settlement annuities while continuing to service our retained and reinsured blocks of business.
Distribution
We distribute our fixed annuity products through BGAs, independent broker/dealers and select banks and national brokerage and financial firms.
11
Competition
We compete with a large number of life insurance companies in the fixed annuity marketplace. Overall sales of fixed annuities are linked to current interest rate yield curves, which affect the relative competitiveness of alternative products, such as certificates of deposit and money market funds. We have experienced fluctuations in sales levels for this product and we may experience fluctuations in the future based on changes in interest rates and other factors including our ability to achieve desired targeted returns.
Global Mortgage Insurance Division
International Mortgage Insurance
Through our International Mortgage Insurance segment, we are a leading provider of mortgage insurance in Canada and Australia and also participate in select European and other countries. We have a presence in 15 countries. We expanded our international operations beginning in the mid-1990s and, today, we believe we are the largest overall provider of private mortgage insurance outside of the United States.
Private mortgage insurance enables borrowers to buy homes with low-down-payment mortgages, which are usually defined as loans with a down payment of less than 20% of the home’s value. Low-down-payment mortgages are also referred to as high loan-to-value mortgages. Mortgage insurance protects lenders against loss in the event of a borrower’s default. It also generally aids financial institutions in managing their capital and risk profile in particular by reducing the capital required for low-down-payment mortgages. If a borrower defaults on mortgage payments, private mortgage insurance reduces and may eliminate losses to the insured institution. Private mortgage insurance may also facilitate the sale of mortgage loans in the secondary mortgage market.
The following table sets forth financial information regarding our International Mortgage Insurance segment as of or for the periods indicated. Additional selected financial information and operating performance measures regarding our International Mortgage Insurance segment as of or for these periods are included under “Part II—Item 7—Management’s Discussion and Analysis of Financial Condition and Results of Operations—International Mortgage Insurance.”
| As of or for the years ended December 31, |
||||||||||||
| (Amounts in millions) |
2013 | 2012 | 2011 | |||||||||
| Revenues: |
||||||||||||
| Canada |
$ | 760 | $ | 786 | $ | 823 | ||||||
| Australia |
555 | 567 | 612 | |||||||||
| Other Countries |
46 | 55 | 72 | |||||||||
|
|
|
|
|
|
|
|||||||
| Total revenues |
$ | 1,361 | $ | 1,408 | $ | 1,507 | ||||||
|
|
|
|
|
|
|
|||||||
| Net operating income: |
||||||||||||
| Canada |
$ | 170 | $ | 234 | $ | 159 | ||||||
| Australia |
228 | 142 | 196 | |||||||||
| Other Countries |
(37 | ) | (34 | ) | (27 | ) | ||||||
|
|
|
|
|
|
|
|||||||
| Total net operating income |
361 | 342 | 328 | |||||||||
| Net investment gains (losses), net of taxes and other adjustments |
12 | 7 | 25 | |||||||||
| Expenses related to restructuring, net of taxes |
(1 | ) | — | — | ||||||||
|
|
|
|
|
|
|
|||||||
| Income from continuing operations available to Genworth Financial, Inc.’s common stockholders |
372 | 349 | 353 | |||||||||
| Add: net income attributable to noncontrolling interests |
154 | 200 | 139 | |||||||||
|
|
|
|
|
|
|
|||||||
| Net income |
$ | 526 | $ | 549 | $ | 492 | ||||||
|
|
|
|
|
|
|
|||||||
| Total segment assets |
$ | 9,194 | $ | 10,063 | $ | 9,643 | ||||||
|
|
|
|
|
|
|
|||||||
12
The mortgage loan markets in Canada and Australia are well developed, and mortgage insurance plays an important role in each of these markets. However, these markets vary significantly and are influenced by different economic, public policy, regulatory, distributor, credit, demographic and cultural conditions.
We believe the following factors have contributed to mortgage insurance demand in these countries:
| • | a desire by lenders to offer low-down-payment mortgage loans; |
| • | the recognition of the higher default risk inherent in low-down-payment lending and the need for specialized underwriting expertise to conduct this business prudently; |
| • | government housing policies that support a high level of homeownership; |
| • | government policies that support the use of securitization and secondary market mortgage sales, in which third-party credit enhancement is often used to facilitate funding and liquidity for mortgage lending; and |
| • | bank regulatory capital policies that provide incentives to Canadian lenders and certain Australian lenders to transfer some or all of the default risk on low-down-payment mortgages to third parties, such as mortgage insurers. |
Based upon our experience in these mature markets, we believe a favorable regulatory framework is important to the development of high loan-to-value lending and the use of products such as mortgage insurance to protect against default risk or to obtain capital relief. As a result, we have advocated government and policymaking agencies throughout our markets to adopt legislative and regulatory policies supporting increased homeownership and the use of private mortgage insurance. We have significant expertise in mature markets, and we leverage this experience in selected developing markets to encourage regulatory authorities to implement incentives to use private mortgage insurance as an important element of their housing finance systems.
We believe the revisions to a set of regulatory rules and procedures governing global bank capital standards that were introduced by the Basel Committee of the Bank for International Settlements, recently revised to strengthen regulatory capital requirements for banks and now referred to as Basel III, may impact the use of mortgage insurance as a risk and capital management tool in international markets. While Basel III was issued in December 2010, its adoption by individual countries internationally and in the United States has not concluded. Changes in national implementation could occur which might aid or detract from future demand for mortgage insurance.
Mortgage insurance in our International Mortgage Insurance segment is predominantly single premium and provides 100% coverage in the two largest markets, Canada and Australia. With single premium policies, the premium is usually included as part of the aggregate loan amount and paid to us as the mortgage insurer. We record the proceeds to unearned premium reserves, invest those proceeds and recognize the premiums over time in accordance with the expected pattern of risk emergence.
Canada
We entered the Canadian mortgage insurance market in 1995 and operate in every province and territory. We are currently the leading private mortgage insurer in the Canadian market. The five largest mortgage originators in Canada provide the majority of the financing for residential mortgage financing in that country. Mortgages provided by these five lenders in Canada accounted for the majority of our flow new insurance written in 2013.
In July 2009, Genworth MI Canada Inc. (“Genworth Canada”), our indirect subsidiary, completed the initial public offering (the “Offering”) of its common shares. Following completion of the Offering, we beneficially owned 57.5% of the common shares of Genworth Canada. Over the past four years, Genworth Canada has completed several share repurchases in which Genworth has participated proportionately to maintain its ownership. We currently hold approximately 57.4% of the outstanding common shares of Genworth Canada on a consolidated basis, with Brookfield
13
Life Assurance Company Limited (“Brookfield”) holding 40.6% and our U.S. mortgage insurance business holding 16.8%. In addition, Brookfield has the right, exercisable at its discretion, to purchase for cash the common shares of Genworth Canada held by our U.S. mortgage insurance companies at the then-current market price. Brookfield also has a right of first refusal with respect to the transfer of these common shares of Genworth Canada by the U.S. mortgage insurance companies. See note 24 in our consolidated financial statements under “Part II—Item 8—Financial Statements and Supplementary Data” for additional information.
Products
Our main products are primary flow insurance and portfolio credit enhancement insurance. Regulations in Canada require the use of mortgage insurance for all mortgage loans extended by federally incorporated banks, trust companies and insurers, where the loan-to-value ratio exceeds 80%. Most mortgage lenders in Canada offer a portability feature, which allows borrowers to transfer their original mortgage loan to a new property, subject to certain criteria. Our flow insurance policies contain a portability feature which allows borrowers to also transfer the mortgage default insurance associated with the mortgage loan.
We also provide portfolio credit enhancement insurance to lenders that have originated loans with loan-to-value ratios of less than or equal to 80%. These policies provide lenders with immediate capital relief from applicable bank regulatory capital requirements and facilitate the securitization of mortgages in the Canadian market.
In both primary flow insurance and portfolio policies, our mortgage insurance in Canada provides insurance coverage for the entire unpaid loan balance, including interest, selling costs and expenses. In the 2013 federal budget, the Canadian government proposed to gradually limit the insurance of low loan-to-value mortgages to only those mortgages that will be used in government backed securitization programs. We are in dialogue with the Canadian government as it designs the structure to implement the proposed changes. The final impact of these proposed changes on our business cannot be assessed at this time.
Government guarantee
We had an agreement with the Canadian government (the “Government Guarantee Agreement”) under which it guaranteed the benefits payable under a mortgage insurance policy, less 10% of the original principal amount of an insured loan, in the event that we fail to make claim payments with respect to that loan because of insolvency. We paid the Canadian government a risk premium for this guarantee and made other payments to the government guarantee fund, a reserve fund in respect of the government’s obligation. Because banks are not required to maintain regulatory capital on an asset backed by a sovereign guarantee, our 90% sovereign guarantee permits lenders purchasing our mortgage insurance to reduce their regulatory capital charges for credit risks on mortgages by 90%. Our primary government-sponsored competitor receives a 100% sovereign guarantee.
The Canadian government passed the Protection of Residential Mortgage or Hypothecary Insurance Act (Canada) (“PRMHIA”) in 2011 and PRMHIA came into force on January 1, 2013. The purpose of PRMHIA was to formalize existing mortgage insurance arrangements with private mortgage insurers and terminate the Government Guarantee Agreement, including the elimination of the Canadian government guarantee fund. The amount held in the Canadian government guarantee fund reverted back to us on January 1, 2013. See “Part II—Item 7—Management’s Discussion and Analysis of Financial Condition and Results of Operations— International Mortgage Insurance” and note 19 in our consolidated financial statements under “Part II—Item 8—Financial Statements and Supplementary Data” for additional information regarding the elimination of the Canadian government guarantee fund. As a result of the elimination of the guarantee fund, we are required to hold higher regulatory capital under PRMHIA and the Insurance Companies Act of Canada. However, the increase in required capital was predominantly offset by the increase in available capital that results from the guarantee fund assets that reverted back to us.
Under PRMHIA, all new mortgages that we insure and all mortgages that were previously insured and covered by the Government Guarantee Agreement will continue to be covered by the same 90% level of government guarantee
14
under PRMHIA. The maximum outstanding insured exposure for private insured mortgages was increased from CAD$250.0 billion to CAD$300.0 billion and the risk fee is equal to 2.25% of gross premiums written for private mortgage insurers. Under PRMHIA, our direct insurance activities continue to be restricted to insuring mortgages that meet the government mortgage insurance eligibility. Our reinsurance business is not subject to PRMHIA restrictions.
Over the past several years, the Canadian government also implemented a series of revisions to the rules for government guaranteed mortgages aimed at strengthening Canada’s housing finance system and ensuring the long-term stability of the Canadian housing market. Under PRMHIA, the regulations establish the following criteria a mortgage has to meet in order to be insured:
| • | a maximum mortgage amortization of 25 years |
| • | insurance of refinanced mortgage limited to loans with a loan-to-value of 80% or less |
| • | capping the maximum gross debt service ratios at 39% and total debt service ratios at 44% |
| • | capping home purchase price to less than $1 million |
| • | setting a minimum credit score of 600 |
We have incorporated these adjustments into our underwriting guidelines.
Competition
Our primary mortgage insurance competitor in Canada is the Canada Mortgage and Housing Corporation (“CMHC”) which is owned by the Canadian government, although we have one other private competitor in the Canadian market. CMHC’s mortgage insurance provides lenders with 100% capital relief from bank regulatory requirements. We compete with CMHC primarily based upon our reputation for high quality customer service, quick decision making on insurance applications, strong underwriting expertise, and provision of support services. As a result of the turmoil in the financial markets and tightened underwriting guidelines in 2009, there had been an increased preference by lenders for CMHC insurance, which carries a lower capital charge and a 100% government guarantee, as compared to loans covered by our policy which benefits from a 90% government guarantee. However, since 2009, this increased preference for CMHC insurance has moderated as financial markets stabilized.
Australia
We entered the Australian mortgage insurance market in 1997 and subsequently entered the New Zealand mortgage insurance market. In 2013, we were a leading provider of mortgage insurance in Australia based upon flow new insurance written. We maintain strong relationships within the major bank and regional bank channels, as well as building societies, credit unions and non-bank mortgage originators called mortgage managers. The four largest mortgage originators in Australia provide the majority of the financing for residential mortgage financing in that country. Approximately 60% of our total new flow insurance written in our Australian mortgage insurance business continues to be attributable to three of our largest customers, with a significant concentration attributable to our largest lending customer. We continue to serve multiple mortgage originators and target other expanded distribution relationships.
During 2011, we ceased writing new business in New Zealand, although we have committed to provide for a limited amount of time flow insurance on top-up loans, which allow a borrower to extend the credit limit on an existing loan. Our decision was made after consideration of the potential size of the high loan-to-value market and mortgage insurance value proposition. New Zealand represented approximately 2% of our insurance in-force for our mortgage insurance business in Australia as of December 31, 2013.
We previously announced a plan to pursue a sale of up to 40% of our Australian mortgage insurance business subject to market conditions, valuation considerations including business performance in Australia, and
15
regulatory approvals. Executing the planned sale, including through an initial public offering (“IPO”), remains a key priority in reducing our exposure to mortgage insurance risk, rebalancing the capital among our three main mortgage insurance platforms and generating capital. In Australia, there is concentration among a small group of banks that write most of the mortgages. These banks continue to evaluate the utilization of mortgage insurance in connection with the implementation of the bank capital standards in Australia introduced by the Basel Committee, and this could impact both the size of the private mortgage insurance market in Australia and our market share. The response of banks to the new capital standards will develop over time and this response could impact our Australian mortgage insurance business. The execution of the Australian IPO is a strategic priority for 2014, but execution is subject to market conditions, valuation considerations, including business performance, and regulatory considerations.
Products
In Australia, our main products are primary flow mortgage insurance, also known as lenders mortgage insurance (“LMI”), and portfolio credit enhancement policies. Our principal product is LMI which is similar to single premium primary flow insurance we offer in Canada with 100% coverage. Unlike in Canada, LMI policies are not portable in Australia. Lenders remit the single premium to us as the mortgage insurer following settlement of the loan and, generally, either collect the equivalent amount from the borrower at the time the loan proceeds are advanced or capitalize it in the loan.
Banks, building societies and credit unions generally acquire LMI only for residential mortgage loans with loan-to-value ratios above 80%. The Australian Prudential Regulation Authority (“APRA”) regulations for authorized deposit-taking institutions (“ADIs”) using the standard Basel II approach provide reduced capital requirements for high loan-to-value residential mortgages if they have been insured by a mortgage insurance company regulated by APRA. The capital levels for Australian internal ratings-based ADIs are determined by their APRA-approved internal ratings-based models, which may or may not allocate capital credit for LMI. We believe that APRA and the internal ratings-based ADIs have not yet finalized internal models for residential mortgage risk, so we do not believe that the internal ratings-based ADIs currently benefit from a reduction in their capital requirements for mortgages covered by mortgage insurance. APRA’s insurance authorization conditions require Australian mortgage insurance companies, including ours, to be monoline insurers, which are insurance companies that offer just one type of insurance product.
We also provide portfolio credit enhancement policies mainly to APRA-regulated lenders who intend to securitize Australian residential loans they have originated. Portfolio mortgage insurance serves as an important source of credit enhancement for the Australian securitization market, and our portfolio credit enhancement coverage is generally purchased for low loan-to-value, seasoned loans.
Competition
The Australian flow mortgage insurance market is primarily served by us and one other private mortgage insurance company, as well as various lender-affiliated captive mortgage insurance companies. In addition, some lenders may self-insure certain high loan-to-value mortgage risks. We compete primarily based upon our reputation for high quality customer service, quick decision making on insurance applications, strong underwriting expertise and flexibility in terms of product development and provision of support services.
Other Countries
We began our European operations in the United Kingdom, which is Europe’s largest market for mortgage loan originations, and over time have expanded our presence to additional countries. We are a large private mortgage insurance provider in Europe and have a leading market presence in select markets, based upon flow new insurance written. Since 2009, we have reduced our risk in-force in Europe, driven primarily by reductions in Spain and Ireland as a result of our loss mitigation activities, inclusive of normal course settlements. Currently,
16
we write new business in the United Kingdom, Italy, Germany and Finland. We are no longer writing new business in Spain and Ireland, which represented approximately 1% of our insurance in-force in our international mortgage insurance business and 22% of our insurance in-force in Other Countries as of December 31, 2013. Additionally, we have a presence in the private mortgage insurance market in Mexico, maintain a license in Korea with a small portfolio currently in runoff and continue to selectively assess other markets as well.
During the second quarter of 2012, we became a minority shareholder of a newly-formed joint venture partnership in India. The joint venture will offer mortgage guarantees against borrower defaults on housing loans from mortgage lenders in India. The financial impact of this joint venture was minimal during 2012 and 2013.
Products
Our mortgage insurance products in Europe consist principally of primary flow insurance with single premium payments. Our primary flow insurance generally provides first-loss coverage in the event of default on a portion (typically 10% to 20%) of the balance of an individual mortgage loan and our flow insurance policies are not portable. We also offer portfolio credit enhancement to facilitate the securitization of mortgage loans.
Competition
Our competition in Europe includes both public and private entities, including traditional insurance companies, as well as providers of alternative credit enhancement products and public mortgage guarantee facilities. Competition from alternative credit enhancement products include personal guarantees on high loan-to-value loans, second mortgages and bank guarantees, captive insurance companies organized by lenders, and alternative forms of risk transfer including capital markets solutions. We believe that our global expertise and coverage flexibility differentiate us from competitors and alternative products.
Underwriting
Loan applications for all flow loans we insure are reviewed to evaluate each individual borrower’s credit strength and history, the characteristics of the loan and the value of the underlying property. The credit strength of a borrower is evaluated by reviewing his or her credit history and credit score. Unlike in the United States where Fair Isaac Company (“FICO”) credit scores are broadly used, credit scores are not available in all countries. In countries, such as Canada, where scores are available, they are included in the underwriting guidelines used to evaluate the loan. Internal mortgage scoring models are also used in the underwriting processes of Canada and Australia. In addition, risk rules models, such as Blaze Advisor®, are used in Australia and Mexico to enhance the underwriter’s ability to evaluate the loan risk and make consistent underwriting decisions. Additional tools used by our international businesses include automated valuation models to evaluate property risk and fraud application prevention and management tools such as ModelMax® and Interceptor in Australia and CitadelTM in Canada.
Loan applications for flow mortgage insurance are reviewed by our employees or by employees of qualified mortgage lender customers who underwrite loan applications for mortgage insurance under a delegated underwriting program. This delegated underwriting program permits approved lenders to commit us to insure loans using underwriting guidelines we have previously approved. Each of our mortgage insurance platforms has established an audit plan to review delegated underwritten loans to ensure compliance with the approved underwriting guidelines, operational procedures and master policy requirements. Samples (statistically valid and/or stratified) of performing loans are requested and reviewed by our audit teams. Once an audit review has been completed, findings are summarized and evaluated against targets. If non-compliance issues are detected, we work with the lender to develop appropriate corrective actions which may include rescinding coverage on non-compliant loans or discontinuing delegated underwriting.
When underwriting bulk insurance transactions, we evaluate characteristics of the loans in the portfolio and examine loan files on a sample basis. Loans that do not meet the approved bulk parameters are removed from the
17
transaction. Each bulk transaction is assigned an overall claim rate based on a weighted-average of the expected claim rates for each stratified group of loans with similar characteristics that comprises the transaction.
Since 2009, we have taken additional actions to reduce our new business risk profile, which included: tightening underwriting guidelines, product restrictions, reducing new business in geographic areas we believe are more economically sensitive, and terminating commercial relationships as a result of weaker business performance. We have also increased prices in certain markets based on periodic reviews of product performance. We believe these underwriting and pricing actions have improved our performance on new books of business.
Loss mitigation
Each of our international mortgage insurance platforms works closely with lenders to identify and monitor delinquent borrowers. When a delinquency cannot be cured through basic collections, we will work with the lender and, if permitted, with the borrower to identify an optimal loan workout solution. If it is determined that the borrower has the capacity to make a modified mortgage payment, we will work with the lender to implement the most appropriate payment plan to address the borrower’s hardship situation. If the borrower does not have the capacity to make payments on a modified loan, we work with the lender and borrower to sell the property at the best price to minimize the severity of our claim and provide the borrower with a reasonable resolution. In Canada, we continue to execute a strategy to accelerate and facilitate the conveyance of real estate properties to us in selected circumstances. This strategy allows for better control of the remediation and marketing processes, reduction in carrying costs during the sale process and potential realization of a higher sales price with the cumulative impact being lower losses.
After a delinquency is reported to us, or after a claim is received, we review, and where appropriate conduct further investigations, to determine if there has been an event of underwriting non-compliance, non-disclosure of relevant information or any misrepresentation of information provided during the underwriting process. Our master policies provide that we may rescind coverage if there has been any failure to comply with agreed underwriting criteria or in the event of fraud or misrepresentation involving the lender or an agent of the lender. If such issues are identified, the claim or delinquent loan file is reviewed to determine the appropriate action, including potentially reducing the claim amount to be paid or rescinding the coverage. Generally, the issues we have initially identified are reviewed with the lender and the lender has an opportunity to provide further information or documentation to resolve the issue.
We may also review a group or portfolio of insured loans if we believe there may be systemic misrepresentations or non-compliance issues. If such issues are detected, we generally will work with the lender to develop an agreed settlement in respect of the group of loans so identified or, if such discussions fail to result in an agreed settlement, the lender may institute arbitration or other legal proceedings with respect to the loans for which we have rescinded or reduced coverage that are subject to the dispute. We have expanded these reviews to include collections activities in Mexico and Europe to determine compliance with our master policies. Where non-compliance is detected, we have negotiated settlements or have adjusted the claim for the impact of the servicing breach.
Distribution
We maintain dedicated sales forces that market our mortgage insurance products internationally to lenders. As in the U.S. market, our sales forces market to financial institutions and mortgage originators, who in turn offer mortgage insurance products to borrowers.
U.S. Mortgage Insurance
Through our U.S. Mortgage Insurance segment, we provide private mortgage insurance. Private mortgage insurance enables borrowers to buy homes with low-down-payment mortgages, which are usually defined as
18
loans with a down payment of less than 20% of the home’s value. Low-down-payment mortgages are sometimes also referred to as high loan-to-value mortgages. Mortgage insurance protects lenders against loss in the event of a borrower’s default. It also generally aids financial institutions in managing their capital efficiently by reducing the capital required for low-down-payment mortgages. If a borrower defaults on mortgage payments, private mortgage insurance reduces and may eliminate losses to the insured institution. Private mortgage insurance may also facilitate the sale of mortgage loans in the secondary mortgage market because of the credit enhancement it provides.
We have been providing mortgage insurance products and services in the United States since 1981 and operate in all 50 states and the District of Columbia. Our principal mortgage insurance customers are originators of residential mortgage loans who typically determine which mortgage insurer or insurers they will use for the placement of mortgage insurance written on loans they originate.
The U.S. private mortgage insurance industry is affected in part by the requirements and practices of the Federal National Mortgage Association (“Fannie Mae”) and the Federal Home Loan Mortgage Corporation (“Freddie Mac”). Fannie Mae and Freddie Mac are government-sponsored enterprises and we refer to them collectively as the “GSEs.” The GSEs purchase and provide guarantees on residential mortgages as part of their governmental mandate to provide liquidity through the secondary mortgage market. The GSEs purchased approximately 61%, 69% and 63% for the years ended December 31, 2013, 2012 and 2011, respectively, of all the mortgage loans originated in the United States, according to statistics published by Inside Mortgage Finance. The GSEs may purchase mortgages with unpaid principal amounts up to a specified maximum, known as the “conforming loan limit,” which is currently $417,000 (up to $625,000 in certain high-cost geographical areas of the country) and subject to annual adjustment.
Each GSE’s Congressional charter generally prohibits it from purchasing a mortgage where the loan-to-value ratio exceeds 80% of home value unless the portion of the unpaid principal balance of the mortgage in excess of 80% of the value of the property securing the mortgage is protected against default by lender recourse, participation or by a qualified insurer. As a result, high loan-to-value mortgages purchased by Fannie Mae or Freddie Mac generally are insured with private mortgage insurance. Fannie Mae and Freddie Mac purchased the majority of the flow loans we insured as of December 31, 2013. In furtherance of their respective charter requirements, each GSE has adopted eligibility criteria to establish when a mortgage insurer is qualified to issue coverage that will be acceptable to the GSEs for purchase or guarantee of high loan-to-value mortgages (the “MI Eligibility Standards”). Each GSE is currently considering changes to their respective MI Eligibility Standards and we expect these changes to include establishment of asset- and capital-related requirements, although we cannot predict the amount or the effective date of such changes.
We have taken steps to improve the financial condition of our U.S. mortgage insurance business throughout 2013. In April 2013, we completed our Capital Plan that provided additional capital support and other benefits to our U.S. mortgage insurance business. The Capital Plan included a cash contribution of $100 million, the transfer of ownership of our European mortgage insurance subsidiaries to Genworth Mortgage Insurance Corporation (“GEMICO”), our primary U.S. mortgage insurance subsidiary, and our holding company reorganization. In addition, in December 2013, Genworth Holdings issued $400 million of senior notes in anticipation of increased capital requirements expected to be imposed by the GSEs in connection with their revised MI Eligibility Standards. As of December 31, 2013, Genworth Financial contributed $100 million of the proceeds to GEMICO with an additional $300 million contributed to a U.S. mortgage holding company. The $100 million contribution in December 2013 to GEMICO, coupled with other performance-related actions, lowered GEMICO’s risk-to-capital ratio to approximately 19.3:1 as of December 31, 2013. We expect the $300 million contributed into our U.S. mortgage holding company will be further contributed to GEMICO, to the extent needed, for the benefit of its capital position after the changes to the asset and capital requirements in the revised GSE MI Eligibility Standards are finalized. In connection with this additional $300 million contribution to GEMICO, we will also evaluate the overall performance of our U.S. mortgage insurance business and conditions existing in the U.S. mortgage insurance industry at the time we decide to make the contribution. If the $300 million had been contributed to
19
GEMICO, its risk-to-capital ratio as of December 31, 2013 would have been lower by approximately four points. In addition to the available funds held at the U.S. mortgage holding company, we have various alternatives available to us to manage GEMICO’s future capital position, including organic earnings growth; utilization of a portion of available deferred tax assets; possible reinsurance transactions; use of proceeds from the planned Australian IPO; issuance of convertible or exchangeable securities at the Genworth Financial and/or the Genworth Holdings levels; and other options that may be available. While there is no assurance that our U.S. mortgage insurance subsidiaries would meet any revised GSE capital-related requirements by their effective date, we currently believe that we could implement one or more of these alternatives so that we would continue to be an eligible provider of mortgage insurance after any new GSE capital-related requirements would be in effect.
The following table sets forth selected financial information regarding our U.S. Mortgage Insurance segment as of or for the periods indicated. Additional selected financial information and operating performance measures regarding our U.S. Mortgage Insurance segment as of or for these periods are included under “Part II—Item 7—Management’s Discussion and Analysis of Financial Condition and Results of Operations—U.S. Mortgage Insurance.”
| As of or for the years ended December 31, |
||||||||||||
| (Amounts in millions) |
2013 | 2012 | 2011 | |||||||||
| Total revenues |
$ | 616 | $ | 676 | $ | 702 | ||||||
|
|
|
|
|
|
|
|||||||
| Net operating income (loss) |
$ | 37 | $ | (138 | ) | $ | (524 | ) | ||||
| Net investment gains (losses), net of taxes and other adjustments |
— | 24 | 30 | |||||||||
|
|
|
|
|
|
|
|||||||
| Income (loss) from continuing operations available to Genworth Financial, Inc.’s common stockholders |
$ | 37 | $ | (114 | ) | $ | (494 | ) | ||||
|
|
|
|
|
|
|
|||||||
| Total segment assets |
$ | 2,361 | $ | 2,357 | $ | 2,966 | ||||||
|
|
|
|
|
|
|
|||||||
Products and services
The majority of our U.S. mortgage insurance policies provide default loss protection on a portion (typically 10% to 40%) of the balance of an individual mortgage loan. Our primary mortgage insurance policies are predominantly “flow” insurance policies, which cover individual loans at the time the loan is originated. We also enter into “bulk” insurance transactions with lenders and investors in selected instances, under which we insure a portfolio of loans at or after origination for a negotiated price and terms.
In addition to flow and bulk primary mortgage insurance, we have in prior years written mortgage insurance on a pool basis. Under pool insurance, the mortgage insurer provides coverage on a group of specified loans, typically for 100% of all losses on every loan in the portfolio, subject to an agreed aggregate loss limit contemporaneously with loan origination.
Flow insurance
Flow insurance is primary mortgage insurance placed on an individual loan pursuant to the terms and conditions of a master policy. Our primary mortgage insurance covers default risk on first mortgage loans generally secured by one- to four-unit residential properties and can be used to protect mortgage lenders and investors from default on any type of residential mortgage loan instrument that we have approved. Our insurance covers a specified coverage percentage of a “claim amount” consisting of unpaid loan principal, delinquent interest and certain expenses associated with the default and subsequent foreclosure. As the insurer, we are generally required to pay the coverage percentage of a claim amount specified in the primary master policy, but we also have the option to pay the lender an amount equal to the unpaid loan principal, delinquent interest and certain expenses incurred with the default and foreclosure, and acquire title to the property. In addition, the claim
20
amount may be reduced or eliminated if the loss on the defaulted loan is reduced as a result of the lender’s disposition of the property. The lender selects the coverage percentage at the time the loan is originated, often to comply with investor requirements to reduce the loss exposure on loans purchased by the investor. Our master policies require that loans be underwritten to approved guidelines and provide for cancellation of coverage and return of premium for material breach of obligations. Our master policies generally do not extend to or cover material breach of obligations and misrepresentations known to the insured or specified agents. From time to time, based on various factors, we request loan files to verify compliance with our master policies and required procedures. Where our review and any related investigation establish material non-compliance or misrepresentation or there is a failure to deliver complete loan files as required, we rescind coverage with a return of all premiums paid.
We also perform fee-based contract underwriting services for mortgage lenders. The provision of underwriting services by mortgage insurers eliminates the duplicative lender and mortgage insurer underwriting activities and speeds the approval process. Under the terms of our contract underwriting agreements, we agree to indemnify the lender against losses incurred in the event we make material errors in determining whether loans processed by our contract underwriters meet specified underwriting or purchase criteria, subject to contractual limitations on liability.
In prior years, our U.S. mortgage insurance business entered into a number of reinsurance agreements in which we share portions of our flow mortgage insurance risk written on loans originated or purchased by lenders with captive reinsurers affiliated with these lenders. In return, we cede a predetermined portion of our gross premiums on insurance written to the captive reinsurers. Substantially all of our captive mortgage reinsurance arrangements are structured on an excess of loss basis. In April 2013, we agreed under the terms and conditions of a consent order with the Consumer Finance Protection Bureau (“CFPB”) not to enter into any new captive reinsurance transactions for a period of 10 years without the prior consent of the CFPB. As of December 31, 2013, our U.S. mortgage insurance risk in-force reinsured to all captive reinsurers was $216 million, and the total capital held in trust for our benefit by all captive reinsurers was $286 million. These captive reinsurers are not rated, and their claims-paying obligations to us are secured by an amount of capital held in trust as determined by the underlying treaties. As of December 31, 2013 and 2012, we ceded U.S. mortgage insurance loss reserves of $44 million and $80 million, respectively, under these captive reinsurance arrangements. We have exhausted certain captive reinsurance tiers for our 2005 through 2008 book years based on loss development trends. Once the captive reinsurance or trust assets are exhausted, we are responsible for any additional losses incurred. All of our excess of loss captive reinsurance arrangements are in runoff with no new insured books of business being added going forward; however, while this level of benefit is declining, we do continue to benefit from captive reinsurance on our 2005 through 2008 books of business. New insurance written through the bulk channel generally is not subject to these arrangements.
The following table sets forth selected financial information regarding our captive reinsurance arrangements as of or for the periods indicated:
| As of or for the years ended December 31, |
||||||||||||
| 2013 | 2012 | 2011 | ||||||||||
| Flow risk in-force subject to captive reinsurance arrangements, as a percentage of flow risk in-force |
9 | % | 14 | % | 34 | % | ||||||
| Primary risk in-force subject to captive reinsurance arrangements, as a percentage of total primary risk in-force |
9 | % | 14 | % | 33 | % | ||||||
| Gross written premiums ceded pursuant to captive reinsurance arrangements, as a percentage of total gross written premiums |
4 | % | 9 | % | 15 | % | ||||||
| Primary new risk written subject to captive reinsurance arrangements, as a percentage of total primary new risk written |
1 | % | 2 | % | 2 | % | ||||||
21
Bulk insurance
Under primary bulk insurance, we insure a portfolio of loans in a single, bulk transaction. Generally, in our bulk insurance, the individual loans in the portfolio are insured to specified levels of coverage and there may be deductible provisions and aggregate loss limits applicable to all of the insured loans. In addition, loans that we insure in bulk transactions with loan-to-value ratios above 80% typically are also covered by flow mortgage insurance, written either by us or another private mortgage insurer, which helps mitigate our exposure under the bulk transactions. We base the premium on our bulk insurance upon our evaluation of the overall risk of the insured loans included in a transaction and we negotiate the premium directly with the securitizer or other owner of the loans. Premiums for bulk transactions generally are paid monthly by lenders, investors or a securitization vehicle in connection with a securitization transaction or the sale of a loan portfolio.
Pool insurance
Pool insurance generally covers the loss on a defaulted mortgage loan that either exceeds the claim payment under the primary coverage (if primary insurance is required on that loan) or the total loss (if that loan does not require primary insurance), in each case up to a stated aggregate loss limit on the pool. We do not currently write pool insurance.
Underwriting and pricing
Loan applications for all flow loans we insure are reviewed to evaluate each individual borrower’s credit strength and history, the characteristics of the loan and the value of the underlying property.
Fair Isaac Company developed the FICO credit scoring model to calculate a score based upon a borrower’s credit history. We use the FICO credit score as one indicator of a borrower’s credit quality. Typically, a borrower with a higher credit score has a lower likelihood of defaulting on a loan. FICO credit scores range up to 850, with a score of 620 or more generally viewed as a “prime” loan and a score below 620 generally viewed as a “sub-prime” loan. A minus loans generally are loans where the borrowers have FICO credit scores between 575 and 660, and where the borrower has a blemished credit history. As of December 31, 2013, on a risk in-force basis and at the time of loan closing, approximately 96% of our primary insurance loans were “prime” in credit quality with FICO credit scores of at least 620, approximately 3% had FICO credit scores between 575 and 619, and approximately 1% had FICO credit scores of 574 or less. Loan applications for flow mortgage insurance are either directly reviewed by us (or our contract underwriters), or as noted below, by lenders under delegated authority and either course may utilize automated underwriting systems. The majority of our mortgage lender customers underwrite loan applications for mortgage insurance under a delegated underwriting program, in which we permit approved lenders to commit us to insure loans using underwriting guidelines we have previously approved. When underwriting bulk insurance transactions, we evaluate credit scores and loan characteristics of the loans in the portfolio and examine loan files on a sample basis.
We previously offered mortgage insurance for Alt-A loans, which were originated under programs in which there was a reduced level of verification or disclosure of the borrower’s income or assets and a higher historical and expected default rate at origination than standard documentation loans; Interest Only loans which allowed the borrower flexibility to pay interest only, or to pay interest and as much principal as desired, during an initial period of time; and payment option adjustable rate mortgages, which typically provided four payment options that a borrower could select for the first five years of a loan. Since 2007, we have made a number of adjustments to our underwriting and pricing guidelines intended to improve the risk and profitability profiles of new business written and the related effect on capital. These measures included exiting certain products and types of coverages, changing prices, product levels and underwriting guidelines, imposing geographical and third-party loan origination guidelines, refining delegated underwriting guidelines, developing specific underwriting guidelines on lower-credit and higher loan-to-value risks and adjusting restrictions on FICO and debt-to-income ratios. Sequentially, in September and October 2013, we announced reduced pricing and expanded underwriting
22
guidelines that we believe are generally competitive with prevailing industry prices and guideline standards. We continue to monitor current housing conditions and the performance of our books of business to determine if we need to make further changes in our underwriting guidelines and practices.
Loss mitigation
We request loan files to verify compliance with our master policies. Our master policy gives us the right to obtain a copy of the complete loan file for any insured loan. If no file is produced in response to our request, the master policy provides that coverage may be canceled. If a file is delivered but lacks certain documents that are critical to demonstrating compliance with applicable underwriting standards (discussed below) or to our ability to investigate the loan for misrepresentation, we issue a follow-up request and give the servicer an additional period of time (approximately 30 additional days) to produce the missing documents. If these documents are not received after the additional time period, the master policy provides that coverage may be canceled.
Where underwriting is delegated to counterparties under specified criteria, our master policy requires that an insured loan be underwritten “in strict accordance” with applicable guidelines. Where our file review finds material non-compliance with the guidelines, the master policy provides that coverage may be canceled. The master policy also excludes coverage for fraud and misrepresentation, among other matters. Where our investigation establishes non-compliance or fraud or misrepresentation involving an agent of the lender, we invoke our rights by issuing a letter rescinding coverage on the loan.
Following an action to rescind coverage on insured loan certificates, we permit reconsideration of our decision to rescind such coverage through an appeals process. If an insured counterparty appeals our decision to rescind coverage on given loan certificates and we concur that new or additional information is sufficient for us to reinstate coverage, we take the necessary steps to reinstate uninterrupted insurance coverage and reactivate the loan certificate. If the parties are unable to resolve the dispute within the stated appeal period provided by us and such additional time as the parties may agree to, lenders may choose to pursue arbitration or litigation under the master policies and challenge the results. If arbitrated, ultimate resolution of the dispute would be pursuant to a panel’s binding arbitration award. Challenges to rescissions may be made several years after we have rescinded coverage on an insured loan certificate. As part of our loss mitigation efforts, we routinely investigate insured loans and evaluate the related servicing to ensure compliance with applicable requirements under our master policy. As a result, from time to time, we curtail the amount of the claim payable based upon this evaluation.
Estimated savings related to rescissions are the reduction in carried loss reserves, net of premium refunds and reinstatement of prior rescissions. Estimated savings related to loan modifications and other cure-related loss mitigation actions represent the reduction in carried loss reserves. Estimated savings related to claims mitigation activities represent amounts deducted or “curtailed” from claims due to acts or omissions by the insured or the servicer with respect to the servicing of an insured loan that is not in compliance with obligations under our master policy. For non-cure-related actions, including pre-sales, the estimated savings represent the difference between the full claim obligation and the actual amount paid. If a loan certificate that was previously rescinded is reinstated and the underlying loan certificate remains delinquent, we record an accrual for any liabilities that were relieved in connection with our decision to rescind coverage on the loan certificate. Loans subject to our loss mitigation actions, the results of which have been included in our reported estimated loss mitigation savings, are subject to re-default and may result in a potential claim in future periods.
Distribution
We distribute our mortgage insurance products through our dedicated sales force throughout the United States. This sales force primarily markets to financial institutions and mortgage originators, which impose a requirement for mortgage insurance as part of the borrower’s financing. In addition to our field sales force, we also distribute our products through a telephone sales force serving our smaller lenders, as well as through our “Action Center” which provides live phone and web chat-based support for all customer segments.
23
Competition
In 2013, our principal sources of competition comprised U.S. and state government agencies and other private mortgage insurers. Historically, we have also competed with mortgage lenders and other investors, the GSEs, the Federal Home Loan Banks (“FHLBs”), structured transactions in the capital markets and with other financial instruments designed to mitigate credit risk.
U.S. and state government agencies. We and other private mortgage insurers compete for flow business directly with U.S. federal and state governmental and quasi-governmental agencies, principally the Federal Housing Administration (“FHA”) and, to a lesser degree, the Veteran’s Administration (“VA”). In addition to competition from the FHA and the VA, we and other private mortgage insurers face competition from state-supported mortgage insurance funds in several states, including California, Illinois and New York.
Private mortgage insurers. Since the financial crisis, the competitive landscape of the U.S. private mortgage insurance industry has changed and continues to do so. Over that period, certain competitors ceased writing new business while other new entrants began writing business. While we cannot predict the level of impact, continued changes in the competitive landscape of the U.S. private mortgage insurance industry will likely impact our sales levels. The private mortgage insurance industry currently consists of seven active mortgage insurers, including us.
Mortgage lenders and other investors. We and other mortgage insurers have competed with transactions structured by mortgage lenders to avoid mortgage insurance on low-down-payment mortgage loans. These transactions include self-insuring and simultaneous second loans, which separate a mortgage with a loan-to-value ratio of more than 80%, which in the absence of such a structure would require mortgage insurance, into two loans: a first mortgage with a loan-to-value ratio of 80% and a simultaneous second mortgage for the excess portion of the loan.
The GSEs—Fannie Mae, Freddie Mac and FHLBs. As the predominant purchasers of conventional mortgage loans in the United States, Fannie Mae and Freddie Mac provide a direct link between mortgage origination and capital markets. As discussed above, most high loan-to-value mortgages purchased by Fannie Mae or Freddie Mac are insured with private mortgage insurance issued by an insurer deemed qualified by the GSEs. Private mortgage insurers may be subject to competition from Fannie Mae and Freddie Mac to the extent the GSEs are compensated for assuming default risk that would otherwise be insured by the private mortgage insurance industry. In February 2011, the Obama Administration issued a white paper setting forth various proposals to gradually eliminate Fannie Mae and Freddie Mac. Since that date, members of Congress, various housing experts and others within the industry have also published similar proposals. We cannot predict whether or when any proposals will be implemented, and if so, in what form, nor can we predict the effect such proposals, if so implemented, would have on our business, results of operations or financial condition.
We also compete with structured transactions in the capital markets and other financial instruments designed to mitigate the risk of mortgage defaults, such as credit default swaps and credit linked notes, with reinsurers of mortgage insurance risk and with lenders who forego mortgage insurance (self-insure) on loans held in their portfolios.
The MI Eligibility Standards include specified insurance coverage levels established by the GSEs. The GSEs have the authority to change the pricing arrangements for purchasing retained-participation mortgages, or mortgages with lender recourse, as compared to insured mortgages, increase or reduce required mortgage insurance coverage percentages, and alter or liberalize underwriting standards and pricing terms on low-down-payment mortgages they purchase. In addition to the GSEs, FHLBs purchase single-family conforming mortgage loans. Although not required to do so, the FHLBs currently use mortgage insurance on substantially all mortgage loans with a loan-to-value ratio above 80%.
24
Corporate and Other Division
International Protection
The following table sets forth financial information regarding our International Protection segment as of or for the periods indicated. Additional selected financial information and operating performance measures regarding our International Protection segment as of or for these periods are included under “Part II—Item 7—Management’s Discussion and Analysis of Financial Condition and Results of Operations—International Protection.”
| As of or for the years ended December 31, |
||||||||||||
| (Amounts in millions) |
2013 | 2012 | 2011 | |||||||||
| Total revenues |
$ | 786 | $ | 822 | $ | 1,022 | ||||||
|
|
|
|
|
|
|
|||||||
| Net operating income |
$ | 24 | $ | 24 | $ | 91 | ||||||
| Net investment gains (losses), net of taxes and other adjustments |
18 | 3 | (1 | ) | ||||||||
| Expenses related to restructuring, net of taxes |
(3 | ) | — | — | ||||||||
| Goodwill impairment, net of taxes |
— | (86 | ) | — | ||||||||
|
|
|
|
|
|
|
|||||||
| Income (loss) from continuing operations available to Genworth Financial, Inc.’s common stockholders |
$ | 39 | $ | (59 | ) | $ | 90 | |||||
|
|
|
|
|
|
|
|||||||
| Total segment assets |
$ | 2,061 | $ | 2,145 | $ | 2,375 | ||||||
|
|
|
|
|
|
|
|||||||
Lifestyle protection insurance
We currently provide lifestyle protection insurance that is principally offered by financial services companies at the point of sale of consumer products and we have a presence in more than 20 countries. We expect to selectively expand our lifestyle protection insurance business through entry into certain new markets, further penetration of existing distribution relationships, participation in additional distribution channels and introduction of new products. In Europe, we are a leading provider of lifestyle protection insurance.
Products and services
Our lifestyle protection insurance products include primarily protection from illness, accident, involuntary unemployment, disability and death. The benefits on these policies pay the periodic payments on a consumer loan or other form of committed payment for a limited period of time, typically 12 months, though they can be up to 84 months. In some cases, for certain coverages, we may make lump sum payments. Our policies that cover disability and unemployment include an exclusion period that is usually 30 to 90 days, respectively, and a waiting period (time between claim submission and claim payment) of typically 30 days. Our policies either require an upfront single premium or monthly premiums.
We also provide third-party administrative services and administer non-risk premium with some relationships in Europe. Additionally, we have entered into structured portfolio transactions covering risks in Canada, Europe and Asia.
Underwriting and pricing
Our lifestyle protection insurance products are currently underwritten and priced on a program basis, by type of product and by distributor, rather than on an individual policyholder basis. In setting prices and in some cases the nature of coverage offered, we take into account the underlying obligation, the particular product features and the average customer profile of a given distributor. For our monthly premium policies, most contracts allow for monthly price adjustments after consultation with our distribution partners which help us to
25
reduce our business risk profile when there are adverse changes in the market. Additionally, certain of our distribution contracts provide for profit or loss sharing with our distribution partners, which provide our business and our distribution partners with risk protection and aligned economic interests over the life of the contract. We believe our experience in underwriting allows us to provide competitive pricing to distributors and generate targeted returns and profits for our business.
Distribution
We distribute our lifestyle protection insurance products primarily through financial institutions, including major European banks, that offer our insurance products in connection with underlying loans or other financial products they sell to their customers. Under these arrangements, the distributors typically take responsibility for branding and marketing the products, while we take responsibility for pricing, underwriting and claims payment.
We have strengthened our focus in Europe on key strategic client relationships and will be de-emphasizing our distribution with distributors with marginal profitability and size. This focus will enable us to better serve our strategic clients and promote process productivity and a lower cost structure over time. Additionally, we continue to pursue expanding our current geographical distribution in Latin America and building new distribution in China and have secured large insurance partners in both of these regions. We are currently working with these partners to establish product, distribution and servicing capabilities in order to bring our products and services to the market.
Competition
The lifestyle protection insurance market has several large, international participants, including both captive insurers of large financial institutions and independent providers. We compete through our high service levels, depth of expertise in providing tailored product and service solutions and our ability to service clients at a local level and across multiple countries.
Runoff
The Runoff segment includes the results of non-strategic products which are no longer actively sold. Our non-strategic products primarily include variable annuity, variable life insurance, institutional, corporate-owned life insurance and Medicare supplement insurance products. We expect to manage our runoff products for at least the next several years. Several factors may impact the time period for these products to runoff including the specific policy types, economic conditions and management strategies.
The following table sets forth financial information regarding our Runoff segment as of or for the periods indicated. Additional selected financial information and operating performance measures regarding our Runoff segment as of or for these periods are included under “Part II—Item 7—Management’s Discussion and Analysis of Financial Condition and Results of Operations— Runoff.”
| As of or for the years ended December 31, |
||||||||||||
| (Amounts in millions) |
2013 | 2012 | 2011 | |||||||||
| Total revenues |
$ | 302 | $ | 381 | $ | 525 | ||||||
|
|
|
|
|
|
|
|||||||
| Net operating income |
$ | 66 | $ | 46 | $ | 27 | ||||||
| Net investment gains (losses), net of taxes and other adjustments |
(17 | ) | 12 | (100 | ) | |||||||
| Gain on sale of business, net of taxes |
— | — | 36 | |||||||||
|
|
|
|
|
|
|
|||||||
| Income (loss) from continuing operations available to Genworth Financial, Inc.’s common stockholders |
$ | 49 | $ | 58 | $ | (37 | ) | |||||
|
|
|
|
|
|
|
|||||||
| Total segment assets |
$ | 14,062 | $ | 15,308 | $ | 16,031 | ||||||
|
|
|
|
|
|
|
|||||||
26
Products
Variable annuities and variable life insurance
Our variable annuities provide contractholders the ability to allocate purchase payments and contract value to underlying investment options available in a separate account format. The contractholder bears the risk associated with the performance of investments in the separate account. In addition, some of our variable annuities permit customers to allocate assets to a guaranteed interest account managed within our general account. Certain of our variable annuity products provide contractholders with lifetime guaranteed income benefits. Our variable annuity products generally provide guaranteed minimum death benefits (“GMDBs”) and may provide guaranteed minimum withdrawal benefits (“GMWBs”) and certain types of guaranteed annuitization benefits.
Variable annuities generally provide us fees including mortality and expense risk charges and, in some cases, administrative charges. The fees equal a percentage of the contractholder’s policy account value or related benefit base value, and as of December 31, 2013, ranged from 0.75% to 4.20% per annum depending on the features and options within a contract.
Our variable annuity contracts with a basic GMDB provide a minimum benefit to be paid upon the annuitant’s death, usually equal to the larger of account value and the return of net deposits. Some contractholders also have riders that provide enhanced death benefits. Assuming every annuitant died on December 31, 2013, as of that date, contracts with death benefit features not covered by reinsurance had an account value of $7,017 million and a related death benefit exposure, or net amount at risk, of $120 million.
Some of our variable annuity products provide the contractholder with a guaranteed minimum income stream that they cannot outlive, along with an opportunity to participate in market appreciation.
In January 2011, we discontinued new sales of retail and group variable annuities; however, we continue to service our existing block of business which could include additional deposits on existing contracts.
Institutional
Our institutional products consist of funding agreements, FABNs and GICs, which are deposit-type products that pay a guaranteed return to the contractholder on specified dates. We explore periodic issuance of our institutional products for asset-liability management purposes.
Corporate-owned life insurance
We do not solicit sales of our corporate-owned life insurance product; however, we continue to manage our existing block of business.
Medicare supplement insurance
Medicare supplement insurance provides supplemental insurance coverage to seniors who participate in the Medicare program. This product covers deductibles and coinsurance amounts that are not covered by traditional Medicare, which seniors without supplemental coverage would have to pay out-of-pocket. Effective October 1, 2011, we completed the sale of our Medicare supplement insurance business. The transaction included the sale of Continental Life Insurance Company of Brentwood, Tennessee and its subsidiary, American Continental Insurance Company, and the reinsurance of the Medicare supplement insurance in-force business written by other Genworth life insurance subsidiaries. See note 8 in our consolidated financial statements under “Part II—Item 8—Financial Statements and Supplementary Data” for additional information related to the sale.
Corporate and Other Activities
Our Corporate and Other activities include debt financing expenses that are incurred at the Genworth Holdings level, unallocated corporate income and expenses, eliminations of inter-segment transactions and the results of other businesses, such as our reverse mortgage business, that are managed outside our operating segments, including discontinued operations.
27
Effective April 1, 2013 (immediately prior to the holding company reorganization), Genworth Holdings completed the sale of its reverse mortgage business for total proceeds of $22 million. The gain on the sale was not significant.
On August 30, 2013, we sold our wealth management business to AqGen Liberty Acquisition, Inc., a subsidiary of AqGen Liberty Holdings LLC, a partnership of Aquiline Capital Partners and Genstar Capital, for approximately $412 million. This business was accounted for as discontinued operations and its financial position, results of operations and cash flows were separately reported for all periods presented. We received net proceeds of approximately $360 million from the sale. Also included in discontinued operations was our tax and advisor unit, GFIS, which was part of our wealth management business until its sale on April 2, 2012. See note 25 in our consolidated financial statements under “Part II—Item 8—Financial Statements and Supplementary Data” for additional information related to discontinued operations.
International Operations
Information regarding our international operations is presented in note 20 to the consolidated financial statements under “Part II—Item 8—Financial Statements and Supplementary Data” of this Annual Report on Form 10-K.
Marketing
As an insurance provider, we position, promote and differentiate our products and services through product value and innovation, risk management expertise, specialized support and technology for our distributors and marketing programs tailored to particular consumer groups.
We offer a targeted set of products that are designed to meet key needs of consumers throughout the various stages of their lives, with a focus on consumers with household incomes of between $50,000 and $250,000. We are selective in the products we offer and seek to maintain appropriate return and risk thresholds on our product offerings. We also have developed technological approaches that enhance performance by automating key processes and reducing response times, expenses and process variations. We believe these approaches also make it easier for our customers and distributors to do business with us.
We have focused our marketing approach on promoting our products, services and brand to key constituencies, including sales intermediaries, consumers, employees and investors. We seek to build recognition of our offerings and brand, and maintain deep relationships with leading distributors by providing specialized and differentiated distribution support, including product training, sales services and technology solutions that support the distributors’ sales efforts. We also leverage technology to extend our brand and marketing communications, using interactive tools, search engine marketing expertise and efficient web services to enhance our customers’ experience.
Our publications on financial security issues help build our brand and inform our key constituencies, such as distributors, consumers, policymakers and regulators, on relevant topics, including the cost of long-term care, the life insurance coverage gap, consumer financial security as well as mortgage and mortgage insurance trends. In addition, we sponsor various advisory councils with independent sales intermediaries and dedicated sales specialists to gather their feedback on industry trends, new product ideas, approaches to improve service and ways to enhance our relationships.
Risk Management
Risk management is a critical part of our business. We have an enterprise risk management (“ERM”) framework that includes risk management processes relating to economic capital analysis, product development and management, economic pricing management, asset-liability management, investment activities, portfolio diversification, underwriting and risk and loss mitigation, financial databases and information systems, business acquisitions and dispositions, and operational capabilities. The risk management framework includes the
28
assessment of risks, a proactive decision process to determine which risks are acceptable to be retained, risk and reward considerations, limit setting on major risks, emerging risk identification and the ongoing monitoring and management of those risks. We have emphasized our adherence to risk management disciplines and leveraged these efforts into a competitive advantage in distribution and management of our products.
Our evaluation of in-force product performance, new product initiatives and risk mitigation alternatives includes monitoring regulatory and rating agency capital models as well as internal economic capital models to determine the appropriate level of risk-adjusted capital. We utilize our internal economic capital model to assess the risk of loss to our capital resources based upon the portfolio of risks we underwrite and retain and upon our asset and operational risk profiles. Our commitment to risk management involves the ongoing review and expansion of internal capabilities with improved infrastructure and modeling.
Product development and management
Our risk management process begins with the development and introduction of new products and services. We have established a product development process that specifies a series of required analyses, reviews and approvals for any new product. For each proposed product, this process includes a review of the market opportunity and competitive landscape, major pricing assumptions and methodologies, return expectations and potential distributions, reinsurance and other risk mitigating strategies, underwriting criteria, legal, compliance and business risks and potential mitigating actions. Before we introduce a new product, we establish a monitoring program with specific performance targets and leading indicators, which we monitor frequently to identify any deviations from expected performance so that we can take corrective action when necessary. Significant product introductions, measured either by volume, level or type of risk, require approval by our senior management team at either the business or enterprise level.
We use a similar process to introduce changes to existing products and to offer existing products in new markets and through new distribution channels. Product performance reviews include an analysis of the major drivers of profitability, underwriting performance and variations from expected results including an in-depth experience analysis of the product’s major risk factors. Other areas of focus include the regulatory and competitive environments and other emerging factors that may affect product performance.
In addition, we initiate special reviews when a product’s performance fails to meet the indicators we established during that product’s introductory review process for subsequent reviews of in-force blocks of business. If a product does not meet our performance criteria, we consider adjustments in pricing, design and marketing or ultimately discontinuing sales of that product. We review our underwriting, pricing, distribution and risk selection strategies on a regular basis in an effort to ensure that our products remain competitive and consistent with our marketing and profitability objectives. For example, in our U.S. and international mortgage insurance and lifestyle protection insurance businesses, we review the profitability of lender accounts to assess whether our business with these lenders is achieving anticipated performance levels and to identify trends requiring remedial action, including changes to underwriting guidelines, product mix or other customer performance.
Asset-liability management
We maintain segmented investment portfolios for the majority of our product lines. This enables us to perform an ongoing analysis of the interest rate, credit and liquidity risks associated with each major product line, in addition to the interest rate and credit risks for our overall enterprise versus approved limits. We analyze the behavior of our liability cash flows across a wide variety of scenarios, reflecting policy features and expected policyholder behavior. We also analyze the cash flows of our asset portfolios across the same scenarios. We believe this analysis shows the sensitivity of both our assets and liabilities to changes in economic environments and enables us to manage our assets and liabilities more effectively. In addition, we deploy hedging programs to
29
mitigate certain economic risks associated with our assets, liabilities and capital. For example, we partially hedge the equity, interest rate and market volatility risks in our variable annuity products, as well as interest rate risks in our long-term care insurance products.
Portfolio diversification and investments
We use new business and in-force product limits to manage our risk concentrations and to manage product, business level, geographic and other risk exposures. We manage unique product exposures in our business segments. For example, in managing our mortgage insurance risk exposure, we monitor geographic concentrations in our portfolio and the condition of housing markets in each major area in the countries in which we operate. We also monitor fundamental price indicators and factors that affect home prices and their affordability at the national and regional levels.
In addition, our assets are managed within limitations to control credit risk and to avoid excessive concentration in our investment portfolio using defined investment and concentration guidelines that help ensure disciplined underwriting and oversight standards. We seek diversification in our investment portfolio by investing in multiple asset classes, tailored to match the cash flow characteristics of our liabilities, and actively monitoring exposures, changes in credit characteristics and shifts in markets.
We utilize surveillance and quantitative credit risk analytics to identify concentrations and drive diversification of portfolio risks. Issuer credit limits for the investment portfolios of each of our businesses (based on business capital, portfolio size and relative issuer cumulative default risk) govern and control credit concentrations in our portfolio. Derivatives counterparty risk and credit derivatives are integrated into issuer limits as well. We also limit and actively monitor country and sovereign exposures in our global portfolio and evaluate and adjust our risk profiles, where needed, in response to geopolitical and economic developments in the relevant areas.
Underwriting and risk and loss mitigation
Underwriting guidelines for all products are routinely reviewed and adjusted as needed to ensure policyholders are provided with the appropriate premium and benefit structure. We seek external reviews from the reinsurance and consulting communities and are able to utilize their experience to calibrate our risk taking to expected outcomes.
Our risk and loss mitigation activities include ensuring that new policies are issued based on accurate information that we receive and that policy benefit payments are paid in accordance with the policy contract terms.
Financial databases and information systems
Our financial databases and information systems technology are important tools in our risk management. For example, we believe we have the largest database for long-term care insurance claims with nearly 40 years of experience in offering those products. We also have substantial experience in offering individual life insurance products with a large database of claims experience, particularly in preferred risk classes, which has significant predictive value. We have extensive data on the performance of mortgage originations in the United States and other major markets we operate in which we use to assess the drivers and distributions of delinquency and claims experience.
We use advanced and, in some cases, proprietary technology to manage variations in our underwriting process. For example, in our mortgage insurance businesses, we use borrower credit bureau information, proprietary mortgage scoring models and/or our extensive database of mortgage insurance experience along with external data including rating agency data to evaluate new products and portfolio performance. In the United States and Canada, our proprietary mortgage scoring models use the borrower’s credit score and additional data concerning the borrower, the loan and the property, including loan-to-value ratio, loan type, loan amount, property type, occupancy status and borrower employment to predict the likelihood of having to pay a claim. In addition, our models take into
30
consideration macroeconomic variables such as unemployment, interest rate and home price changes. We believe assessing housing market and mortgage loan attributes across a range of economic outcomes enhances our ability to manage and price for risk. We perform portfolio analysis on an ongoing basis to determine if modifications are required to our product offerings, underwriting guidelines or premium rates.
Business acquisitions and dispositions
When we consider an acquisition or a disposition of a block or book of business or entity, we use various business, financial and risk management disciplines to evaluate the merits of the proposals and assess its strategic fit with our current business model. We have a review process that includes a series of required analyses, reviews and approvals similar to those employed for new product introductions.
Operational capabilities
We have several risk management programs in place to ensure the continued operation of our businesses in the event of potential disruptive natural or man-made events. Business continuity plans are regularly reviewed and tested. All data is backed up on a nightly basis to alternative locations that are geographically separated.
A number of investigative teams are maintained in our various locations to address any potential fraudulent activities both from internal and external sources.
Operations and Technology
Service and support
In our U.S. Life Insurance segment, we interact directly with our independent sales intermediaries and dedicated sales specialists through secure websites that have enabled them to transact business with us electronically. Our process and technology solutions deliver fast, consistent and efficient transactions. Simplifying the pre-sale, application and post-sale experience allows us to provide industry-leading cycle times and customer satisfaction.
In our International Mortgage Insurance and U.S. Mortgage Insurance segments, we introduced technology enabled services to help our customers (lenders and servicers) as well as our consumers (borrowers and homeowners). Technology advancements have allowed us to reduce application approval turn-times, error rates and enhance our customers’ ease of doing business with us. Through our secure internet-enabled information systems and data warehouses, servicers can transact business with us in a timely manner. In the United States, proprietary decision models have helped generate loss mitigation strategies for distressed borrowers. Our models use information from various third-party sources, such as consumer credit agencies, to indicate borrower willingness and capacity to fulfill debt obligations. Identification of specific borrower groups that are likely to work their loans out allows us to create custom outreach strategies to achieve a favorable loss mitigation outcome.
In our International Protection segment, we have existing operations in Europe and Mexico and are establishing new operations in Asia and South America. We have built a scalable operations model with the ability to customize service based on client and end user needs. We are continuously developing new processes and technologies (for example, an online integrated claims management experience) to reduce costs and enhance end user experience by reducing customer effort and cycle time.
Operating centers
We have established scalable, low-cost operating centers in Virginia, North Carolina and Ireland. In addition, through an arrangement with an outsourcing provider, we have a substantial team of professionals in India who provide a variety of services to us, including data entry and transaction processing, and functional support including finance, investment research, actuarial, risk, technology and marketing resources to our insurance operations.
31
Reserves
We calculate and maintain reserves for estimated future payments of claims to our policyholders and contractholders in accordance with U.S. generally accepted accounting principles (“U.S. GAAP”) and industry accounting practices. We build these reserves as the estimated value of those obligations increases, and we release these reserves as the estimated value of those future obligations is extinguished. The reserves we establish reflect estimates and actuarial assumptions with regard to our future experience. These estimates and actuarial assumptions involve the exercise of significant judgment that is subjected to a variety of internal and external independent reviews. Our future financial results depend significantly upon the extent to which our actual future experience is consistent with the assumptions we have used in determining our reserves as well as the assumptions originally used in pricing our products. Many factors, and changes in these factors, can affect future experience including, but not limited to: interest rates; market returns and volatility; economic and social conditions such as inflation, unemployment, home price appreciation or depreciation, and healthcare experience; policyholder persistency; insured life expectancy or longevity; insured morbidity; and doctrines of legal liability and damage awards in litigation. Therefore, we cannot determine with precision the ultimate amounts we will pay for actual claims or the timing of those payments. Moreover, we may not be able to mitigate the impact of unexpected adverse experience by increasing premiums and/or other charges to policyholders.
Reinsurance
We follow the industry practice of reinsuring portions of our insurance risks with reinsurance companies. We use reinsurance both to diversify our risks and to manage loss exposures. Reinsurance is also used to improve capital efficiency of certain products, as well as available capital and surplus at the legal entity or enterprise levels. The use of reinsurance permits us to write policies in amounts larger than the risk we are willing to retain, and also to write a larger volume of new business.
We cede insurance primarily on a treaty basis, under which risks are ceded to a reinsurer on specific blocks of business where the underlying risks meet certain predetermined criteria. To a lesser extent, we cede insurance risks on a facultative basis, under which the reinsurer’s prior approval is required on each risk reinsured. Use of reinsurance does not discharge us, as the insurer, from liability on the insurance ceded. We, as the insurer, are required to pay the full amount of our insurance obligations even in circumstances where we are entitled or able to receive payments from our reinsurer. For additional information related to reinsurance, see note 9 in our consolidated financial statements under “Part II—Item 8—Financial Statements and Supplementary Data.”
The following table sets forth our exposure to our principal reinsurers as of December 31, 2013:
| (Amounts in millions) |
Reinsurance recoverable |
|||
| UFLIC (1) |
$ | 14,622 | ||
| RGA Reinsurance Company |
619 | |||
| Munich American Reassurance Company |
604 | |||
| Riversource Life Insurance Company (2) |
578 | |||
| General Re Life Corporation |
274 | |||
| (1) | We have several significant reinsurance transactions with Union Fidelity Life Insurance Company (“UFLIC”), an affiliate of our former parent, General Electric Company (“GE”), which results in a significant concentration of reinsurance risk. UFLIC’s obligations to us are secured by trust accounts. See note 9 in our consolidated financial statements under “Part II—Item 8—Financial Statements and Supplementary Data.” |
| (2) | Our reinsurance arrangement with Riversource Life Insurance Company covers a runoff block of single premium life insurance policies. |
32
We also participate in reinsurance programs in which we share portions of our U.S. mortgage insurance risk written on loans originated or purchased by lenders with captive reinsurance companies affiliated with these lenders. In return, we cede to the captive reinsurers a predetermined portion of our gross premiums on flow insurance written. New insurance written through the bulk channel generally is not subject to these arrangements. See “—Business—U.S. Mortgage Insurance” for additional information regarding reinsurance captives. As of December 31, 2013, we recorded U.S. mortgage insurance ceded loss reserves within reinsurance recoverable of $44 million where cumulative losses have exceeded the attachment points in several captive reinsurance arrangements.
Financial Strength Ratings
Ratings with respect to financial strength are an important factor in establishing the competitive position of insurance companies. Ratings are important to maintaining public confidence in us and our ability to market our products. Rating organizations review the financial performance and condition of most insurers and provide opinions regarding financial strength, operating performance and ability to meet obligations to policyholders.
As of February 27, 2014, our principal life insurance subsidiaries were rated in terms of financial strength by Standard & Poor’s Financial Services, LLC (“S&P”), Moody’s Investors Services Inc. (“Moody’s) and A.M. Best Company, Inc. (“A.M. Best”) as follows:
| Company |
S&P rating | Moody’s rating | A.M. Best rating | |||
| Genworth Life Insurance Company |
A- (Strong) | A3 (Good) | A (Excellent) | |||
| Genworth Life and Annuity Insurance Company |
A- (Strong) | A3 (Good) | A (Excellent) | |||
| Genworth Life Insurance Company of New York |
A- (Strong) | A3 (Good) | A (Excellent) |
As of February 27, 2014, our principal mortgage insurance subsidiaries were rated in terms of financial strength by S&P, Moody’s and Dominion Bond Rating Service (“DBRS”) as follows:
| Company |
S&P rating | Moody’s rating | DBRS rating | |||
| Genworth Mortgage Insurance Corporation |
BB- (Marginal) | Ba1 (Questionable) | Not rated | |||
| Genworth Residential Mortgage Insurance Corporation of NC |
BB- (Marginal) | Ba1 (Questionable) | Not rated | |||
| Genworth Financial Mortgage Insurance Pty. Limited (Australia) |
AA- (Very Strong) | A3 (Good) | Not rated | |||
| Genworth Financial Mortgage Insurance Limited (Europe) |
BBB- (Good) | Not rated | Not rated | |||
| Genworth Financial Mortgage Insurance Company Canada |
AA- (Very Strong) | Not rated | AA (Superior) | |||
| Genworth Seguros de Credito a la Vivienda S.A. de C.V. (1) |
Not rated | Aa3.mx | Not rated |
| (1) | Also rated “Baa3” by Moody’s on a Global Scale Insurance financial strength basis. |
As of February 27, 2014, our principal lifestyle protection insurance subsidiaries were rated in terms of financial strength by S&P as follows:
| Company |
S&P rating | |||
| Financial Assurance Company Limited |
A- (Strong) | |||
| Financial Insurance Company Limited |
A- (Strong) | |||
The S&P, Moody’s, A.M. Best and DBRS ratings included are not designed to be, and do not serve as, measures of protection or valuation offered to investors. These financial strength ratings should not be relied on
33
with respect to making an investment in our securities. At our request, S&P and Moody’s no longer provide short-term ratings for Genworth Life Insurance Company and Genworth Life and Annuity Insurance Company. In addition, at our request, S&P no longer provides a rating on Genworth Seguros de Credito a la Vivienda S.A. de C.V.
S&P states that insurers rated “AA” (Very Strong), “A” (Strong), “BBB” (Good) or “BB” (Marginal) have very strong, strong, good or marginal financial security characteristics, respectively. The “AA,” “A,” “BBB” and “BB” ranges are the second-, third-, fourth- and fifth-highest of nine financial strength rating ranges assigned by S&P, which range from “AAA” to “R.” A plus (+) or minus (-) shows relative standing within a major rating category. These suffixes are not added to ratings in the “AAA” category or to ratings below the “CCC” category. Accordingly, the “AA-,” “A-,” “BBB-” and “BB-” ratings are the fourth-, seventh-, tenth- and thirteenth-highest of S&P’s 21 ratings categories.
Moody’s states that insurance companies rated “A” (Good) offer good financial security and that insurance companies rated “Ba” (Questionable) offer questionable financial security. The “A” (Good) and “Ba” (Questionable) ranges are the third- and fifth-highest, respectively, of nine financial strength rating ranges assigned by Moody’s, which range from “Aaa” to “C.” Numeric modifiers are used to refer to the ranking within the group, with 1 being the highest and 3 being the lowest. These modifiers are not added to ratings in the “Aaa” category or to ratings below the “Caa” category. Accordingly, the “A3” and “Ba1” ratings are the seventh- and eleventh-highest, respectively, of Moody’s 21 ratings categories. Issuers or issues rated “Aa.mx” demonstrate very strong creditworthiness relative to other issuers in Mexico.
A.M. Best states that the “A” (Excellent) rating is assigned to those companies that have, in its opinion, an excellent ability to meet their ongoing insurance obligations. The “A” (Excellent) rating is the third-highest of 15 ratings assigned by A.M. Best, which range from “A++” to “F.”
DBRS states that long-term obligations rated “AA” are of superior credit quality. The capacity for the payment of financial obligations is considered high and unlikely to be significantly vulnerable to future events. Credit quality differs from “AAA” only to a small degree.
On May 7, 2013, S&P published new financial strength rating criteria for Global Life Insurers and the financial strength ratings of our core U.S. life insurance subsidiaries and holding company ratings were affirmed under this new criteria on June 24, 2013. S&P’s new criteria provides additional transparency in the ratings process by explicitly scoring numerous factors such as insurance industry and country risk, competitive position, capital and earnings, financial flexibility, enterprise risk management, management and governance and liquidity. Following the affirmation of the U.S. life insurance financial strength ratings, Genworth’s other businesses including our Australian, Canadian and European mortgage insurance subsidiaries as well as our lifestyle protection insurance subsidiaries, the ratings of which are based on the core U.S. life insurance subsidiaries’ ratings, were also affirmed.
S&P maintained its negative rating outlook on our Australian mortgage insurance subsidiary as it views the planned partial IPO of Australia as necessary to support its current ratings. S&P anticipates that the partial Australian IPO will be completed by June 2014. If the partial Australian IPO is not successfully executed, S&P indicated that it would review and likely lower the ratings on our Australian mortgage insurance subsidiary by one notch, assuming all other rating factors remain unchanged.
S&P, Moody’s, A.M. Best and DBRS review their ratings periodically and we cannot assure you that we will maintain our current ratings in the future. Other agencies may also rate our company or our insurance subsidiaries on a solicited or an unsolicited basis. We do not provide information to agencies issuing unsolicited ratings and we cannot ensure that any agencies that rate our company or our insurance subsidiaries on an unsolicited basis will continue to do so.
34
Investments
Organization
Our investment department includes asset management, portfolio management, derivatives, risk management, operations, accounting and other functions. Under the direction of the investment committee and our Chief Investment Officer, it is responsible for managing the assets in our various portfolios, including establishing investment and derivatives policies and strategies, reviewing asset-liability management, performing asset allocation for our domestic subsidiaries and coordinating investment activities with our international subsidiaries.
We use both internal and external asset managers to take advantage of expertise in particular asset classes or to leverage country-specific investing capabilities. We internally manage certain asset classes for our domestic insurance operations, including public corporate and municipal securities, structured securities, government securities, commercial mortgage loans, privately placed debt securities and derivatives. We utilize external asset managers primarily for our international portfolios and captive reinsurers, as well as select asset classes. Management of investments for our international operations is overseen by the investment committees reporting to the boards of directors of the applicable non-U.S. legal entities in consultation with our Chief Investment Officer. The majority of the assets in our lifestyle protection insurance business and European, Canadian and Australian mortgage insurance businesses are managed by unaffiliated investment managers located in their respective countries. As of December 31, 2013 and 2012, approximately 20% and 21%, respectively, of our invested assets were held by our international businesses and were invested primarily in non-U.S.-denominated securities.
As of December 31, 2013, we had total cash, cash equivalents and invested assets of $72.8 billion. We manage our assets to meet diversification, credit quality, yield and liquidity requirements of our policy and contract liabilities by investing primarily in fixed maturity securities, including government, municipal and corporate bonds and mortgage-backed and other asset-backed securities. We also hold mortgage loans on commercial real estate and other invested assets, which include derivatives, derivative counterparty collateral, trading securities, limited partnerships and short-term investments. Investments for our particular insurance company subsidiaries are required to comply with our risk management requirements, as well as applicable laws and insurance regulations.
The following table sets forth our cash, cash equivalents and invested assets as of December 31:
| 2013 | 2012 | |||||||||||||||
| (Amounts in millions) |
Carrying value | % of total | Carrying value | % of total | ||||||||||||
| Fixed maturity securities, available-for-sale: |
||||||||||||||||
| Public |
$ | 44,375 | 61 | % | $ | 47,763 | 61 | % | ||||||||
| Private |
14,254 | 20 | 14,398 | 18 | ||||||||||||
| Commercial mortgage loans |
5,899 | 8 | 5,872 | 8 | ||||||||||||
| Other invested assets |
1,686 | 2 | 3,493 | 4 | ||||||||||||
| Policy loans |
1,434 | 2 | 1,601 | 2 | ||||||||||||
| Restricted other invested assets related to securitization entities (1) |
391 | 1 | 393 | 1 | ||||||||||||
| Equity securities, available-for-sale |
341 | — | 518 | 1 | ||||||||||||
| Restricted commercial mortgage loans related to securitization entities (1) |
233 | — | 341 | — | ||||||||||||
| Cash and cash equivalents |
4,214 | 6 | 3,632 | 5 | ||||||||||||
|
|
|
|
|
|
|
|
|
|||||||||
| Total cash, cash equivalents and invested assets |
$ | 72,827 | 100 | % | $ | 78,011 | 100 | % | ||||||||
|
|
|
|
|
|
|
|
|
|||||||||
| (1) | See note 18 to our consolidated financial statements under “Part II—Item 8—Financial Statements and Supplementary Data” for additional information related to consolidated securitization entities. |
35
For a discussion of our investments, see “Part II—Item 7—Management’s Discussion and Analysis of Financial Condition and Results of Operations—Consolidated Balance Sheets.”
Our primary investment objective is to meet our obligations to policyholders and contractholders while increasing value to our stockholders by investing in a diversified, high quality portfolio, comprised of income producing securities and other assets. Our investment strategy focuses on:
| • | managing interest rate risk, as appropriate, through monitoring asset durations relative to policyholder and contractholder obligations; |
| • | selecting assets based on fundamental, research-driven strategies; |
| • | emphasizing fixed-income, low-volatility assets while pursuing active strategies to enhance yield; |
| • | maintaining sufficient liquidity to meet unexpected financial obligations; |
| • | regularly evaluating our asset class mix and pursuing additional investment classes; and |
| • | continuously monitoring asset quality and market conditions that could affect our assets. |
We are exposed to two primary sources of investment risk:
| • | credit risk relating to the uncertainty associated with the continued ability of a given issuer to make timely payments of principal and interest and |
| • | interest rate risk relating to the market price and cash flow variability associated with changes in market interest rates. |
We manage credit risk by analyzing issuers, transaction structures and any associated collateral. We continually evaluate the probability of credit default and estimated loss in the event of such a default, which provides us with early notification of worsening credits. We also manage credit risk through industry and issuer diversification and asset allocation practices. For commercial mortgage loans, we manage credit risk through property type, geographic region and product type diversification and asset allocation.
We manage interest rate risk by monitoring the relationship between the duration of our assets and the duration of our liabilities, seeking to manage interest rate risk in both rising and falling interest rate environments, and by utilizing various derivative strategies. For further information on our management of interest rate risk, see “Part II—Item 7A—Quantitative and Qualitative Disclosures About Market Risk.”
Fixed maturity securities
Fixed maturity securities, which were primarily classified as available-for-sale, including tax-exempt bonds, consisted principally of publicly traded and privately placed debt securities, and represented 81% and 79%, respectively, of total cash, cash equivalents and invested assets as of December 31, 2013 and 2012.
We invest in privately placed fixed maturity securities to increase diversification and obtain higher yields than can ordinarily be obtained with comparable public market securities. Generally, private placements provide us with protective covenants, call protection features and, where applicable, a higher level of collateral. However, our private placements are generally not as freely transferable as public securities because of restrictions imposed by federal and state securities laws, the terms of the securities and the characteristics of the private market.
36
The following table presents our public, private and total fixed maturity securities by the Nationally Recognized Statistical Rating Organizations (“NRSRO”) designations and/or equivalent ratings, as well as the percentage, based upon fair value, that each designation comprises. Certain fixed maturity securities that are not rated by an NRSRO are shown based upon internally prepared credit evaluations.
| December 31, | ||||||||||||||||||||||||
| (Amounts in millions) |
2013 | 2012 | ||||||||||||||||||||||
| NRSRO designation |
Amortized cost |
Fair value |
% of total |
Amortized cost |
Fair value |
% of total |
||||||||||||||||||
| Public fixed maturity securities |
||||||||||||||||||||||||
| AAA |
$ | 14,724 | $ | 15,148 | 34 | % | $ | 15,343 | $ | 17,372 | 36 | % | ||||||||||||
| AA |
4,531 | 4,627 | 11 | 4,335 | 4,746 | 10 | ||||||||||||||||||
| A |
11,621 | 12,488 | 28 | 11,386 | 13,238 | 28 | ||||||||||||||||||
| BBB |
10,164 | 10,720 | 24 | 9,368 | 10,567 | 22 | ||||||||||||||||||
| BB |
1,114 | 1,148 | 3 | 1,205 | 1,296 | 3 | ||||||||||||||||||
| B |
121 | 132 | — | 152 | 147 | — | ||||||||||||||||||
| CCC and lower |
115 | 112 | — | 549 | 397 | 1 | ||||||||||||||||||
|
|
|
|
|
|
|
|
|
|
|
|
|
|||||||||||||
| Total public fixed maturity securities |
$ | 42,390 | $ | 44,375 | 100 | % | $ | 42,338 | $ | 47,763 | 100 | % | ||||||||||||
|
|
|
|
|
|
|
|
|
|
|
|
|
|||||||||||||
| Private fixed maturity securities |
||||||||||||||||||||||||
| AAA |
$ | 1,464 | $ | 1,483 | 11 | % | $ | 1,371 | $ | 1,427 | 10 | % | ||||||||||||
| AA |
1,536 | 1,570 | 11 | 1,421 | 1,521 | 11 | ||||||||||||||||||
| A |
4,217 | 4,331 | 30 | 4,038 | 4,338 | 30 | ||||||||||||||||||
| BBB |
5,832 | 5,984 | 42 | 5,569 | 5,838 | 41 | ||||||||||||||||||
| BB |
711 | 736 | 5 | 920 | 929 | 6 | ||||||||||||||||||
| B |
61 | 56 | — | 217 | 194 | 1 | ||||||||||||||||||
| CCC and lower |
98 | 94 | 1 | 198 | 151 | 1 | ||||||||||||||||||
|
|
|
|
|
|
|
|
|
|
|
|
|
|||||||||||||
| Total private fixed maturity securities |
$ | 13,919 | $ | 14,254 | 100 | % | $ | 13,734 | $ | 14,398 | 100 | % | ||||||||||||
|
|
|
|
|
|
|
|
|
|
|
|
|
|||||||||||||
| Total fixed maturity securities |
||||||||||||||||||||||||
| AAA |
$ | 16,188 | $ | 16,631 | 28 | % | $ | 16,714 | $ | 18,799 | 30 | % | ||||||||||||
| AA |
6,067 | 6,197 | 11 | 5,756 | 6,267 | 10 | ||||||||||||||||||
| A |
15,838 | 16,819 | 29 | 15,424 | 17,576 | 29 | ||||||||||||||||||
| BBB |
15,996 | 16,704 | 29 | 14,937 | 16,405 | 26 | ||||||||||||||||||
| BB |
1,825 | 1,884 | 3 | 2,125 | 2,225 | 4 | ||||||||||||||||||
| B |
182 | 188 | — | 369 | 341 | — | ||||||||||||||||||
| CCC and lower |
213 | 206 | — | 747 | 548 | 1 | ||||||||||||||||||
|
|
|
|
|
|
|
|
|
|
|
|
|
|||||||||||||
| Total fixed maturity securities |
$ | 56,309 | $ | 58,629 | 100 | % | $ | 56,072 | $ | 62,161 | 100 | % | ||||||||||||
|
|
|
|
|
|
|
|
|
|
|
|
|
|||||||||||||
Based upon fair value, public fixed maturity securities represented 76% and 77%, respectively, of total fixed maturity securities as of December 31, 2013 and 2012. Private fixed maturity securities represented 24% and 23%, respectively, of total fixed maturity securities as of December 31, 2013 and 2012.
37
We diversify our fixed maturity securities by security sector. The following table sets forth the fair value of our fixed maturity securities by sector, as well as the percentage of the total fixed maturity securities holdings that each security sector comprised as of December 31:
| 2013 | 2012 | |||||||||||||||
| (Amounts in millions) |
Fair value |
% of total |
Fair value |
% of total |
||||||||||||
| U.S. government, agencies and government-sponsored enterprises |
$ | 4,810 | 8 | % | $ | 5,491 | 9 | % | ||||||||
| Tax-exempt |
295 | — | 294 | 1 | ||||||||||||
| Government—non-U.S. |
2,146 | 4 | 2,422 | 4 | ||||||||||||
| U.S. corporate |
25,035 | 43 | 26,105 | 42 | ||||||||||||
| Corporate—non-U.S. |
15,071 | 26 | 15,792 | 25 | ||||||||||||
| Residential mortgage-backed |
5,225 | 9 | 6,081 | 10 | ||||||||||||
| Commercial mortgage-backed |
2,898 | 5 | 3,333 | 5 | ||||||||||||
| Other asset-backed |
3,149 | 5 | 2,643 | 4 | ||||||||||||
|
|
|
|
|
|
|
|
|
|||||||||
| Total fixed maturity securities |
$ | 58,629 | 100 | % | $ | 62,161 | 100 | % | ||||||||
|
|
|
|
|
|
|
|
|
|||||||||
The following table sets forth the major industry types that comprise our corporate bond holdings, based primarily on industry codes established in the Barclays Capital Aggregate Index, as well as the percentage of the total corporate bond holdings that each industry comprised as of December 31:
| 2013 | 2012 | |||||||||||||||
| (Amounts in millions) |
Fair value |
% of total |
Fair value |
% of total |
||||||||||||
| Utilities and energy |
$ | 9,510 | 24 | % | $ | 9,838 | 23 | % | ||||||||
| Finance and insurance |
7,719 | 19 | 8,274 | 20 | ||||||||||||
| Consumer—non-cyclical |
4,863 | 12 | 5,198 | 12 | ||||||||||||
| Technology and communications |
3,183 | 8 | 3,152 | 7 | ||||||||||||
| Industrial |
2,862 | 7 | 2,829 | 7 | ||||||||||||
| Capital goods |
2,533 | 6 | 2,772 | 7 | ||||||||||||
| Consumer—cyclical |
2,353 | 6 | 2,382 | 6 | ||||||||||||
| Transportation |
1,600 | 4 | 1,643 | 4 | ||||||||||||
| Other |
5,483 | 14 | 5,809 | 14 | ||||||||||||
|
|
|
|
|
|
|
|
|
|||||||||
| Total |
$ | 40,106 | 100 | % | $ | 41,897 | 100 | % | ||||||||
|
|
|
|
|
|
|
|
|
|||||||||
We diversify our corporate bond holdings by industry and issuer. As of December 31, 2013, our combined corporate bond holdings in the 10 issuers to which we had the greatest exposure were $2.1 billion, which was approximately 3% of our total cash, cash equivalents and invested assets. The exposure to the largest single issuer of corporate bonds held as of December 31, 2013 was $238 million, which was less than 1% of our total cash, cash equivalents and invested assets.
We do not have material unhedged exposure to foreign currency risk in our invested assets of our U.S. operations. In our international insurance operations, both our assets and liabilities are generally denominated in local currencies.
Further analysis related to our investments portfolio as of December 31, 2013 and 2012 is included under “Part II—Item 7—Management’s Discussion and Analysis of Financial Condition and Results of Operations—Investment and Derivative Instruments.”
38
Commercial mortgage loans and other invested assets
Our mortgage loans are collateralized by commercial properties, including multi-family residential buildings. Commercial mortgage loans are primarily stated at principal amounts outstanding, net of deferred expenses and allowance for loan loss. We diversify our commercial mortgage loans by both property type and geographic region. See note 4 to our consolidated financial statements under “Part II—Item 8—Financial Statements and Supplementary Data” for additional information on distribution across property type and geographic region for commercial mortgage loans, as well as information on our interest in equity securities and other invested assets.
Selected financial information regarding our other invested assets and derivative instruments as of December 31, 2013 and 2012 is included under “Part II—Item 7—Management’s Discussion and Analysis of Financial Condition and Results of Operations—Investment and Derivative Instruments.”
Regulation
Our businesses are subject to extensive regulation and supervision.
General
Our insurance operations are subject to a wide variety of laws and regulations. State insurance laws and regulations (“Insurance Laws”) regulate most aspects of our U.S. insurance businesses, and our U.S. insurers are regulated by the insurance departments of the states in which they are domiciled and licensed. Our non-U.S. insurance operations are principally regulated by insurance regulatory authorities in the jurisdictions in which they are domiciled. Our insurance products, and thus our businesses, also are affected by U.S. federal, state and local tax laws, and the tax laws of non-U.S. jurisdictions. Our securities operations, including our insurance products that are regulated as securities, such as variable annuities and variable life insurance, also are subject to U.S. federal and state and non-U.S. securities laws and regulations. The U.S. Securities and Exchange Commission (“SEC”), the Financial Industry Regulatory Authority (“FINRA”), state securities authorities and similar non-U.S. authorities regulate and supervise these products.
The primary purpose of the Insurance Laws affecting our insurance and securities businesses and their equivalents in the other countries in which we operate, and the securities laws affecting our variable annuity products, variable life insurance products, registered FABNs and our broker/dealer, is to protect our policyholders, contractholders and clients, not our stockholders. These Insurance Laws are regularly re-examined and any changes to these laws or new laws may be more restrictive or otherwise adversely affect our operations.
In addition, insurance and securities regulatory authorities (including state law enforcement agencies and attorneys general or their non-U.S. equivalents) periodically make inquiries regarding compliance with insurance, securities and other laws and regulations, and we cooperate with such inquiries and take corrective action when warranted.
Our distributors and institutional customers also operate in regulated environments. Changes in the regulations that affect their operations may affect our business relationships with them and their decision to distribute or purchase our subsidiaries’ products.
In addition, the Insurance Laws of our U.S. insurers’ domiciliary jurisdictions and the equivalent laws in the United Kingdom, Australia, Canada and certain other jurisdictions in which we operate require that a person obtain the approval of the applicable insurance regulator prior to acquiring control, and in some cases prior to divesting its control, of an insurer. These laws may discourage potential acquisition proposals and may delay, deter or prevent an investment in or a change of control involving us, or one or more of our regulated subsidiaries, including transactions that our management and some or all of our stockholders might consider desirable.
39
U.S. Insurance Regulation
Our U.S. insurers are licensed and regulated in all jurisdictions in which they conduct insurance business. The extent of this regulation varies, but Insurance Laws generally govern the financial condition of insurers, including standards of solvency, types and concentrations of permissible investments, establishment and maintenance of reserves, credit for reinsurance and requirements of capital adequacy, and the business conduct of insurers, including marketing and sales practices and claims handling. In addition, Insurance Laws usually require the licensing of insurers and agents, and the approval of policy forms, related materials and the rates for certain lines of insurance.
The Insurance Laws applicable to us or our U.S. insurers are described below. Our U.S. mortgage insurers are also subject to additional insurance laws and regulations applicable specifically to mortgage insurers discussed below under “—Mortgage Insurance.”
Insurance holding company regulation
All U.S. jurisdictions in which our U.S. insurers conduct business have enacted legislation requiring each U.S. insurer (except captive insurers) in a holding company system to register with the insurance regulatory authority of its domiciliary jurisdiction and furnish that regulatory authority various information concerning the operations of, and the interrelationships and transactions among, companies within its holding company system that may materially affect the operations, management or financial condition of the insurers within the system. These Insurance Laws regulate transactions between insurers and their affiliates, sometimes mandating prior notice to the regulator and/or regulatory approval. Generally, these Insurance Laws require that all transactions between an insurer and an affiliate be fair and reasonable, and that the insurer’s statutory surplus following such transaction be reasonable in relation to its outstanding liabilities and adequate to its financial needs. As a holding company with no significant business operations of our own, we depend on dividends or other distributions from our subsidiaries as the principal source of cash to meet our obligations, including the payment of operating expenses, amounts we owe to GE under the Tax Matters Agreement and to our subsidiaries for tax sharing agreements and interest on, and repayment of principal of, any debt obligations, among other things. Our U.S. insurers’ payment of dividends or other distributions is regulated by the Insurance Laws of their respective domiciliary states, and insurers may not pay an “extraordinary” dividend or distribution, or pay a dividend except out of earned surplus, without prior regulatory approval. In general, an “extraordinary” dividend or distribution is defined as a dividend or distribution that, together with other dividends and distributions made within the preceding 12 months, exceeds the greater (or, in some jurisdictions, the lesser) of:
| • | 10% of the insurer’s statutory surplus as of the immediately prior year end or |
| • | the statutory net gain from the insurer’s operations (if a life insurer) or the statutory net income (if not a life insurer) during the prior calendar year. |
In addition, insurance regulators may prohibit the payment of ordinary dividends or other payments by our insurers (such as a payment under a tax sharing agreement or for employment or other services) if they determine that such payment could be adverse to our policyholders or contractholders.
The Insurance Laws of our U.S. insurers’ domiciliary jurisdictions require that a person obtain the approval of the insurance commissioner of an insurer’s domiciliary jurisdiction prior to acquiring control of such insurer. Control of an insurer is generally presumed to exist if any person, directly or indirectly, owns, controls, holds with the power to vote, or holds proxies representing, 10% or more of the voting securities of the insurer or its ultimate parent entity. In considering an application to acquire control of an insurer, the insurance commissioner generally considers factors such as the experience, competence and financial strength of the applicant, the integrity of the applicant’s board of directors and executive officers, the acquirer’s plans for the management and operation of the insurer, and any anti-competitive results that may arise from the acquisition. Some states require a person seeking to acquire control of an insurer licensed but not domiciled in that state to make a filing prior to completing an acquisition if the acquirer and its affiliates and the target insurer and its affiliates have specified
40
market shares in the same lines of insurance in that state. These provisions may not require acquisition approval but can lead to imposition of conditions on an acquisition that could delay or prevent its consummation.
In June 2012, the National Association of Insurance Commissioners (the “NAIC”) adopted significant changes to the insurance holding company act and regulations (the “NAIC Amendments”). The NAIC Amendments are designed to respond to perceived gaps in the regulation of insurance holding company systems in the United States. One of the major changes is a requirement that an insurance holding company system’s ultimate controlling person submit annually to its lead state insurance regulator an “enterprise risk report” that identifies activities, circumstances or events involving one or more affiliates of an insurer that, if not remedied properly, are likely to have a material adverse effect upon the financial condition or liquidity of the insurer or its insurance holding company system as a whole. Other changes include requiring a controlling person to submit prior notice to its domiciliary insurance regulator of a divestiture of control, having detailed minimum requirements for cost sharing and management agreements between an insurer and its affiliates and expanding of the agreements between an insurer and its affiliates to be filed with its domiciliary insurance regulator. The NAIC Amendments must be adopted by the individual state legislatures and insurance regulators in order to be effective. We expect most of the states will adopt them in whole or substantial part by January 2016.
Additionally, in 2012, the NAIC adopted the Risk Management and Own Risk and Solvency Assessment Model Act (the “ORSA Model Act”). The ORSA Model Act will require an insurance holding company system’s Chief Risk Officer to submit annually to its lead state insurance regulator an Own Risk and Solvency Assessment Summary Report (“ORSA”). The ORSA is a confidential internal assessment appropriate to the nature, scale and complexity of an insurer, conducted by that insurer of the material and relevant risks identified by the insurer associated with an insurer’s current business plan and the sufficiency of capital resources to support those risks. An insurer that is subject to the ORSA requirements will be expected to:
| • | regularly, no less than annually, conduct an ORSA to assess the adequacy of its risk management framework, and current and estimated projected future solvency position; |
| • | internally document the process and results of the assessment; and |
| • | provide a confidential high-level ORSA Summary Report annually to the lead state commissioner if the insurer is a member of an insurance group and, upon request, by the domiciliary state regulator. |
The ORSA Model Act must be adopted by the individual state legislature and insurance regulators in order to be effective. In the states where the ORSA Model Act has been or will be adopted, the ORSA Model Act’s requirements generally become effective on January 1, 2015.
We cannot predict the impact, if any, that the NAIC Amendments and compliance with the ORSA Model Act will have on our business, financial condition or results of operations.
Periodic reporting
Our U.S. insurers must file reports, including detailed annual financial statements, with insurance regulatory authorities in each jurisdiction in which they do business, and their operations and accounts are subject to periodic examination by such authorities.
Policy forms
Our U.S. insurers’ policy forms are subject to regulation in every U.S. jurisdiction in which they transact insurance business. In most U.S. jurisdictions, policy forms must be filed prior to their use, and in some U.S. jurisdictions, forms must be approved by insurance regulatory authorities prior to use.
41
In our U.S. mortgage insurance business, partly in response to mandatory master policy changes issued by the GSEs, with the oversight of the Federal Housing Finance Agency (the “FHFA”), we have revised our master policy and related endorsements and they have been approved by the GSEs and filed as necessary in jurisdictions where we do business. Based on statements by the GSEs, we expect the revised master policy will become effective no earlier than July 1, 2014, subject to the review and approval of insurance regulatory authorities as and to the extent required. We do not expect the final terms and conditions of the revised master policy will have a material impact on the financial condition or results of operations of our U.S. mortgage insurance business.
Market conduct regulation
The Insurance Laws of U.S. jurisdictions govern the marketplace activities of insurers, affecting the form and content of disclosure to consumers, product illustrations, advertising, product replacement, sales and underwriting practices, and complaint and claims handling, and these provisions are generally enforced through periodic market conduct examinations.
Statutory examinations
Insurance departments in U.S. jurisdictions conduct periodic detailed examinations of the books, records, accounts and business practices of domestic insurers. These examinations generally are conducted in cooperation with insurance departments of two or three other states or jurisdictions representing each of the NAIC zones, under guidelines promulgated by the NAIC.
Guaranty associations and similar arrangements
Most jurisdictions in which our U.S. insurers are licensed require those insurers to participate in guaranty associations which pay contractual benefits owed under the policies of impaired or insolvent insurers. These associations levy assessments, up to prescribed limits, on each member insurer in a jurisdiction on the basis of the proportionate share of the premiums written by such insurer in the lines of business in which the impaired, insolvent or failed insurer is engaged. Some jurisdictions permit member insurers to recover assessments paid through full or partial premium tax offsets. Aggregate assessments levied against our U.S. insurers were not material to our consolidated financial statements.
Policy and contract reserve sufficiency analysis
The Insurance Laws of their domiciliary jurisdictions require our U.S. life insurers to conduct annual analyses of the sufficiency of their life and health insurance and annuity reserves. Other jurisdictions where insurers are licensed may have certain reserve requirements that differ from those of their domiciliary jurisdictions. In each case, a qualified actuary must submit an opinion stating that the aggregate statutory reserves, when considered in light of the assets held with respect to such reserves, make good and sufficient provision for the insurer’s associated contractual obligations and related expenses. If such an opinion cannot be provided, the insurer must establish additional reserves by transferring funds from surplus. Our U.S. life insurers submit these opinions annually to their insurance regulatory authorities. Different reserve requirements exist for our U.S. mortgage insurance subsidiaries. See “—Reserves—Mortgage Insurance.”
Surplus and capital requirements
Insurance regulators have the discretionary authority, in connection with maintaining the licensing of our U.S. insurers, to limit or restrict insurers from issuing new policies, or policies having a dollar value over certain thresholds, if, in the regulators’ judgment, the insurer is not maintaining a sufficient amount of surplus or is in a hazardous financial condition. We seek to maintain new business and capital management strategies to support meeting related regulatory requirements.
42
Risk-based capital
The NAIC has established risk-based capital (“RBC”) standards for U.S. life insurers, as well as a risk-based capital model act (“RBC Model Act”). All 50 states and the District of Columbia have adopted the RBC Model Act or a substantially similar law or regulation. The RBC Model Act requires that life insurers annually submit a report to state regulators regarding their RBC based upon four categories of risk: asset risk, insurance risk, interest rate and market risk, and business risk. The capital requirement for each is generally determined by applying factors which vary based upon the degree of risk to various asset, premium and reserve items. The formula is an early warning tool to identify possible weakly capitalized companies for purposes of initiating further regulatory action.
If an insurer’s RBC fell below specified levels, it would be subject to different degrees of regulatory action depending upon the level, ranging from requiring the insurer to propose actions to correct the capital deficiency to placing the insurer under regulatory control. As of December 31, 2013, the RBC of each of our U.S. life insurance subsidiaries exceeded the level of RBC that would require any of them to take or become subject to any corrective action. The consolidated RBC ratio of our U.S. domiciled life insurance subsidiaries was approximately 485% and 430% of the company action level as of December 31, 2013 and 2012, respectively.
Statutory accounting principles
U.S. insurance regulators developed statutory accounting principles (“SAP”) as a basis of accounting used to monitor and regulate the solvency of insurers. Since insurance regulators are primarily concerned with ensuring an insurer’s ability to pay its current and future obligations to policyholders, statutory accounting conservatively values the assets and liabilities of insurers, generally in accordance with standards specified by the insurer’s domiciliary jurisdiction. Uniform statutory accounting practices are established by the NAIC and are generally adopted by regulators in the various U.S. jurisdictions.
Due to differences in methodology between SAP and U.S. GAAP, the values for assets, liabilities and equity reflected in financial statements prepared in accordance with U.S. GAAP are materially different from those reflected in financial statements prepared under SAP.
Regulation of investments
Each of our U.S. insurers is subject to Insurance Laws that require diversification of its investment portfolio and which limit the proportion of investments in different asset categories. Assets invested contrary to such regulatory limitations must be treated as non-admitted assets for purposes of measuring surplus, and, in some instances, regulations require divestiture of such non-complying investments. We believe the investments made by our U.S. insurers comply with these Insurance Laws.
Federal regulation of insurance products
Most of our variable annuity products, some of our fixed guaranteed products, and all of our variable life insurance products, as well as our FABNs issued as part of our registered notes program are “securities” within the meaning of federal and state securities laws, are registered under the Securities Act of 1933 and are subject to regulation by the SEC. See “—Other Laws and Regulations—Securities regulation.” These products may also be indirectly regulated by FINRA as a result of FINRA’s regulation of broker/dealers and may be regulated by state securities authorities. Federal and state securities regulation similar to that discussed below under “—Other Laws and Regulations—Securities regulation” affects investment advice and sales and related activities with respect to these products. U.S. mortgage products and insurers are also subject to federal regulation discussed below under “—Mortgage Insurance.” In addition, although the federal government does not comprehensively regulate the business of insurance, federal legislation and administrative policies in several areas, including taxation, financial services regulation, and pension and welfare benefits regulation, can also significantly affect the insurance industry.
43
Dodd-Frank Act and other federal initiatives
Although the federal government generally does not directly regulate the insurance business, federal initiatives often, and increasingly, have an impact on the business in a variety of ways, including limitations on antitrust immunity, tax incentives for lifetime annuity payouts, simplification bills affecting tax-advantaged or tax-exempt savings and retirement vehicles, and proposals to modify the estate tax. In addition, various forms of direct federal regulation of insurance have been proposed in recent years.
In July 2010, the Dodd-Frank Wall Street Reform and Consumer Protection Act (the “Dodd-Frank Act”) was enacted and signed into law. The Dodd-Frank Act made extensive changes to the laws regulating financial services firms and requires various federal agencies to adopt a broad range of new implementing rules and regulations, many of which have begun to take effect. Federal agencies have been given significant discretion in drafting the rules and regulations that will implement the Dodd-Frank Act. In addition, this legislation mandated multiple studies and reports for Congress, which could in some cases result in additional legislative or regulatory action.
Among other provisions, the Dodd-Frank Act provides for a new framework of regulation of over-the-counter (“OTC”) derivatives markets which requires us to clear certain types of derivative transactions through clearing organizations. In mid-2013, we became subject to the clearing requirement which requires us to post highly liquid securities as initial margin and have cash available to meet daily variation margin demands for most of our new interest rate derivative transactions. The need for initial and variation margin requires us to hold additional liquid, lower-yielding securities as well as cash in our investment portfolio. In addition, over time, we will experience additional collateral requirements for derivative transactions that are not required to be cleared. Beginning in mid-February 2014, certain derivative transactions are required to be traded on swap execution facilities, regulated platforms for swap trading. Our derivatives activity is subject to greater transparency due to heightened reporting requirements. As a result of all of these changes, we may have to alter the way we use derivatives in the future. The Dodd-Frank Act also authorizes the SEC to adopt regulations that could impose heightened standards of care on sellers of variable or other registered products, which could adversely affect sales of and reduce margins on these products.
In the case of our U.S. mortgage insurance business, the Dodd-Frank Act requires lenders to retain some of the risk associated with mortgage loans that they sell or securitize, unless the mortgage loans are “qualified residential mortgages” or unless the securitization or security is partially or fully exempted by regulations to be promulgated. The Dodd-Frank Act provides that the definition of “qualified residential mortgages” will be determined by regulators, with consideration to be given, among other things, to the presence of mortgage insurance. The legislation also prohibits a creditor from making a residential mortgage loan unless the creditor makes a reasonable and good faith determination that, at the time the loan is consummated, the consumer has a reasonable ability to repay the loan. In addition, the Dodd-Frank Act created the CFPB, which regulates certain aspects of the offering and provision of consumer financial products or services but not the business of insurance. In January 2014, CFPB rules implementing the ability-to-repay and qualified mortgage standards contained in the Dodd-Frank Act went into effect. The rules set requirements for how mortgage lenders can demonstrate that they have effectively considered the consumer’s ability to repay a mortgage loan. In addition, the rules clarify when a mortgage may be classified as a “qualified mortgage” and when a lender is eligible for a safe harbor as a presumption that the lender has complied with the ability-to-repay requirements. We expect the rules to have a positive impact on the credit quality of mortgage loans which may benefit our delinquency rates but the rule may have the negative impact of reducing the number of loans originated and therefore available for the mortgage insurance market. The CFPB may issue additional rules or regulations that affect our U.S. mortgage insurance business and may assert jurisdiction over regulatory or enforcement matters in lieu of or in addition to the existing jurisdiction of other federal or state agencies.
The Dodd-Frank Act also establishes a Financial Stability Oversight Council (“FSOC”), which is authorized to subject non-bank financial companies, which may include insurance companies, deemed systemically significant to stricter prudential standards and other requirements and to subject such companies to a special orderly liquidation process outside the federal Bankruptcy Code, administered by the Federal Deposit Insurance
44
Corporation. In April 2012, FSOC adopted final rules for evaluating whether a non-bank financial company should be designated as systemically significant. We have not currently been designated as systemically significant by FSOC but this determination could change in the future. Insurance company subsidiaries of systemically significant companies would remain subject to liquidation and rehabilitation proceedings under state law, although the FSOC is authorized to direct that such a proceeding be commenced against the insurer under state law. Systemically significant companies are also required to prepare resolution plans, so-called “living wills,” that set out how they could most efficiently be liquidated if they endangered the U.S. financial system or the broader economy. Insurance companies that are found to be systemically significant are permitted, in some circumstances, to submit abbreviated versions of such plans. Existing and proposed rules regarding heightened prudential standards for systemically significant companies would impose new capital, liquidity, counterparty credit exposure and governance standards, and they would also subject such companies to restrictions on their activities and management if they appear to be at risk of liquidation. There are no exceptions for insurance companies in these regulations. FSOC’s potential recommendation of measures to address systemic financial risk could affect our insurance operations as could a future determination that we or our counterparties are systemically significant.
The Dodd-Frank Act establishes a Federal Insurance Office (“FIO”) within the Department of the Treasury. While not having a general supervisory or regulatory authority over the business of insurance, the director of this office will perform various functions with respect to insurance, including serving as a non-voting member of the FSOC and making recommendations to the FSOC regarding insurers to be designated for more stringent regulation. In December 2013, FIO issued a report on alternatives to modernize and improve the system of insurance regulation in the United States, including by increasing national uniformity through either a federal charter or effective action by the states, in particular recommending federal standards and oversight regulations for mortgage insurers. If adopted, we cannot predict what effect, if any, such standards and regulations may have on our U.S. mortgage insurance business.
The Dodd-Frank Act imposes new restrictions on the sponsorship of and investment in private equity funds and hedge funds by companies that are affiliated with an insured depository institution. While we are not affiliated with such an institution or with anyone who is, these restrictions may affect the value and salability of any interest we may have in such funds.
A Residential Mortgage-Backed Securities Working Group was formed in 2012 under President Obama’s Financial Fraud Enforcement Task Force to investigate misconduct contributing to the financial crisis through the pooling and sale of residential mortgage-backed securities. The principal focus of this Working Group has been directed at enforcement actions against issuers and servicers of mortgage-backed securities. As the activities of this Working Group are ongoing, we cannot predict what impact, if any, this Working Group may have on the mortgage insurance industry in general and our business in particular.
We cannot predict the requirements of all of the regulations adopted under the Dodd-Frank Act, the effect such legislation or regulations will have on financial markets generally, or on our businesses specifically, the additional costs associated with compliance with such regulations or legislation, or any changes to our operations that may be necessary to comply with the Dodd-Frank Act and the regulations thereunder, any of which could have a material adverse effect on our business, results of operations, cash flows or financial condition. We also cannot predict whether other federal initiatives will be adopted or what impact, if any, such initiatives, if adopted as laws, may have on our business, financial condition or results of operations.
Changes in tax laws
Changes in tax laws that took effect in 2013 could make some of our products more or less attractive to consumers. For example, the American Taxpayer Relief Act of 2012 made permanent the federal estate tax exclusion amount of $5 million, as adjusted for inflation, but increased the maximum tax rate to 40% from 35%. The legislation also made permanent the prior law provision which permits a surviving spouse to succeed to any
45
unused federal estate tax exclusion amount of the deceased spouse. This permits the beneficiary of a survivorship life policy to receive a larger death benefit free of estate tax on the second spouse’s death than would have been allowed under prior law, potentially making such policies more attractive to affluent customers. However, since our policyholders are generally not high net worth individuals who would be subject to the estate tax, we believe that these developments will have little effect on current sales of our life insurance products. The legislation also increases the maximum tax rate on ordinary income, capital gains and dividends for unmarried individuals (other than heads of households and surviving spouses) with taxable income over $400,000 and married joint filers and surviving spouses with taxable income over $450,000 (also indexed for inflation), which provides incentive for affected investors to buy our fixed deferred annuity products. The tax provision allowing a limited itemized deduction for qualified mortgage insurance expired on December 31, 2013. We do not expect that the expiration of this provision will have a material impact on our U.S. mortgage insurance business.
U.K. Insurance Regulation
General
Insurance and reinsurance businesses in the United Kingdom are authorized by the Prudential Regulatory Authority (“PRA”), and regulated by the PRA and the Financial Conduct Authority (“FCA”). The PRA is responsible for prudential regulation of banks and insurers, building societies, credit unions and major investment firms, while the FCA is responsible for the conduct of business regulation and the wholesale and retail markets and the authorization of other financial services businesses. The PRA has authorized certain of our U.K. subsidiaries to effect and carry out contracts of insurance in the United Kingdom. Insurers authorized by the PRA in the United Kingdom are generally able to operate throughout the European Union, subject to satisfying certain PRA and FCA requirements and, in some cases, additional local regulatory provisions. Certain of our U.K. subsidiaries operate in other European Union member states through establishment of branch offices.
Supervision
The PRA has adopted a risk-based approach to the supervision of insurers whereby it periodically performs a formal risk assessment of insurance companies or groups conducting business in the United Kingdom. After each risk assessment, the PRA will inform the insurer of its views on the insurer’s risk profile, including details of remedial action the PRA requires and the likely consequences of not taking such actions. The FCA also supervises the management of insurance companies through the “approved persons” regime, which requires insurance companies to obtain FCA approval for any person who performs certain specified “controlled functions” for or in relation to a regulated entity.
In addition, the FCA supervises the sale of general insurance, including certain lifestyle protection and mortgage insurance products. Under FCA rules, persons involved in the sale of general insurance (including insurers and distributors) are prohibited from offering or accepting any inducement in connection with the sale of general insurance that is likely to conflict materially with their duties to insureds. Although the rules do not generally require disclosure of broker compensation, the insurer or distributor must disclose broker compensation at the insured’s request.
The PRA and FCA were created in April 2013, replacing the Financial Services Authority which previously regulated both prudential and conduct matters.
Solvency requirements
Under PRA rules, insurers must maintain a minimum amount of capital resources for solvency purposes at all times, the calculation of which depends on the type of risk insured, amount of premiums received, and the type, amount and claims history of the insurer. Failure to maintain the required minimum amount of capital
46
resources is one of the grounds on which the PRA may exercise its wide powers of intervention. In addition, an insurer that is part of a group is required to perform and submit to the PRA a capital resources calculation return in respect of the following:
| • | The solvency capital resources available to the U.K. insurer’s European group defined by reference to the U.K. insurer’s ultimate parent company domiciled in the European Economic Area. |
| • | The solvency capital resources available to the U.K. insurer’s worldwide group defined by reference to the U.K. insurer’s ultimate parent company domiciled outside the European Economic Area. This requirement is only a reporting requirement. |
There will be fundamental changes to the existing solvency capital regime for all insurers and reinsurers operating in Europe as a result of the introduction of the Solvency II directive. Currently, it is expected to become effective on January 1, 2016. At this stage, it is not possible to predict the impact these changes will have on our operations.
Restrictions on dividend payments
The U.K. Companies Act 2006 prohibits U.K. companies from making a distribution such as a dividend to their stockholders unless they have “profits available for distribution,” the determination of which is based on the company’s audited accumulated realized profits (so far as not previously utilized by distribution) less its accumulated realized losses (so far as not previously written off).
Intervention and enforcement
The PRA and FCA have extensive powers to intervene in the affairs of an insurer or authorized person and has the power, among other things, to enforce and take disciplinary measures in respect of breaches of its rules. Such powers include the power to vary or withdraw any authorizations.
Bermuda Insurance Regulation
The Bermuda Monetary Authority (the “BMA”) regulates all financial institutions operating in or from Bermuda, including our Bermudian captive insurance companies. Specific regulation varies in Bermuda depending on whether the insurance company has been granted a long-term business license or a general business license and by the class under which each company falls within such licenses. Regardless of license or class, all companies are required to maintain minimum capital and surplus levels and minimum solvency standards and are subject to auditing and reporting requirements.
Under Bermuda’s Insurance Act 1978, in addition to the ability to pay dividends from retained earnings subject to certain procedures and compliance with applicable financial margins, Bermuda insurance companies may distribute up to 15% of their total paid-in or contributed capital without the prior approval of the BMA. Insurance companies may apply to the BMA to make distributions in excess of such level.
In recent years, the BMA has adopted new solvency regulations and certain other regulations to enhance its governance and disclosure requirements for insurance companies. The BMA has indicated that such requirements have been proposed in order for Bermuda to achieve consistency with changes being developed by other leading insurance regulators worldwide, and in so doing achieve equivalence with the Solvency II directive. Each of our Bermudian captive insurance companies meet or exceed the new minimum solvency requirements that have been adopted in Bermuda. During 2013, the BMA finalized and adopted various regulations enhancing its governance and disclosure requirements, which requirements did not have a material effect on our Bermudian captive insurance companies’ business, financial condition or results of operations. However, the BMA continues to propose revisions to its solvency, governance and reporting regulations and we cannot be certain of the impact these revisions may have on our Bermudian captive insurance companies or the impact, if any, on our business, financial condition or results of operations. The BMA’s efforts to adopt these revisions are generally proceeding independently of the implementation timeline of the Solvency II directive in Europe.
47
Mortgage Insurance Regulation
State regulation
General
Mortgage insurers generally are limited by Insurance Laws to directly writing only mortgage insurance business to the exclusion of other types of insurance. Mortgage insurers are not subject to the NAIC’s RBC requirements but certain states and other regulators impose another form of capital requirement on mortgage insurers requiring maintenance of a risk-to-capital ratio not to exceed 25:1. GEMICO, our primary U.S. mortgage insurance subsidiary, had a risk-to-capital ratio of 19.3:1 as of December 31, 2013, compared with a risk-to-capital ratio of 36.9:1 as of December 31, 2012. If one of our U.S. mortgage insurance subsidiaries that may be writing business in a particular state fails to maintain that state’s required minimum capital level, we would generally be required to stop writing new business immediately in the state until the insurer re-establishes the required regulatory level of capital or receives a waiver of such requirement from the state’s insurance regulator or, alternatively, until we establish an alternative source of underwriting capacity such as an affiliated insurer which meets state regulatory capital-related requirements and has been approved as an eligible mortgage guaranty insurer by the GSEs.
Beginning in 2010 through April 2013, GEMICO exceeded regulatory risk-to-capital levels and operated pursuant to regulatory forbearance (typically in the form of a waiver or the regulatory equivalent thereof) or we instead operated through affiliated insurers that met applicable state regulatory requirements and where we had obtained GSE approval of the affiliates as eligible insurers (subject to specified conditions). As of April 30, 2013, GEMICO returned to compliance with the maximum state regulatory risk-to-capital ratio of 25:1, and accordingly, does not currently face the associated limitations on its ability to write new business. As of December 31, 2013, GEMICO remains in compliance with applicable state regulatory capital-related requirements, and as of January 20, 2014, all new business is being written out of GEMICO. Of those waivers and approvals previously relied upon by GEMICO, four state waivers do not expire until July 31, 2014; however, two state waivers expired by their terms on December 31, 2013, and each GSE’s approval in connection with the use of an alternative affiliated insurer (and the limitations imposed on the business contained therein) also expired by their respective terms on December 31, 2013. While it is our expectation that our U.S. mortgage insurance subsidiaries will continue to meet their regulatory capital requirements, should GEMICO in the future exceed required risk-to-capital levels, we would pursue required regulatory and GSE forbearance and approvals or pursue approval for the utilization of alternative insurance vehicles. However, there can be no assurance if, and on what terms, such forbearance and approvals may be obtained.
During 2012, the NAIC established a Mortgage Guaranty Insurance Working Group (the “MGIWG”) to determine and make recommendations to the NAIC’s Financial Condition Committee as to what, if any, changes to make to the solvency and other regulations relating to mortgage guaranty insurers. In December 2013, the MGIWG published a draft of proposed amendments of the NAIC’s Mortgage Guaranty Insurers Model Act (the “MGI Model”) and solicited comments on the proposed amendments. The proposed amendments of the MGI Model relate to, among other things: (i) capital and reserve standards, including increased minimum capital and surplus requirements, mortgage guaranty-specific risk-based capital standards, dividend restrictions and contingency and premium deficiency reserves; (ii) limitations on the geographic concentration of mortgage guaranty risk, including state-based limitations; (iii) restrictions on mortgage insurers’ investments in notes secured by mortgages; (iv) prudent underwriting standards and formal underwriting guidelines to be approved by the insurer’s board; (v) the establishment of formal, internal “Mortgage Guaranty Quality Control Programs” with respect to in-force business; (vi) prohibitions on reinsurance with bank captive reinsurers; and (vii) incorporation of an NAIC “Mortgage Guaranty Insurance Standards Manual.” At this time we cannot predict the outcome of this process, the effect changes, if any, will have on the mortgage guaranty insurance market generally, or on our businesses specifically, the additional costs associated with compliance with any such changes, or any changes to our operations that may be necessary to comply, any of which could have a material adverse effect on our business, results of operations, cash flows or financial condition. We also
48
cannot predict whether other regulatory initiatives will be adopted or what impact, if any, such initiatives, if adopted as laws, may have on our business, financial condition or results of operations.
Reserves
Insurance Laws require our U.S. mortgage insurers to establish a special statutory contingency reserve in their statutory financial statements to provide for losses in the event of significant economic declines. Annual additions to the statutory contingency reserve must equal 50% of net earned premiums as defined by Insurance Laws. These contingency reserves generally are held until the earlier of (i) the time that loss ratios exceed 35% or (ii) 10 years, although regulators have granted discretionary releases from time to time. This reserve reduces the policyholder surplus of our U.S. mortgage insurers, and therefore, their ability to pay dividends to us. Since the loss ratio of our U.S. mortgage insurers exceeded 35% in 2013, the regulator granted us approval to release a portion of the statutory contingency reserve in accordance with prescribed Insurance Laws. As a result, the statutory contingency reserve for our U.S. mortgage insurers was approximately $59 million as of December 31, 2013.
Federal regulation
In addition to federal laws directly applicable to mortgage insurers, the laws and regulations applicable to mortgage originators and lenders, purchasers of mortgage loans such as Freddie Mac and Fannie Mae, and governmental insurers such as the FHA and VA indirectly affect mortgage insurers. For example, changes in federal housing legislation and other laws and regulations that affect the demand for private mortgage insurance may have a material effect on private mortgage insurers. Legislation or regulation that increases the number of people eligible for FHA or VA mortgages could have a materially adverse effect on our ability to compete with the FHA or VA.
The Homeowners Protection Act provides for the automatic termination, or cancellation upon a borrower’s request, of private mortgage insurance upon satisfaction of certain conditions. The Homeowners Protection Act applies to owner-occupied residential mortgage loans regardless of lien priority and to borrower-paid mortgage insurance closed after July 29, 1999. FHA loans are not covered by the Homeowners Protection Act. Under the Homeowners Protection Act, automatic termination of mortgage insurance would generally occur once the loan-to-value ratio reaches 78%. A borrower generally may request cancellation of mortgage insurance once the actual payments reduce the loan balance to 80% of the home’s original value. For borrower-initiated cancellation of mortgage insurance, the borrower must have a “good payment history” as defined by the Homeowners Protection Act.
The Real Estate Settlement and Procedures Act of 1974 (“RESPA”) applies to most residential mortgages insured by private mortgage insurers. Mortgage insurance has been considered in some cases to be a “settlement service” for purposes of loans subject to RESPA. Subject to limited exceptions, RESPA precludes us from providing services to mortgage lenders free of charge, charging fees for services that are lower than their reasonable or fair market value, and paying fees for services that others provide that are higher than their reasonable or fair market value. In addition, RESPA prohibits persons from giving or accepting any portion or percentage of a charge for a real estate settlement service, other than for services actually performed. Although many states prohibit mortgage insurers from giving rebates, RESPA has been interpreted to cover many non-fee services as well. Mortgage insurers and their customers are subject to the possible sanctions of this law, which may be enforced by the CFPB, state insurance departments, state attorneys general and other enforcement authorities.
The Equal Credit Opportunity Act (“ECOA”) and the Fair Credit Reporting Act (“FCRA”) also affect the business of mortgage insurance in various ways. ECOA, for example, prohibits discrimination against certain protected classes in credit transactions. FCRA governs the access and use of consumer credit information in credit transactions and requires notices to consumers in certain circumstances.
49
Most originators of mortgage loans are required to collect and report data relating to a mortgage loan applicant’s race, nationality, gender, marital status and census tract to the U.S. Department of Housing and Urban Development Administration (“HUD”) or the Federal Reserve under the Home Mortgage Disclosure Act of 1975 (“HMDA”). The purpose of HMDA is to detect possible impermissible discrimination in home lending and, through disclosure, to discourage such discrimination. Mortgage insurers are not required to report HMDA data although, under the laws of several states, mortgage insurers currently are prohibited from discriminating on the basis of certain classifications. Mortgage insurers, through Mortgage Insurance Companies of America, voluntarily submit to the Federal Financial Institutions Examinations Council data on loans submitted for insurance like that required for most mortgage lenders under HMDA.
International regulation
Canada
The Office of the Superintendent of Financial Institutions (“OSFI”) provides oversight to all federally incorporated financial institutions, including our Canadian mortgage insurance companies, which are indirect wholly-owned subsidiaries of Genworth Canada. In June 2012, OSFI was given oversight responsibility for CMHC, our main competitor. OSFI does not have enforcement powers over market conduct issues in the insurance industry, which are a provincial responsibility. The Bank Act, Insurance Companies Act and Trust and Loan Companies Act prohibit Canadian banks, trust companies and insurers from extending mortgage loans where the loan value exceeds 80% of the property’s value, unless mortgage insurance is obtained in connection with the loan. As a result, all mortgages issued by these financial institutions with a loan-to-value ratio exceeding 80% must be insured by a qualified insurer or CMHC. Legislation became effective in Canada in 2010 that, among other things, amended these statutes to prohibit such financial institutions from charging borrowers amounts for mortgage insurance that exceed the lender’s actual costs and impose disclosure obligations in respect of mortgage insurance.
PRMHIA came into force on January 1, 2013 and terminates our pre-existing guarantee agreement with the government. Under PRMHIA, the Canadian government guarantees the benefits payable under mortgage insurance policies, less 10% of the original principal amount of an insured loan, in the event that we fail to make claim payments with respect to that loan because of insolvency. We pay the Canadian government a risk fee for this guarantee. Because banks are not required to maintain regulatory capital on an asset backed by a sovereign guarantee, our 90% sovereign guarantee permits lenders purchasing our mortgage insurance to reduce their regulatory capital charges for credit risks on mortgages by 90%. As a result of the elimination of the guarantee fund, we are required to hold higher regulatory capital under PRMHIA and the Insurance Companies Act of Canada. However, the increase in required capital was predominantly offset by the increase in available capital that results from the guarantee fund assets reverting back to us.
The Insurance Companies Act of Canada provides that dividends may only be declared by the board of directors of the Canadian insurer and paid if there are reasonable grounds to believe that the payment of the dividend would not cause the insurer to be in violation of its minimum capital and liquidity requirements. Also, we are required to notify OSFI at least 15 days prior to the dividend payment date.
As a public company that is traded on the Toronto Stock Exchange (the “TSX”), Genworth Canada is subject to securities laws and regulation in each province in Canada, as well as the reporting requirements of the TSX.
Australia
APRA regulates all ADIs in Australia and life, general and mortgage insurance companies. APRA’s license conditions require Australian mortgage insurers to be monoline insurers, which are insurers offering just one type of insurance product. APRA’s regulations apply to individual licensed insurers and to the relevant Australian-based holding company and group.
50
APRA also sets minimum capital levels and monitors corporate governance requirements, including our risk management strategy. In this regard, APRA reviews our management, controls, processes, reporting and methods by which all risks are managed, including an annual financial condition report and an annual report on insurance liabilities by an appointed actuary. APRA also requires us to submit our risk management strategy and reinsurance management strategy, which outlines our use of reinsurance in Australia, annually and more frequently if there are material changes.
In setting minimum capital levels for mortgage insurers, APRA requires them to ensure they have sufficient capital to withstand a hypothetical three-year stress loss scenario defined by APRA. These regulations include increased mortgage insurers’ capital requirements for insured loans that are considered to be non-standard. APRA also imposes quarterly reporting obligations on mortgage insurers with respect to risk profiles, reinsurance arrangements and financial position.
During 2010, APRA issued detailed proposals to revise the capital requirements for all insurers it regulates. Following receipt of feedback from the industry, including quantitative analyses from market participants, APRA published updated proposals in March and December 2011. In October 2012, APRA issued revised prudential and reporting standards which became effective on January 1, 2013. The new standards have not led to a material change in the minimum regulatory capital requirements for our business.
In addition, APRA determines the capital requirements for ADIs and has reduced capital requirements for certain ADIs that insure residential mortgages with an “acceptable” mortgage insurer for all non-standard mortgages and for standard mortgages with loan-to-value ratios above 80%. APRA’s regulations currently set out a number of circumstances in which a loan may be considered to be non-standard from an ADI’s perspective. The capital levels for Australian internal ratings-based ADIs are determined by their APRA-approved internal ratings-based models, which may or may not allocate capital credit for LMI. We believe that APRA and the internal ratings-based ADIs have not yet finalized internal models for residential mortgage risk, so we do not believe that the internal ratings-based ADIs currently benefit from a reduction in their capital requirements for mortgages covered by mortgage insurance. APRA rules also provide that LMI on a non-performing loan (90 days plus arrears) protects most ADIs from having to increase the regulatory capital on the loan to a risk-weighting of 100%. These regulations include a definition of an “acceptable” mortgage insurer and eliminate the reduced capital requirements for ADIs in the event that the mortgage insurer has contractual recourse to the ADI or a member of the ADI’s consolidated group.
In December 2010, the Australian government announced a series of banking reforms designed to promote greater competition in the Australian banking industry. One key aspect of the proposals involved boosting consumer flexibility to transfer deposits and mortgages. In particular, the Australian government announced that it would consider instructing the Australian treasury department to accelerate the development of potential frameworks to transfer LMI policies between lenders and introduce a central registry for mortgages. Currently, LMI policies are not transportable between lenders and are issued to a particular lender in respect of a particular loan. The Australian government announced on August 21, 2011 that it did not intend to make LMI portable but rather to seek the introduction of a LMI Key Fact Sheet which lenders will be required to give to borrowers. The LMI Key Fact sheet will be designed to help home buyers understand the costs and benefits of mortgage insurance when taking out a home loan. The final LMI Key Fact Sheet implementing regulations have not been promulgated by the government. We are unaware of when, or if, the final regulations will be promulgated. In our Australian mortgage insurance business, we offer rebate options to lenders whereby up to 40% of the premium is refunded if the loan is discharged in the first year, decreasing to 20% in the second year of the mortgage, although many lenders elect to take a non-refundable option in order to receive a lower overall premium structure.
APRA has the power to impose restrictions on our ability to declare and pay dividends based on a number of factors, including the impact on our minimum regulatory capital ratio.
51
United Kingdom and Europe
The United Kingdom is a member of the European Union and applies the harmonized system of regulation set out in the European Union regulations and directives. Our authorization to provide mortgage insurance in the United Kingdom enables us to offer our products in all the European Union member states, subject to certain regulatory requirements of the PRA and FCA and, in some cases, local regulatory requirements. We can provide mortgage insurance only in the classes for which we have authorization under applicable regulations and must maintain required risk and capital reserves. We are also subject to the oversight of other regulatory agencies in other countries throughout Europe where we do business. For more information about U.K. insurance regulation that affects our mortgage subsidiaries that operate in the United Kingdom, see “—U.K. Insurance Regulation.”
Other Non-U.S. Insurance Regulation
We operate in a number of countries around the world in addition to the United States, Canada, Australia, the United Kingdom and Bermuda. Generally, our subsidiaries (and in some cases our branches) conducting business in these countries must obtain licenses from local regulatory authorities and satisfy local regulatory requirements, including those relating to rates, forms, capital, reserves and financial reporting.
Other Laws and Regulations
Securities regulation
Certain of our U.S. subsidiaries and certain policies, contracts and services offered by them, are subject to regulation under federal and state securities laws and regulations of the SEC, state securities regulators and FINRA. Most of our insurance company separate accounts are registered under the Investment Company Act of 1940. Most of our variable annuity contracts and all of our variable life insurance policies, as well as our FABNs issued by one of our U.S. subsidiaries as part of our registered notes program are registered under the Securities Act of 1933. One of our U.S. subsidiaries is registered and regulated as a broker/dealer under the Securities Exchange Act of 1934 and is a member of, and subject to regulation by FINRA, as well as by various state and local regulators. The registered representatives of our broker/dealer are also regulated by the SEC and FINRA and are subject to applicable state and local laws.
These laws and regulations are primarily intended to protect investors in the securities markets and generally grant supervisory agencies broad administrative powers, including the power to limit or restrict the conduct of business for failure to comply with such laws and regulations. In such event, the possible sanctions that may be imposed include suspension of individual employees, limitations on the activities in which the broker/dealer may engage, suspension or revocation of the investment adviser or broker/dealer registration, censure or fines. We may also be subject to similar laws and regulations in the states and other countries in which we offer the products described above or conduct other securities-related activities.
Certain of our U.S. subsidiaries also sponsor and manage investment vehicles that rely on certain exemptions from registration under the Investment Company Act of 1940 and the Securities Act of 1933. Nevertheless, certain provisions of the Investment Company Act of 1940 and the Securities Act of 1933 apply to these investment vehicles and the securities issued by such vehicles in certain circumstances. The Investment Company Act of 1940, the Securities Exchange Act of 1934 and the Securities Act of 1933, including the rules and regulations promulgated thereunder, are subject to change, which may affect our U.S. subsidiaries that sponsor and manage such investment vehicles.
The SEC, FINRA, state attorneys general, other federal offices and the New York Stock Exchange may conduct periodic examinations, in addition to special or targeted examinations of us and/or specific products. These examinations or inquiries may include, but are not necessarily limited to, product disclosures and sales issues, financial and accounting disclosure and operational issues. Often examinations are “sweep exams” whereby the regulator reviews current issues facing the financial or insurance industry as a whole.
52
Environmental considerations
As an owner and operator of real property, we are subject to extensive U.S. federal and state and non-U.S. environmental laws and regulations. Potential environmental liabilities and costs in connection with any required remediation of such properties is also an inherent risk in property ownership and operation. In addition, we hold equity interests in companies, and have made loans secured by properties, that could potentially be subject to environmental liabilities. We routinely have environmental assessments performed with respect to real estate being acquired for investment and real property to be acquired through foreclosure. We cannot provide assurance that unexpected environmental liabilities will not arise. However, based upon information currently available to us, we believe that any costs associated with compliance with environmental laws and regulations or any remediation of such properties will not have a material adverse effect on our business, financial condition or results of operations.
ERISA considerations
We provide certain products and services to employee benefit plans that are subject to the Employee Retirement Income Security Act of 1974 (“ERISA”) or the Internal Revenue Code. As such, our activities are subject to the restrictions imposed by ERISA and the Internal Revenue Code, including the requirement under ERISA that fiduciaries must perform their duties solely in the interests of ERISA plan participants and beneficiaries, and fiduciaries may not cause or permit a covered plan to engage in certain prohibited transactions with persons who have certain relationships with respect to such plans. The applicable provisions of ERISA and the Internal Revenue Code are subject to enforcement by the U.S. Department of Labor, the Internal Revenue Service (“IRS”) and the Pension Benefit Guaranty Corporation.
USA PATRIOT Act
The USA PATRIOT Act of 2001 (the “Patriot Act”), enacted in response to the terrorist attacks on September 11, 2001, contains anti-money laundering and financial transparency laws and mandates the implementation of various new regulations applicable to broker/dealers and other financial services companies including insurance companies. The Patriot Act seeks to promote cooperation among financial institutions, regulators and law enforcement entities in identifying parties who may be involved in terrorism or money laundering. Anti-money laundering laws outside of the United States contain similar provisions. The increased obligations of financial institutions to identify their customers, watch for and report suspicious transactions, respond to requests for information by regulatory authorities and law enforcement agencies, and share information with other financial institutions, require the implementation and maintenance of internal practices, procedures and controls. We believe that we have implemented, and that we maintain, appropriate internal practices, procedures and controls to enable us to comply with the provisions of the Patriot Act. Certain additional requirements became applicable under the Patriot Act in May 2006 through a U.S. Treasury regulation which required that certain insurers have anti-money laundering compliance plans in place. We believe our internal practices, procedures and controls comply with these requirements.
Privacy of consumer information
U.S. federal and state laws and regulations require financial institutions, including insurance companies, to protect the security and confidentiality of consumer financial information and to notify consumers about the companies’ policies and practices relating to their collection and disclosure of consumer information and their policies relating to protecting the security and confidentiality of that information. Similarly, federal and state laws and regulations also govern the disclosure and security of consumer health information. In particular, regulations promulgated by the U.S. Department of Health and Human Services and the Federal Trade Commission regulate the disclosure and use of protected health information by health insurers and others, the physical and procedural safeguards employed to protect the security of that information, including certain notice requirements in the event of security breaches, and the electronic transmission of such information. Congress and state legislatures are expected to consider additional legislation relating to privacy and other aspects of consumer information.
53
In Europe, the collection and use of personal information is subject to strict regulation. The European Union’s Data Protection Directive establishes a series of privacy requirements that European Union member states are obliged to enact into their national legislation. Certain European Union countries have additional national law requirements regarding the use of private data. Other European countries that are not European Union member states have similar privacy requirements in their national laws. These requirements generally apply to all businesses, including insurance companies. In general, companies may process personal information only if consent has been obtained from the individuals concerned or if certain other conditions are met. These other requirements include the provision of notice to customers and other persons concerning how their personal information is used and disclosed, limitations on the transfer of personal information to countries outside the European Union, registration with the national privacy authorities, where applicable, and the use of appropriate information security measures against the access or use of personal information by unauthorized persons. Similar laws and regulations protecting the security and confidentiality of consumer and financial information are also in effect in Canada, Australia and other countries in which we operate.
Employees
As of December 31, 2013, we had approximately 5,000 full-time and part-time employees. We believe our employee relations are satisfactory.
Directors and Executive Officers
See Part III, Item 10 of this Annual Report on Form 10-K for information about our directors and executive officers.
Available Information
Our Annual Report on Form 10-K, Quarterly Reports on Form 10-Q, Current Reports on Form 8-K and amendments to those reports filed or furnished pursuant to Section 13(a) or 15(d) of the Exchange Act are available, without charge, on our website, www.genworth.com, as soon as reasonably practicable after we file such reports with the SEC. The public may read and copy any materials we file with the SEC at the SEC’s Public Reference Room at 100 F Street, NE, Washington, DC 20549. The public may obtain information on the operation of the Public Reference Room by calling the SEC at 1-800-SEC-0330. Copies of our SEC filings are also available, without charge, from Genworth Investor Relations, 6620 West Broad Street, Richmond, VA 23230.
Our website also includes the charters of our Audit Committee, Nominating and Corporate Governance Committee, Legal and Public Affairs Committee, and Management Development and Compensation Committee, any key practices of these committees, our Governance Principles, and our company’s code of ethics. Copies of these materials also are available, without charge, from Genworth Investor Relations, at the above address. Within the time period required by the SEC and the New York Stock Exchange, we will post on our website any amendment to our code of ethics and any waiver applicable to any of our directors, executive officers or senior financial officers.
On June 6, 2013, our President and Chief Executive Officer certified to the New York Stock Exchange that he was not aware of any violation by us of the New York Stock Exchange’s corporate governance listing standards.
Transfer Agent and Registrar
Our Transfer Agent and Registrar is Computershare Shareowner Services LLC, P.O. Box 30170, College Station, TX 77842-3170. Telephone: 866-229-8413; 201-680-6578 (outside the United States and Canada may call collect); and 800-231-5469 (for hearing impaired).
54
| Item 1A. | Risk Factors |
You should carefully consider the following risks. These risks could materially affect our business, results of operations or financial condition, cause the trading price of our common stock to decline materially or cause our actual results to differ materially from those expected or those expressed in any forward-looking statements made by us or on our behalf. These risks are not exclusive, and additional risks to which we are subject include, but are not limited to, the factors mentioned under “Cautionary note regarding forward-looking statements” and the risks of our businesses described elsewhere in this Annual Report on Form 10-K for the year ended December 31, 2013.
Risks Relating to Our Businesses
Downturns and volatility in global economies and equity and credit markets could materially adversely affect our business and results of operations.
Our results of operations are materially affected by the state of the global economies in which we operate and conditions in the capital markets we access. Factors such as high unemployment, low consumer spending, low business investment, high government spending, the volatility and strength of the global capital markets, and inflation all affect the business and economic environment and, ultimately, the amount and profitability of our business. The recessionary state and the volatility of many economies have fueled uncertainty and downturns in global mortgage markets and have contributed to increased volatility in our business and results of operations. This uncertainty and volatility has impacted, and may impact in the future, the demand for certain financial and insurance products. As a result, we may experience an elevated incidence of claims and lapses or surrenders of policies, and some of our policyholders may choose to defer paying insurance premiums or stop paying insurance premiums altogether.
Rising unemployment or underemployment rates can negatively impact a borrower’s ability to pay his or her mortgage, thereby increasing the likelihood that we could incur additional losses in our mortgage insurance businesses. We set loss reserves for our mortgage insurance businesses based in part on expected claims and delinquency cure rate patterns. These expectations reflect our assumptions regarding unemployment and underemployment levels. If such levels are higher than those within our loss reserving assumptions, the claims frequency for our mortgage insurance businesses could be higher than we had projected. We also set prices for our lifestyle protection insurance products, including our employment-related products, based upon expected claims and payment patterns. These expectations also reflect our assumptions regarding unemployment levels. If unemployment levels are higher than our pricing assumptions, the claims frequency could be higher for our lifestyle protection insurance business than we had projected. The long-term profitability of many of these products depends upon how our actual experience compares with our pricing assumptions, with the exception of many of our monthly premium accounts, where we have the ability to re-price our in-force policies in the event of higher than anticipated unemployment-related losses.
If domestic and international equity and credit markets experience heightened volatility and turmoil, issuers that have exposure to the mortgage and credit markets would be particularly affected. These events would have an adverse effect on us, in part because we have exposure to such issuers in our investment portfolio and also because such events can influence customer behavior. In addition, given continuing economic challenges, issuers of the fixed-income securities and commercial mortgage loans that we own may default on principal and interest payments, which could cause significant declines in the value of our investment portfolio. Securities that are less liquid could also become more difficult to value and could be hard to dispose of in this economic environment.
The economic downturn has had an adverse effect on our ability to efficiently access capital markets for capital management purposes, including our ability to issue fixed and floating rate non-recourse funding obligations for purposes of supporting our term and universal life insurance products. If credit markets remain tight, this could have a continuing adverse impact on our profitability, liquidity and access to funding opportunities.
55
Downturns and volatility in equity markets may also cause some existing customers to withdraw cash values or reduce investments in our separate account products, which include variable annuities. In addition, if the performance of the underlying mutual funds in our separate account products experience downturns and volatility for an extended period of time, the payment of any living benefit guarantee available in certain variable annuity products may have an adverse effect on us, because more payments will be required to come from general account assets than from contractholder separate account investments. Continued equity market volatility could result in additional losses in our variable annuity products and associated hedging program, which will further challenge our ability to recover deferred acquisition costs (“DAC”) on these products and could lead to additional write-offs of DAC, as well as increased hedging costs.
Downturns in equity markets could also lead to an increase in liabilities associated with secondary guarantee features, such as guaranteed minimum benefits on separate account products and fixed indexed annuities, where we have equity market risk exposure.
A downgrade or a potential downgrade in our financial strength or credit ratings could result in a loss of business and adversely affect our financial condition and results of operations.
Financial strength ratings, which various rating agencies publish as measures of an insurance company’s ability to meet contractholder and policyholder obligations, are important to maintaining public confidence in our products, the ability to market our products and our competitive position. Credit ratings, which rating agencies publish as measures of an entity’s ability to repay its indebtedness, are important to our ability to raise capital through the issuance of debt and other forms of credit and to the cost of such financing.
Over the last several years, the ratings of our holding company and several of our insurance companies have been downgraded and/or put on review for potential downgrade on various occasions. A ratings downgrade or review could occur (and have occurred) for a variety of reasons, including reasons specifically related to our company, generally related to our industry or the broader financial services industry or as a result of changes by the rating agencies in their methodologies or rating criteria. A negative outlook on our ratings or a downgrade in any of our financial strength or credit ratings, the announcement of a potential downgrade or review, or customer concerns about the possibility of a downgrade or review, could have a material adverse effect on our business, financial condition and results of operations. These direct or indirect effects could include, but are not limited to:
| • | reducing new sales of insurance products, annuities and other investment products; |
| • | requiring us to modify some of our existing products or services to remain competitive, or introduce new products or services; |
| • | adversely affecting our relationships with key distributors, independent sales intermediaries and our dedicated sales specialists, including the loss of exclusivity under certain agreements with our independent sales intermediaries; |
| • | materially increasing the number or amount of policy surrenders and withdrawals by contractholders and policyholders; |
| • | requiring us to post additional collateral or terminate contracts under the terms of agreements with derivative counterparties, or to provide support in the form of collateral, capital contributions or letters of credit under the terms of certain of our reinsurance, securitization and other agreements; |
| • | adversely affecting our ability to maintain reinsurance assumed or obtain new reinsurance or obtain it on reasonable pricing terms; |
| • | adversely affecting our ability to raise capital; and |
| • | increasing our cost of borrowing. |
56
In addition, the GSEs require maintenance of a financial strength rating by at least two out of three listed rating agencies (S&P, Fitch Ratings (“Fitch”) and Moody’s) of at least “AA-”/“Aa3” (as applicable) under the GSE MI Eligibility Standards; otherwise, these requirements state that additional limitations or requirements may be imposed in the case of Fannie Mae or will be imposed in the case of Freddie Mac for eligibility to insure loans purchased by the GSEs. Currently, we do not meet the ratings requirements of the GSE MI Eligibility Standards, and have remained in discussions with the GSEs. In February 2008, the GSEs temporarily suspended their ratings requirements for top tier mortgage insurers, subject to submission of an acceptable remediation plan. We have submitted remediation plans to both GSEs and to date have not been advised that either intends to impose additional requirements upon us. For the year ended December 31, 2013, the GSEs purchased the majority of the flow loans we insured in the United States. An inability to insure mortgage loans sold to the GSEs, or their transfer of our existing policies to an alternative mortgage insurer, would have a materially adverse effect on our financial condition and results of operations.
Interest rate fluctuations and levels could adversely affect our business and profitability.
Our insurance and investment products are sensitive to interest rate fluctuations and expose us to the risk that falling interest rates or credit spreads will reduce our margin or the difference between the returns we earn on the investments that support our obligations under these products and the amounts that we must pay to policyholders and contractholders. We may reduce the interest rates we credit on most of these products only at limited, pre-established intervals, and some contracts have guaranteed minimum interest crediting rates. As a result, historically low interest rates over the last few years have adversely impacted, and may continue to adversely impact, our business and profitability.
During periods of increasing market interest rates, we may offer higher crediting rates on interest-sensitive products, such as universal life insurance and fixed annuities, and we may increase crediting rates on in-force products to keep these products competitive. In addition, rapidly rising interest rates may cause increased policy surrenders, withdrawals from life insurance policies and annuity contracts and requests for policy loans, as policyholders and contractholders shift assets into higher yielding investments. Therefore, increases in crediting rates, as well as surrenders and withdrawals, could have an adverse effect on our financial condition and results of operations, including the requirement to liquidate fixed-income investments in an unrealized loss position to satisfy surrenders or withdrawals.
Our life insurance, long-term care insurance and fixed annuity products, as well as our guaranteed benefits on variable annuities, also expose us to the risk of interest rate fluctuations. The pricing and expected future profitability of these products are based in part on expected investment returns. Over time, life and long-term care insurance products generally produce positive cash flows as customers pay periodic premiums, which we invest as they are received. Low interest rates increase reinvestment risk and reduce our ability to achieve our targeted investment margins and have, and may further, adversely affect the profitability of our life insurance, long-term care insurance and fixed annuity products, as well as increase hedging costs on our in-force block of variable annuity products. A low interest rate environment negatively impacts the sufficiency of our margins on both our DAC and present value of future profits (“PVFP”). If interest rates remain low for a prolonged period, this could result in an impairment of these assets, and may reduce funds available to pay claims, including life and long-term care insurance claims, requiring an increase in our reserve liabilities, which could be significant. In addition, certain statutory capital requirements are based on models that consider interest rates. Prolonged periods of low interest rates may increase the statutory reserves we are required to hold as well as the amount of assets and capital we must maintain to support statutory reserves.
In both the U.S. and international mortgage markets, rising interest rates generally reduce the volume of new mortgage originations. A decline in the volume of new mortgage originations would have an adverse effect on our new insurance written. Rising interest rates also can increase the monthly mortgage payments for insured homeowners with adjustable rate mortgages (“ARMs”) that could have the effect of increasing default rates on ARM loans, thereby increasing our exposure on our mortgage insurance policies. This is particularly relevant in our international mortgage insurance business where ARMs are the predominant mortgage product.
57
Declining interest rates historically have increased the rate at which borrowers refinance their existing mortgages, thereby resulting in cancellations of the mortgage insurance covering the refinanced loans. Declining interest rates historically have also contributed to home price appreciation, which may provide borrowers in the United States with the option of cancelling their mortgage insurance coverage earlier than we anticipated when pricing that coverage. These cancellations could have an adverse effect on our results of our U.S. mortgage insurance business. Home prices underwent a period of pricing decline beginning in 2007 and continuing until recently, rendering certain borrowers of existing higher rate ARMs ineligible for refinancing. This led to higher delinquencies and foreclosures as borrowers were not able to refinance and avoid the reset higher monthly payments due under the terms of the underlying ARMs. These developments have had an adverse impact on our U.S. mortgage insurance business.
Interest rate fluctuations could also have an adverse effect on the results of our investment portfolio. During periods of declining market interest rates like over the past few years, the interest we receive on variable interest rate investments decreases. In addition, during those periods, we have had to, and in the future may have to, reinvest the cash we receive as interest or return of principal on our investments in lower-yielding high-grade instruments or in lower-credit instruments to maintain comparable returns. Issuers of fixed-income securities have also, and in the future may also decide to prepay their obligations in order to borrow at lower market rates, which exacerbates the risk that we have to invest the cash proceeds of these securities in lower-yielding or lower-credit instruments. During periods of increasing interest rates, market values of lower-yielding assets will decline. In addition, our interest rate hedges could decline which would require us to post additional collateral with our derivative counterparties.
See “Part II—Item 7A—Quantitative and Qualitative Disclosures About Market Risk” for additional information about interest rate risk.
Adverse capital and credit market conditions may significantly affect our access to capital and may affect our ability to meet liquidity or refinancing requirements in the future.
In the event market or other conditions have an adverse impact on our capital and liquidity needs, we could have to seek additional funding. We may also need to seek additional funding to refinance existing indebtedness or to build buffers and manage overall capital and risk profiles at the holding company. Funding sources could potentially include the generation of proceeds from the sale of assets (including assets in our investment portfolio, blocks of business or all or a portion of a business) or the incurrence of debt securities at the Genworth Financial or Genworth Holdings levels convertible or exchangeable into equity, with any decision to issue debt convertible or exchangeable into equity considering the degree to which such issuance would dilute current stockholders’ value. All such funding sources could have adverse impacts on our financial condition, including book value, and results of operations.
The availability of additional funding will depend on a variety of factors such as market conditions, regulatory considerations, the general availability of credit, the overall availability of credit to the financial services industry, the level of activity and availability of reinsurers or acquirers of assets, our credit ratings and credit capacity and the performance of and outlook for our business. Market conditions may make it difficult to obtain funding or complete asset sales to generate additional liquidity, especially on short notice. Our access to funding may be further impaired if our credit or financial strength ratings are negatively impacted.
On September 26, 2013, we entered into a new credit agreement that provides a $300 million multicurrency revolving credit facility, with a $100 million sublimit for letters of credit, available on a revolving basis until September 26, 2016. Currently there is no amount outstanding under the credit facility. Our ability to borrow is subject to compliance with various financial and other covenants and conditions. We cannot be sure we will be compliant with these covenants or satisfy other conditions in the event we seek to borrow in the future.
58
Our valuation of fixed maturity, equity and trading securities include methodologies, estimations and assumptions that are subject to differing interpretations and could result in changes to investment valuations that may materially adversely affect our results of operations or financial condition.
Fixed maturity, equity and trading securities are reported at fair value on our consolidated balance sheets. They represent the majority of our total cash, cash equivalents and invested assets. Our portfolio of fixed maturity securities consists primarily of investment grade securities. Valuations include inputs and assumptions that are less observable or require greater estimation, as well as valuation methods that are more complex or require greater estimation, thereby resulting in values that are less certain and may vary significantly from the value at which the investments may be ultimately sold. The methodologies, estimates and assumptions we use in valuing our investment securities evolve over time and are subject to different interpretation (including based on developments in relevant accounting literature), all of which can lead to changes in the value of our investment securities. Rapidly changing and unanticipated credit and equity market conditions could materially impact the valuation of investment securities as reported within our consolidated financial statements, and the period-to-period changes in value could vary significantly. Decreases in value may have a material adverse effect on our results of operations or financial condition.
Defaults or other events impacting the value of our fixed maturity securities portfolio may reduce our income.
We are subject to the risk that the issuers or guarantors of fixed maturity securities we own may default on principal or interest payments they owe us. As of December 31, 2013, fixed maturity securities of $58.6 billion in our investment portfolio represented 81% of our total cash, cash equivalents and invested assets. Events reducing the value of our investment portfolio other than on a temporary basis could have a material adverse effect on our business, results of operations and financial condition. Levels of write-downs or impairments are impacted by our assessment of the financial condition of the issuer, whether or not the issuer is expected to pay its principal and interest obligations or circumstances that would require us to sell securities which have declined in value.
Our investment portfolio contains investments in securities in multiple nations, including companies domiciled in the European Union. Recently, the European Union member states have experienced increases in their debt levels as a percentage of gross domestic product as well as increased inflation and unemployment during the global economic downturn. Financial troubles of certain nations can trigger financial implications in other nations. In particular, a number of large European banks hold significant amounts of sovereign financial institution debt of other European nations and could experience difficulties as a result of defaults or declines in the value of such debt. If we determine to reposition or realign portions of the portfolio where we determine to sell certain securities in an unrealized loss position, we will incur an other-than-temporary impairment charge.
Defaults on our commercial mortgage loans or the mortgage loans underlying our investments in commercial mortgage-backed securities and volatility in performance may adversely affect our profitability.
Our commercial mortgage loans and investments in commercial mortgage-backed securities face default risk. Commercial mortgage loans are stated on our consolidated balance sheets at unpaid principal balance, adjusted for any unamortized premium or discount, deferred fees or expenses, and are net of impairments and valuation allowances. We establish valuation allowances for estimated impairments as of the balance sheet date based on information, such as the market value of the underlying real estate securing the loan, any third-party guarantees on the loan balance or any cross collateral agreements and their impact on expected recovery rates. Commercial mortgage-backed securities are stated on our consolidated balance sheets at fair value.
Further, any concentration of geographic or sector exposure in our commercial mortgage loans or the mortgage loans underlying our investments in commercial mortgage-backed securities may have adverse effects on our investment portfolio and consequently on our consolidated results of operations or financial condition. While we seek to mitigate this risk by having a broadly diversified portfolio, events or developments that have a
59
negative effect on any particular geographic region or sector may have a greater adverse effect on the investment portfolios to the extent that the portfolios are exposed.
Reinsurance may not be available, affordable or adequate to protect us against losses.
As part of our overall risk and capital management strategy, we have historically purchased reinsurance from external reinsurers as well as provided internal reinsurance support for certain risks underwritten by our various business segments. These reinsurance arrangements enable our businesses to improve their statutory capital position. Some of these reinsurance arrangements are indefinite, but others require periodic renewals. The availability and cost of reinsurance protection are impacted by our operating and financial performance as well as conditions beyond our control. For example, volatility in the equity markets and the related impact on asset values required to fund liabilities may reduce the availability of certain types of reinsurance and make it more costly when it is available, as reinsurers are less willing to take on credit risk in a volatile market. Accordingly, we may be forced to incur additional expenses for reinsurance or may not be able to obtain new reinsurance or renew existing reinsurance arrangements on acceptable terms, or at all, which could adversely affect our ability to write future business or obtain statutory capital credit for new reinsurance or could require us to make capital contributions to maintain regulatory capital requirements.
If counterparties to our reinsurance arrangements or to derivative instruments we use to hedge our business risks default or fail to perform, we may be exposed to risks we sought to mitigate, which could adversely affect our financial condition and results of operations.
We routinely execute reinsurance and derivative transactions with reinsurers, brokers and dealers, commercial banks, investment banks and other institutional clients to mitigate our risks in various circumstances and to hedge various business risks. Many of these transactions expose us to credit risk in the event of default of our counterparty or client. Reinsurance does not relieve us of our direct liability to our policyholders, even when the reinsurer is liable to us. Accordingly, we bear credit risk with respect to our reinsurers. We cannot give assurance that our reinsurers will pay the reinsurance recoverable owed to us now or in the future or that they will pay these recoverables on a timely basis. A reinsurer’s insolvency, inability or unwillingness to make payments under the terms of its reinsurance agreement with us could have an adverse effect on our financial condition and results of operations. We also enter into a variety of derivative instruments, including options and interest rate and currency swaps with a number of counterparties. If our counterparties fail or refuse to honor their obligations under the derivative instruments, our hedges of the related risk will be ineffective. This failure could have an adverse effect on our financial condition and results of operations.
We ceded to UFLIC our in-force structured settlements block of business issued prior to 2004, certain variable annuity business issued prior to 2004 and the long-term care insurance assumed from MetLife Insurance Company of Connecticut. UFLIC has established trust accounts for our benefit to secure its obligations under the reinsurance arrangements, and General Electric Capital Corporation, an indirect subsidiary of GE, has agreed to maintain UFLIC’s RBC above a specified minimum level. If UFLIC becomes insolvent notwithstanding this agreement, and the amounts in the trust accounts are insufficient to pay UFLIC’s obligations to us, it could have an adverse effect on our financial condition and results of operations.
An adverse change in our risk-based capital and other regulatory requirements could result in a decline in our ratings and/or increased scrutiny by regulators and have an adverse impact on our financial condition, results of operations and prospects.
Our domestic life insurance subsidiaries are subject to the NAIC’s RBC standards and other minimum statutory capital and surplus requirements imposed under the laws of their respective states of domicile. The failure of our insurance subsidiaries to meet applicable RBC requirements or minimum statutory capital and surplus requirements could subject our insurance subsidiaries to further examination or corrective action imposed by state insurance regulators, including limitations on their ability to write additional business, the addition of state supervision, seizure or liquidation.
60
Our domestic mortgage insurers are not subject to the NAIC’s RBC requirements but are required by certain states and other regulators to maintain a certain risk-to-capital ratio. The failure of our domestic mortgage insurance subsidiaries to meet their regulatory requirements, including the proposed changes to the GSE MI Eligibility Standards, could limit our ability to write new business. For further discussion of the importance of risk-to-capital requirements to our U.S. mortgage insurance subsidiaries, see “—Our U.S. mortgage insurance subsidiaries are subject to minimum statutory capital requirements and hazardous financial condition standards which, if not met or waived to the extent needed, would result in restrictions or prohibitions on our doing business and may have an adverse impact on our results of operations. There can be no assurance that we will be able to continue to satisfy these requirements.”
Additionally, our international insurance subsidiaries also have minimum regulatory requirements which vary by country. As described under “U.K. Insurance Regulation—Solvency requirements,” there will be fundamental changes to the existing solvency capital regime for all insurers and reinsurers operating in Europe as a result of the introduction of the Solvency II directive, which will become effective on January 1, 2016. At this stage, it is not possible to predict the impact these changes will have on our operations.
An adverse change in our RBC, risk-to-capital ratio or other minimum regulatory requirements also could cause rating agencies to downgrade the financial strength ratings of our insurance subsidiaries and the credit ratings of Genworth Holdings, which would have an adverse impact on our ability to write and retain business. Certain actions by regulators or rating agencies with respect to these requirements could have a material adverse effect on our financial condition and results of operations.
If our reserves for future policy claims are inadequate, we may be required to increase our reserve liabilities, which could adversely affect our results of operations and financial condition.
We calculate and maintain reserves for estimated future payments of claims to our policyholders and contractholders in accordance with U.S. GAAP and industry accounting practices. We release these reserves as those future obligations are extinguished. The reserves we establish reflect estimates and actuarial assumptions with regard to our future experience. These estimates and actuarial assumptions involve the exercise of significant judgment. Our future financial results depend significantly upon the extent to which our actual future experience is consistent with the assumptions we have used in pricing our products and determining our reserves. Many factors, and changes in these factors, can affect future experience, including, but not limited to: interest rates; market returns and volatility; economic and social conditions, such as inflation, unemployment, home price appreciation or depreciation, and health care experience; policyholder persistency; insured life expectancy or longevity; insured morbidity; and doctrines of legal liability and damage awards in litigation. Therefore, we cannot determine with precision the ultimate amounts we will pay for actual claims or the timing of those payments. Moreover, we may not be able to mitigate the impact of unexpected adverse experience by increasing premiums add/or other charges to policyholders.
We regularly review our reserves and associated assumptions as part of our ongoing assessment of our business performance and risks. If we conclude that our reserves are insufficient to cover actual or expected policy and contract benefits and claim payments (as we have on various occasions in the past) as a result of changes in experience, assumptions or otherwise, we would be required to increase our reserves and incur charges for the period in which we make the determination. The amounts of such increases may be significant (as they have been on occasions in the past) and this would adversely affect our results of operations and financial condition and may put additional strain on our available liquidity.
As holding companies, we and Genworth Holdings depend on the ability of our respective subsidiaries to transfer funds to each of us to pay dividends and to meet our obligations.
We and Genworth Holdings each act as a holding company for our respective subsidiaries and do not have any significant operations of our own. Dividends from our respective subsidiaries, permitted payments to us under tax sharing and expense reimbursement arrangements with our subsidiaries and proceeds from borrowings
61
are our principal sources of cash to meet our obligations. These obligations include operating expenses and interest and principal on current and any future borrowings and amounts owed to GE under the Tax Matters Agreement. If the cash we receive from our respective subsidiaries pursuant to dividends and tax sharing and expense reimbursement arrangements is insufficient to fund any of these obligations, or if a subsidiary is unable to pay dividends to either of us, we or Genworth Holdings may be required to raise cash through the incurrence of debt (including convertible or exchangeable debt), the sale of assets or the issuance of additional equity.
The payment of dividends and other distributions by each of our insurance subsidiaries is regulated by insurance laws and regulations. In general, dividends in excess of prescribed limits are deemed “extraordinary” and require insurance regulatory approval. In addition, insurance regulators may prohibit the payment of ordinary dividends or other payments by the insurance subsidiaries (such as a payment under a tax sharing agreement or for employee or other services) if they determine that such payment could be adverse to policyholders or contractholders.
Additionally, as a public company that is traded on the TSX, Genworth Canada is subject to securities laws and regulations in each province in Canada, as well as the rules of the TSX. These applicable laws, regulations and rules include but are not limited to, obligations and procedures in respect of the equal and fair treatment of all shareholders of Genworth Canada. Although the board of directors of Genworth Canada is composed of a majority of Genworth nominees, under Canadian law each director has an obligation to act honestly and in good faith with a view to the best interests of Genworth Canada. Accordingly, actions taken by Genworth Canada and its board of directors (including the payment of dividends to us) are subject to, and may be limited by, the laws, regulations and rules applicable to such entities. Similarly, Australian regulations and rules will apply if we complete the planned Australian IPO.
Competitors could negatively affect our ability to maintain or increase our market share and profitability.
Our businesses are subject to intense competition. We believe the principal competitive factors in the sale of our products are product features, product investment returns, price, commission structure, marketing and distribution arrangements, brand, reputation, financial strength ratings and service. In many of our product lines, we face competition from competitors that have greater market share or breadth of distribution, offer a broader range of products, services or features, assume a greater level of risk, have lower profitability expectations or have higher financial strength ratings than we do. Many competitors offer similar products and use similar distribution channels. The appointment of a receiver to rehabilitate or liquidate or take other adverse regulatory actions against a significant competitor could also negatively impact our businesses if such actions were to impact consumer confidence in industry products and services.
Our focus on key distribution relationships may expose us to reduced sales in the future.
We distribute our products through a wide variety of distribution methods, including through relationships with key distribution partners. These distribution partners are an integral part of our business model. We are at risk that key distribution partners may merge, change their distribution model affecting how our products are sold, or terminate their distribution contracts with us. In addition, timing of key distributor adoption of our new product offerings may impact sales of those products. Distributors may elect to reduce or terminate their distribution relationships with us if there are adverse developments in our business, adverse rating agency actions, concerns about market-related risks, commission levels or the breadth of our product offerings. Any termination or material change in relationship with a key distribution partner could have a material adverse effect on our future sales for one or more product lines.
Our insurance businesses are heavily regulated and changes in regulation may reduce our profitability and limit our growth.
Our insurance operations are subject to a wide variety of laws and regulations. State insurance laws regulate most aspects of our U.S. insurance businesses, and our insurance subsidiaries are regulated by the insurance departments of the states in which they are domiciled and licensed. Our international operations are principally
62
regulated by insurance regulatory authorities in the jurisdictions in which they are domiciled. Failure to comply with applicable regulations or to obtain or maintain appropriate authorizations or exemptions under any applicable laws could result in restrictions on our ability to do business or engage in activities regulated in one or more jurisdictions in which we operate and could subject us to fines and other sanctions which could have a material adverse effect on our business. In addition, the nature and extent of regulation of our activities in applicable jurisdictions could materially change causing a material adverse effect on our business.
Insurance regulatory authorities in the United States and internationally have broad administrative powers including, but not limited to:
| • | licensing companies and agents to transact business; |
| • | calculating the value of assets and determining the eligibility of assets to determine compliance with statutory requirements; |
| • | mandating certain insurance benefits; |
| • | regulating certain premium rates; |
| • | reviewing and approving policy forms; |
| • | regulating unfair trade and claims practices, including through the imposition of restrictions on marketing and sales practices, distribution arrangements and payment of inducements; |
| • | establishing and revising statutory capital and reserve requirements and solvency standards; |
| • | fixing maximum interest rates on insurance policy loans and minimum rates for guaranteed crediting rates on life insurance policies and annuity contracts; |
| • | approving future rate increases; |
| • | approving changes in control of insurance companies; |
| • | restricting the payment of dividends and other transactions between affiliates; and |
| • | regulating the types, amounts and valuation of investments. |
State insurance regulators and the NAIC regularly re-examine existing laws and regulations, specifically focusing on modifications to statutory accounting principles, interpretations of existing laws and the development of new laws and regulations applicable to insurance companies and their products. Any proposed or future legislation or NAIC initiatives, if adopted, may be more restrictive on our ability to conduct business than current regulatory requirements or may result in higher costs or increased statutory capital and reserve requirements. Further, because laws and regulations can be complex and sometimes inexact, there is also a risk that any particular regulator’s or enforcement authority’s interpretation of a legal, accounting or reserving issue may change over time to our detriment, or expose us to different or additional regulatory risks. The application of these regulations and guidelines by insurers involves interpretations and judgments that may differ from those of state insurance departments. We cannot provide assurance that such differences of opinion will not result in regulatory, tax or other challenges to the actions we have taken to date. The result of those potential challenges could require us to increase levels of statutory capital and reserves or incur higher operating costs and/or have implications on certain tax positions.
The methodology for establishing the statutory reserves on our life insurance business is subject to the requirements of Model Regulation entitled “Valuation of Life Insurance Policies,” commonly known as “Regulation XXX,” and the Valuation of Life Insurance Policies Regulation (more commonly known as “Regulation AXXX”), as clarified by Actuarial Guideline 38 (more commonly known as “AG 38”). The NAIC adopted revised statutory reserving requirements for new and in-force secondary guarantee universal life business subject to AG 38 provisions, effective December 31, 2012. These requirements reflected an agreement reached and developed by a NAIC Joint Working Group which included regulators from several states, including New York. The financial impact related to the revised statutory reserving requirements on our in-force reserves
63
subject to the new guidance was not significant as of December 31, 2012. On September 11, 2013, the New York Department of Financial Services (the “NYDFS”) announced that it no longer supported the agreement reached by the NAIC Joint Working Group and that it would require New York licensed companies to use an alternative interpretation of AG 38 for universal life insurance products with secondary guarantees. We have been in discussions with the NYDFS about its alternative interpretation and recorded $80 million of additional statutory reserves as of December 31, 2013. We continue to work with the NYDFS to determine potential future impacts, if any. The NYDFS has not finalized a permanent update to the regulation. Depending on the final regulation, our New York domiciled insurance subsidiary’s statutory reserves could increase significantly over time.
Some states are also considering adopting long-term care insurance rate stability legislation that further limits increases in long-term care insurance premium rates beyond the rate stability legislation previously adopted in certain states. If states pass rate stability legislation, we may be forced to leave the market in those states and this could limit our ability to mitigate adverse claims experience on our in-force business and adversely impact profitability. In addition, the Federal Housing Finance Agency, the regulatory body of the FHLBs, began exploring changes to federal regulations in December 2010, augmented by an additional proposed advisory bulletin in 2012 on FHLB lending to insurers. These changes, if enacted, could impact our ability to effectively utilize FHLB products and services. FHLB membership provides a low-cost alternative funding source for our businesses. Changes in these laws and regulations, or in interpretations thereof in the United States, can be made for the benefit of the consumer, or for other reasons, at the expense of the insurer and thus could have an adverse effect on our financial condition and results of operations.
Regulators in the United States and internationally have developed criteria under which they are subjecting non-bank financial companies, including insurance companies, that are deemed systemically important to higher regulatory capital requirements and stricter prudential standards. Although neither we nor any of our subsidiaries have currently been designated systemically important, we cannot predict whether we or any of our subsidiaries will be deemed systemically important in the future or how such a designation would impact our business, results of operations, cash flows or financial condition.
Legal and regulatory investigations and actions are common in the insurance business and may result in financial losses and harm our reputation.
We face the risk of litigation and regulatory investigations and actions in the ordinary course of operating our businesses, including class action lawsuits. Our pending legal and regulatory actions include proceedings specific to us and others generally applicable to business practices in the industries in which we operate. In our insurance operations, we are, have been, or may become subject to class actions and individual suits alleging, among other things, issues relating to sales or underwriting practices, increases to in-force long-term care insurance premiums, payment of contingent or other sales commissions, claims payments and procedures, cancellation or rescission of coverage, product design, product disclosure, administration, additional premium charges for premiums paid on a periodic basis, denial or delay of benefits, charging excessive or impermissible fees on products, recommending unsuitable products to customers, our pricing structures and business practices in our mortgage insurance businesses, such as captive reinsurance arrangements with lenders and contract underwriting services, violations of RESPA or related state anti-inducement laws and breaching fiduciary or other duties to customers. Plaintiffs in class action and other lawsuits against us may seek very large or indeterminate amounts, which may remain unknown for substantial periods of time. In our investment-related operations, we are subject to litigation involving commercial disputes with counterparties. We are also subject to litigation arising out of our general business activities such as our contractual and employment relationships. In addition, we are also subject to various regulatory inquiries, such as information requests, subpoenas, books and record examinations and market conduct and financial examinations, from state, federal and international regulators and other authorities. A substantial legal liability or a significant regulatory action (including uncertainty about the outcome of pending legal and regulatory investigations and actions) against us could have an adverse effect on our financial condition and results of operations. Moreover, even if we ultimately prevail in the litigation, regulatory action or investigation, we could suffer significant reputational harm and incur
64
significant legal expenses, which could have an adverse effect on our business, financial condition or results of operations. At this time, it is not feasible to predict, nor determine, the ultimate outcomes of any pending investigations and legal proceedings, nor to provide reasonable ranges of possible losses.
For further discussion of certain current investigations and proceedings in which we are involved, see “Item 3—Legal Proceedings.” We cannot assure you that these investigations and proceedings will not have a material adverse effect on our business, financial condition or results of operations. It is also possible that we could become subject to further investigations and have lawsuits filed or enforcement actions initiated against us. In addition, increased regulatory scrutiny and any resulting investigations or proceedings could result in new legal precedents and industry-wide regulations or practices that could adversely affect our business, financial condition and results of operations.
Our computer systems may fail or their security may be compromised, which could damage our business and adversely affect our financial condition and results of operations.
Our business is highly dependent upon the effective operation of our computer systems. We also have arrangements in place with our partners and other third-party service providers through which we share and receive information. We rely on these systems throughout our business for a variety of functions, including processing claims and applications, providing information to customers and distributors, performing actuarial analyses and maintaining financial records. Despite the implementation of security and back-up measures, our computer systems and those of our partners and third-party service providers may be vulnerable to physical or electronic intrusions, computer viruses or other attacks, programming errors and similar disruptive problems. The failure of these systems for any reason could cause significant interruptions to our operations, which could result in a material adverse effect on our business, financial condition or results of operations.
We retain confidential information in our computer systems, and we rely on commercial technologies to maintain the security of those systems. Anyone who is able to circumvent our security measures and penetrate our computer systems could access, view, misappropriate, alter or delete any information in the systems, including personally identifiable customer information and proprietary business information. Our employees, distribution partners and other vendors may use portable computers or mobile devices which may contain similar information to that in our computer systems, and these devices have been and can be lost, stolen or damaged, which can result in the issues including but not limited to those described in the previous sentence. In addition, an increasing number of states and foreign countries require that customers be notified if a security breach results in the inappropriate disclosure of personally identifiable customer information. Although we have experienced occasional, actual or attempted breaches of our cybersecurity, none of these breaches has had a material effect on our business, operations or reputation. Any compromise of the security of our computer systems that results in inappropriate disclosure of personally identifiable customer information could damage our reputation in the marketplace, deter people from purchasing our products, subject us to significant civil and criminal liability and require us to incur significant technical, legal and other expenses.
The occurrence of natural or man-made disasters or a pandemic could adversely affect our financial condition and results of operations.
We are exposed to various risks arising out of natural disasters, including earthquakes, hurricanes, floods and tornadoes, and man-made disasters, including acts of terrorism and military actions and pandemics. For example, a natural or man-made disaster or a pandemic could disrupt our computer systems and our ability to conduct or process business, as well as lead to unexpected changes in persistency rates as policyholders and contractholders who are affected by the disaster may be unable to meet their contractual obligations, such as payment of premiums on our insurance policies, deposits into our investment products, and mortgage payments on loans insured by our mortgage insurance policies. They could also significantly increase our mortality and morbidity experience above the assumptions we used in pricing our insurance and investment products. The continued threat of terrorism and ongoing military actions may cause significant volatility in global financial markets, and a natural or man-made disaster or a pandemic could trigger an economic downturn in the areas
65
directly or indirectly affected by the disaster. These consequences could, among other things, result in a decline in business and increased claims from those areas, as well as an adverse effect on home prices in those areas, which could result in increased loss experience in our mortgage insurance businesses. Disasters or a pandemic also could disrupt public and private infrastructure, including communications and financial services, which could disrupt our normal business operations.
A natural or man-made disaster or a pandemic could also disrupt the operations of our counterparties or result in increased prices for the products and services they provide to us. For example, a natural or man-made disaster or a pandemic could lead to increased reinsurance prices or reduced availability of reinsurance and potentially cause us to retain more risk than we otherwise would retain if we were able to obtain reinsurance at lower prices. In addition, a disaster or a pandemic could adversely affect the value of the assets in our investment portfolio if it affects companies’ ability to pay principal or interest on their securities or the value of the underlying collateral of structured securities or the value of the underlying collateral of structured securities.
The Dodd-Frank Wall Street Reform and Consumer Protection Act subjects us to additional federal regulation, and we cannot predict the effect of such regulation on our business, results of operations, cash flows or financial condition.
In July 2010, the Dodd-Frank Act was enacted and signed into law. The Dodd-Frank Act made extensive changes to the laws regulating financial services firms and requires various federal agencies to adopt a broad range of new implementing rules and regulations, many of which have begun to take effect. Federal agencies have been given significant discretion in drafting the rules and regulations that will implement the Dodd-Frank Act. Although many of those regulations have now been adopted, many of the details and much of the impact of the Dodd-Frank Act may not be known for some time. In addition, this legislation mandated multiple studies and reports for Congress, which could result in additional legislative or regulatory action.
Among other provisions, the Dodd-Frank Act provides for a new framework of regulation of OTC derivatives markets that requires us to clear certain types of transactions through clearing organizations. In mid-2013, we became subject to the clearing requirement that requires us to post highly liquid securities as initial margin and have cash available to meet daily variation margin demands for most of our new interest rate derivative transactions. The need for initial and variation margin requires us to hold additional liquid, lower-yielding securities as well as cash in our investment portfolio. In addition, over time, we will experience additional collateral requirements for derivative transactions that are not required to be cleared. Beginning in mid-February 2014, certain derivative transactions are required to be traded on swap execution facilities, regulated platforms for swap trading. Our derivatives activity is subject to greater transparency due to heightened reporting requirements. As a result of all of these changes, we may have to alter the way we use derivatives in the future, which could have a material adverse effect on our results. The Dodd-Frank Act also authorizes the SEC to adopt regulations that could impose heightened standards of care on sellers of our variable or other registered products, which could adversely affect our sales of and reduce our margins on these products.
In the case of our U.S. mortgage insurance business, the Dodd-Frank Act requires lenders to retain some of the risk associated with mortgage loans that they sell or securitize, unless the mortgage loans are “qualified residential mortgages” or unless the securitization or security is partially or fully exempted by regulations to be promulgated. The Dodd-Frank Act provides that the definition of “qualified residential mortgages” will be determined by regulators, with consideration to be given, among other things, to the presence of mortgage insurance. The legislation also prohibits a creditor from making a residential mortgage loan unless the creditor makes a reasonable and good faith determination that, at the time the loan is consummated, the consumer has a reasonable ability to repay the loan. In addition, the Dodd-Frank Act created the CFPB, which regulates certain aspects of the offering and provision of consumer financial products or services but not the business of insurance. In January 2014, CFPB rules implementing the ability-to-repay and qualified mortgage standards contained in the Dodd-Frank Act went into effect. The rules set requirements for how mortgage lenders can demonstrate that they have effectively considered the consumer’s ability to repay a mortgage loan. In addition, the rules clarify when a mortgage may be classified as a “qualified mortgage” and when a lender is eligible for a safe harbor as a
66
presumption that the lender has complied with the ability-to-repay requirements. We expect the rules to have a positive impact on the credit quality of mortgage loans which may benefit our delinquency rates but the rule may have the negative impact of reducing the number of loans originated and therefore available for the mortgage insurance market. The CFPB may issue additional rules or regulations that affect our U.S. mortgage insurance business and may assert jurisdiction over regulatory or enforcement matters in lieu of or in addition to the existing jurisdiction of other federal or state agencies.
The applicability of many of these regulations to us will depend to a large extent on whether the FSOC determines that we are systemically significant, in which case we would become subject to supervision by the Federal Reserve Board. In April 2012, FSOC adopted final rules for evaluating whether a non-bank financial company should be designated as systemically significant. To date, the FSOC has not identified us as systemically significant. Since we are not affiliated with an insured depository institution, such supervision would probably have its greatest effect on requirements relating to capital, liquidity, stress testing, limits on counterparty credit exposure, compliance and governance, early remediation in the event of financial weakness and other prudential matters. Systemically significant companies are also required to prepare resolution plans, so-called “living wills,” that set out how they could most efficiently be liquidated if they endangered the U.S. financial system or the broader economy. Insurance companies that are found to be systemically significant are permitted, in some circumstances, to submit abbreviated versions of such plans.
The Dodd-Frank Act establishes an FIO within the Department of the Treasury to perform various functions with respect to insurance, including serving as a non-voting member of the FSOC and making recommendations to the FSOC regarding insurers that may be designated for more stringent oversight by the FSOC. Genworth has not been designated to receive oversight by the FSOC, but there can be no assurances that it will not happen in the future.
The Dodd-Frank Act imposes new restrictions on the sponsorship of and investment in private equity funds and hedge funds by companies that are affiliated with an insured depository institution. While we are not affiliated with such an institution or with anyone who is, these restrictions may adversely affect the value of any interests we may have in such funds.
We cannot predict the requirements that will be imposed under all the regulations adopted under the Dodd-Frank Act, the effect regulations will have on financial markets generally, or on our businesses specifically (directly or indirectly), the additional costs associated with compliance with such regulations, or any changes to our operations that may be necessary to comply with the Dodd-Frank Act and the regulations thereunder, any of which could have a material adverse effect on our business, results of operations, cash flows or financial condition.
Our risk management program may not be effective or adequate in controlling or mitigating the risks we face.
We have developed a risk management program that includes risk identification, quantification, governance, policies and procedures and seeks to appropriately identify, monitor, measure, mitigate, control and report the types of risks to which we are subject. We regularly review our risk management program and work to update it on an ongoing basis to be consistent with evolving global best market practices. However, our risk management program may not be fully effective in controlling or mitigating all of the risks we face in our business.
Many of our methods of managing certain financial risks (e.g. credit, market, insurance and underwriting risks) are based on observed historical market behaviors and/or historical, statistically-based models. Historical measures may not accurately predict future exposures, which could be significantly greater than historical measures have indicated. We have also established internal risk limits based upon these historical, statistically-based models and we monitor compliance with these limits. Our internal risk limits may be insufficient and our monitoring may not detect all violations (inadvertent or otherwise) of these limits. Other risk management methods are based on our evaluation of information regarding markets, customers and customer behavior, macroeconomic and environmental conditions, catastrophic occurrences and potential changing paradigms that are publicly available or otherwise
67
accessible to us. This collective information may not always be accurate, complete, up to date or properly considered, interpreted or evaluated in our analyses. Management of operational, legal, franchise and global regulatory risks requires, among other things, methods to appropriately identify all such key risks, systems to record incidences and policies and procedures designed to detect, record and address all such risks and occurrences. If our risk management framework does not effectively identify and control our risks, we could suffer unexpected losses or be adversely affected and that could have a material adverse effect on our business, results of operations and financial condition.
We employ various strategies, including hedging and reinsurance, to mitigate financial risks inherent in our business and operations. These risks include current or future changes in the fair value of our assets and liabilities, current or future changes in cash flows, the effect of interest rates, changes in equity markets, and credit spread movements, the occurrence of credit and counter party defaults, currency fluctuations, changes in global housing prices, and changes in mortality, morbidity and lapses. We seek to control these risks by, among other things, entering in reinsurance contracts and derivative instruments. Such contracts and instruments may not always be available to us and subject us to counter party credit risk. Developing effective strategies for dealing with these risks is a complex process, and no strategy can fully insulate us from such risks. The execution of these strategies also introduces operational risks and considerations. See “—Reinsurance may not be available, affordable or adequate to protect us against losses” and “—If counterparties to our reinsurance arrangements or to derivative instruments we use to hedge our business risks default or fail to perform, we may be exposed to risks we sought to mitigate, which could adversely affect our financial condition and results of operations” for more information about risks inherent in our reinsurance and hedging strategies.
Our performance is highly dependent on our ability to manage risks that arise from day-to-day business activities, including underwriting, claims processing, policy administration and servicing, execution of our investment and hedging strategy, financial and tax reporting and other activities, many of which are very complex. We seek to monitor and control our exposure to risks arising out of or related to these activities through a variety of internal controls, management review processes and other mechanisms. However, the occurrence of unforeseen events, or the occurrence of events of a greater magnitude than expected, including those arising from inadequate or ineffective controls, a failure in processes, procedures or systems implemented by us or a failure on the part of employees upon which we rely in this regard, may have a material adverse effect on our financial condition or results of operations.
Past or future misconduct by our employees or employees of our vendors or suppliers could result in violations of laws by us, regulatory sanctions against us and/or serious reputational, legal or financial harm to our business, and the precautions we employ to prevent and detect this activity may not be effective in all cases. Although we employ controls and procedures designed to monitor the business decisions and activities of these individuals to prevent us from engaging in inappropriate activities, excessive risk taking, fraud or security breaches, these individuals may take such risks regardless of such controls and procedures and such controls and procedures may fail to detect all such decisions and activities. Our compensation policies and procedures are reviewed by us as part of our overall risk management program, but it is possible that such compensation policies and practices could inadvertently incentivize excessive or inappropriate risk taking. If these individuals take excessive or inappropriate risks, those risks could harm our reputation and have a material adverse effect on our business, results of operations and financial condition.
Changes in accounting and reporting standards issued by the Financial Accounting Standards Board or other standard-setting bodies and insurance regulators could adversely affect our financial condition and results of operations.
Our financial statements are subject to the application of U.S. GAAP, which is periodically revised and/or expanded. Accordingly, from time to time, we are required to adopt new or revised accounting standards issued by recognized authoritative bodies, including the Financial Accounting Standards Board. It is possible that future accounting and reporting standards we are required to adopt could change the current accounting treatment that we apply to our financial statements and that such changes could have a material adverse effect on our financial condition and results of operations. In addition, the required adoption of future accounting and reporting
68
standards may result in significant costs to implement. For example, current proposals may change the accounting for insurance contracts and financial instruments and could result in increased volatility of net income as well as other comprehensive income. In addition, these proposals could require us to make significant changes to systems and use additional resources, resulting in significant incremental costs to implement the proposals.
We may be required to recognize impairments in the value of our goodwill, which would increase our expenses and reduce our profitability.
Goodwill represents the excess of the amount we paid to acquire our subsidiaries and other businesses over the fair value of their net assets at the date of the acquisition. Under U.S. GAAP, we test the carrying value of goodwill for impairment at least annually at the “reporting unit” level, which is either an operating segment or a business one level below the operating segment. Goodwill is impaired if the amount of goodwill that would be established under a hypothetical purchase of the reporting unit is less than the carrying value of goodwill at the date of the impairment test. For example, goodwill may become impaired if the fair value of a reporting unit as a whole were to decrease to an amount that was less than its carrying value or if the value of its new business is lower than the amount of recorded goodwill. This may occur for various reasons, including changes in expected income or cash flows of a reporting unit or generation of income by a reporting unit at a lower rate of return than similar businesses or for decreases in projected new business sales. If any portion of our goodwill becomes impaired, we would be required to recognize the amount of the impairment as a non-cash expense in the current period. See “Part II—Item 7—Management’s Discussion and Analysis of Financial Condition and Results of Operations—Critical Accounting Estimates” and note 8 in our consolidated financial statements under “Part II—Item 8—Financial Statements and Supplementary Data” for additional information related to goodwill.
We have significant deferred tax assets, and any impairments of or valuation allowances against these deferred tax assets in the future could adversely affect our results of operations and financial condition.
The realizability of deferred tax assets may be limited for various reasons, including but not limited to changes in tax rules or regulations and if projected future taxable income becomes insufficient to recognize the full benefit of our net operating loss (“NOL”) carryforwards prior to their expiration. Additionally, our ability to fully use these tax assets will also be adversely affected if we have an “ownership change” within the meaning of Section 382 of the U.S. Internal Revenue Code of 1986, as amended. An ownership change is generally defined as a greater than 50% increase in equity ownership by “5% shareholders” (as that term is defined for purposes of Section 382) in any three-year period. Future changes in our stock ownership, depending on the magnitude, including the purchase or sale of our common stock by 5% shareholders, and issuances or redemptions of common stock by us, could result in an ownership change that would trigger the imposition of limitations under Section 382. Accordingly, there can be no assurance that in the future we will not experience limitations with respect to recognizing the benefits of our NOL carryforwards and other tax attributes for which limitations could have a material adverse effect on our results of operations, cash flows or financial condition.
We may face losses if there are significant deviations from our assumptions in our insurance policies and annuity contracts.
The prices and expected future profitability of our insurance and some annuity products are based upon expected claims and payment patterns, using assumptions for, among other things, projected interest rates and investment returns, morbidity rates (i.e., likelihood of sickness), mortality rates (i.e., likelihood of death of our policyholders and contractholders) and persistency (i.e., the probability that a policy or contract will remain in-force from one period to the next). The long-term profitability of these products depends upon how our actual experience compares with our pricing assumptions. For example, if morbidity rates are higher than our pricing assumptions, we could be required to establish additional reserves and make greater payments under our long-term care insurance policies than we had projected, and such amounts could be significant. Likewise, if mortality rates are lower than our pricing assumptions, we could be required to establish additional reserves and make greater payments under both our long-term care insurance policies and annuity contracts, and such amounts
69
could be significant. Conversely, if mortality rates are higher than our pricing assumptions, we could be required to make greater payments under our life insurance policies and annuity contracts with GMDBs than we had projected.
The risk that our claims experience may differ significantly from our pricing assumptions is particularly significant for our long-term care insurance products. Long-term care insurance policies provide for long-duration coverage and, therefore, our actual claims experience will emerge over many years after pricing and valuation assumptions have been established. For example, changes in economic, market and interest rate risk, socio-demographics, behavioral trends and medical advances may have an adverse impact on our future loss trends. Moreover, long-term care insurance does not have the extensive claims experience history of life insurance, and as a result, our ability to forecast future claim rates for long-term care insurance is more limited than for life insurance.
The effect of persistency on profitability varies for different products. For most of our life insurance and deferred annuity products, actual persistency that is lower than our persistency assumptions could have an adverse impact on profitability, primarily because we would be required to accelerate the amortization of expenses we deferred in connection with the acquisition of the policy or contract. For our deferred annuities with GMWBs and guaranteed annuitization benefits, actual persistency that is higher than our persistency assumptions could have an adverse impact on profitability because we could be required to make withdrawal or annuitization payments for a longer period of time than the account value would support. For our universal life insurance policies, increased persistency that is the result of the sale of policies by the insured to third parties that continue to make premium payments on policies that would otherwise have lapsed, also known as life settlements, could have an adverse impact on profitability because of the higher claims rate associated with settled policies.
For our long-term care insurance and some other health insurance policies, actual persistency in later policy durations that is higher than our persistency assumptions could have a negative impact on profitability. If these policies remain in-force longer than we assumed, then we could be required to make greater benefit payments than we had anticipated when we priced these products. This risk is particularly significant in our long-term care insurance business because we do not have the experience history that we have in many of our other businesses. As a result, our ability to predict persistency and resulting benefit experience for long-term care insurance is more limited than for many other products. Some of our long-term care insurance policies have experienced higher persistency than we had assumed, which has resulted in an adverse effect on the profitability of those products.
Because our assumptions are inherently uncertain, reserves for future policy benefits and claims may prove to be inadequate if actual experience is different from those assumptions. Although some of our products permit us to increase premiums during the life of the policy or contract, we cannot guarantee that these increases would be sufficient to maintain profitability or that such increases would be approved by regulators or approved in a timely manner. Moreover, many of our products either do not permit us to increase premiums or limit those increases during the life of the policy or contract. Significant deviations in experience from pricing expectations could have an adverse effect on the profitability of our products.
We may be required to accelerate the amortization of deferred acquisition costs and the present value of future profits, which would increase our expenses and reduce profitability.
DAC represents costs related to the successful acquisition of our insurance policies and investment contracts, which are deferred and amortized over the estimated life of the related insurance policies and investment contracts. These costs primarily consist of commissions in excess of ultimate renewal commissions and underwriting and contract and policy issuance expenses incurred on policies and contracts successfully acquired. Under U.S. GAAP, DAC is subsequently amortized to income, over the lives of the underlying contracts, in relation to the anticipated recognition of premiums or gross profits. In addition, when we acquire a block of insurance policies or investment contracts, we assign a portion of the purchase price to the right to receive future net cash flows from the acquired block of insurance and investment contracts and policies. This
70
intangible asset, called PVFP, represents the actuarially estimated present value of future cash flows from the acquired policies. We amortize the value of this intangible asset in a manner similar to the amortization of DAC.
Our amortization of DAC and PVFP generally depends upon, among other items, anticipated profits from investments, surrender and other policy and contract charges, mortality, morbidity and maintenance expense margins. Unfavorable experience with regard to expected expenses, investment returns, mortality, morbidity, withdrawals or lapses may cause us to increase the amortization of DAC or PVFP, or both, or to record a charge to increase benefit reserves, and such increases could be material.
We regularly review DAC and PVFP to determine if they are recoverable from future income. If these costs are not recoverable, they are charged as expenses in the financial period in which we make this determination. For example, if we determine that we are unable to recover DAC from profits over the life of a block of insurance policies or annuity contracts, or if withdrawals or surrender charges associated with early withdrawals do not fully offset the unamortized acquisition costs related to those policies or annuities, we would be required to recognize the additional DAC amortization as an expense in the current period. Equity market volatility could result in losses in our variable annuity products and associated hedging program which could challenge our ability to recover DAC on these products and could lead to further write-offs of DAC.
We may not be able to increase premiums on our in-force and future long-term care insurance policies by enough or quickly enough and the rate actions currently being implemented and any future rate increases may adversely affect our reputation in the market and our business.
Two significant components of our strategic plan are to increase prices on our in-force block of long-term care insurance policies and to seek more frequent price increases on such policies in the future, if dictated by our experience. Although the terms of all of our long-term care insurance policies permit us to increase premiums during the premium-paying period, these increases generally require regulatory approval, which often takes a long period of time to obtain in all relevant jurisdictions and may not be obtained in some. Moreover, rate actions by us or our competitors could adversely affect our reputation in the markets we operate and limit our ability to continue to market and sell new long-term care insurance products as well as seek rate actions in the future and retain existing policyholders, agents and independent channel sales levels. In addition, we cannot predict how our policyholders, agents, competitors and regulators may react to any rate actions, nor can we predict if regulators will approve rate action requests.
If demand fails to increase for our life insurance, long-term care insurance and fixed annuity products, we may not be able to execute on our strategy for our business and our financial condition and results of operations could be adversely affected.
Our revenue and profitability depend on the overall demand for our products and services, and our projected earnings are based in part on our assumption that sales of our life insurance, long-term care insurance and fixed annuity products will increase over time. We have devoted significant resources to developing these products and our strategy relies in part on increasing sales while maintaining the profitability of new business.
A large percentage of our revenue is derived from sales of life insurance, long-term care insurance and fixed annuity products. In recent years, industry sales of these products have varied; in some years, sales have declined while in other years sales have grown moderately. Several factors can affect demand for these products, including changes in market and economic conditions, risk tolerance of providers and customers and legislative or regulatory changes. In the past, decisions by providers to cease offering these products, to raise premiums on in-force policies and/or to introduce new products with higher prices have negatively impacted sales for these products. These actions resulted in decreased purchases of some of these products and have caused some distributors to reduce their sales focus on some of these products. Our success in these businesses depends on our ability to introduce and market products and services that are financially attractive and address our customers’ changing demands. If the market for life insurance, long-term care insurance and fixed annuity products remains flat or does not improve or if we are unable to compete effectively in that market with our product offerings, our financial condition and results of operations could be adversely affected.
71
Medical advances, such as genetic research and diagnostic imaging, and related legislation could adversely affect the financial performance of our life insurance, long-term care insurance and annuity businesses.
Genetic research includes procedures focused on identifying key genes that render an individual predisposed to specific diseases, such as particular types of cancer and other diseases. Other medical advances, such as diagnostic imaging technologies, also may be used to detect the early onset of diseases such as cancer, Alzheimer’s and cardiovascular disease. We believe that if individuals learn through medical advances that they are predisposed to particular conditions that may reduce life longevity or require long-term care, they will be more likely to purchase our life and long-term care insurance policies or not to permit existing policies to lapse. In contrast, if individuals learn that they lack the genetic predisposition to develop the conditions that reduce longevity or require long-term care, they will be less likely to purchase our life and long-term care insurance products but more likely to purchase certain annuity products. In addition, such individuals that are existing policyholders will be more likely to permit their policies to lapse.
If we were to gain access to the same genetic or medical information as our prospective policyholders and contractholders, then we would be able to take this information into account in pricing our life and long-term care insurance policies and annuity contracts. However, there have been a number of legislative and regulatory actions and proposals that make, or could make, genetic and other medical information confidential and unavailable to insurance companies. Pursuant to these legislative and regulatory actions and proposals, prospective policyholders and contractholders would only disclose this information if they chose to do so voluntarily. These factors could lead us to reduce sales of products affected by these legislative and regulatory actions and proposals and could result in a deterioration of the risk profile of our portfolio, which could lead to payments to our policyholders and contractholders that are higher than we anticipated.
Medical advances could also lead to new forms of preventive care. Preventive care could extend the life and improve the overall health of individuals. If this were to occur, the duration of payments made by us under certain of our annuity products likely would increase, thereby reducing our profitability on those products.
We may not be able to continue to mitigate the impact of Regulations XXX or AXXX and, therefore, we may incur higher operating costs that could have an adverse effect on our financial condition and results of operations.
We have increased term and universal life insurance statutory reserves in response to Regulations XXX and AXXX and have taken steps to mitigate the impact the regulations have had on our business, including increasing premium rates and implementing capital solutions, as well as changing our product offerings. We cannot provide assurance that we will be able to continue to implement actions to mitigate further impacts of Regulations XXX or AXXX on our term and universal life insurance products. Recent market conditions and regulatory constraints have limited the capacity or increased prices for these reserve funding options. If capacity continues to be limited for a prolonged period of time, our ability to obtain new funding for these structures may be hindered. Additionally, we cannot provide assurance that there will not be regulatory, tax or other challenges to the actions we have taken to date, which could require us to increase statutory reserves or incur higher operating and/or tax costs.
One way that we and other insurance companies have mitigated the impact of these regulations is through captive reinsurance companies and/or special purpose vehicles. During 2012, the NAIC began a review of the insurance industry’s use of captive life reinsurance subsidiaries and is considering changes to its model regulations. In addition, in June 2013, the NYDFS issued a report that was highly critical of insurance companies’ use of affiliated captive reinsurers and, among other things, encouraged state insurance regulators to consider a national moratorium on new reserve financing transactions involving captive insurers pending completion of the NAIC’s review. We are currently unable to predict the ultimate outcome of the NAIC’s review or state insurance departments’ actions in this regard. Regulatory changes by the NYDFS or other state insurance departments regarding the use of captives could make it more difficult and/or expensive for us to mitigate the impact of Regulations XXX and AXXX, and this in turn, could affect our product prices and offerings.
72
If we were to discontinue our use of captive life reinsurance subsidiaries to finance statutory reserves in response to regulatory changes on a prospective basis, the reasonably likely impact would be increased costs related to alternative financing, such as third-party reinsurance, and potential reductions in or discontinuance of new term or universal life insurance sales, all of which would adversely impact our consolidated results of operations and financial condition. In addition, we cannot be certain that affordable alternative financing would be available, if at all.
We have significant operations internationally that could be adversely affected by changes in political or economic stability or government policies where we operate.
We have a presence in more than 25 countries around the world. Global economic and regulatory developments could affect our business in many ways. For example, our operations are subject to local laws and regulations, which in many ways are similar to the state laws and regulations outlined above. Many of our international customers and independent sales intermediaries also operate in regulated environments. Changes in the regulations that affect their operations also may affect our business relationships with them and their ability to purchase or to distribute our products. These changes could have an adverse effect on our financial condition and results of operations. In addition, compliance with applicable laws and regulations is time consuming and personnel-intensive, and changes in these laws and regulations may increase materially our direct and indirect compliance and other expenses of doing business, thus having an adverse effect on our financial condition and results of operations.
Local, regional and global economic conditions, including changes in housing markets, employment levels, government benefit levels, credit markets, trade levels, inflation, recession and currency fluctuations, as discussed above, also could affect our international businesses. Political changes, some of which may be disruptive, can also interfere with our customers and all of our activities in a particular location. Attempts to mitigate these risks can be costly and are not always successful.
Many European countries which use the euro as a common currency have experienced levels of economic stress. Failure of European officials to resolve the current euro area debt situation may result in significant financial market volatility and instability and negatively influence our business within European countries, as well as other countries around the world.
Our international businesses and operations are subject to the tax laws and regulations, and value added tax and other indirect taxes, in the countries in which they are organized and in which they operate. Foreign governments from time to time consider legislation and regulations that could increase the amount of taxes that we pay or impact the sales of our products. An increase to tax rates in the countries in which we operate could have an adverse effect on our financial condition and results of operations.
Fluctuations in foreign currency exchange rates and international securities markets could negatively affect our profitability.
The results of our international operations are denominated in local currencies, and because we derive a significant portion of our income from our international operations, our results of operations could be adversely affected to the extent the dollar value of foreign currencies is reduced due to a strengthening of the U.S. dollar. We generally invest cash generated by our international operations in securities denominated in local currencies. As of December 31, 2013 and 2012, approximately 20% and 21%, respectively, of our invested assets were held by our international operations and were invested primarily in non-U.S.-denominated securities. Although investing in securities denominated in local currencies limits the effect of currency exchange rate fluctuation on local operating results, we remain exposed to the impact of fluctuations in exchange rates as we translate the operating results of our international operations into our consolidated financial statements. We currently do not hedge this exposure, and as a result, period-to-period comparability of our results of operations is affected by fluctuations in exchange rates. Our investments in non-U.S.-denominated securities are subject to fluctuations in
73
non-U.S. securities and currency markets, and those markets can be volatile. Non-U.S. currency fluctuations also affect the value of any dividends paid by our non-U.S. subsidiaries to their parent companies in the United States.
A significant portion of our international mortgage insurance risk in-force consists of loans with high loan-to-value ratios, which generally result in more and larger claims than loans with lower loan-to-value ratios.
Mortgage loans with higher loan-to-value ratios typically have claim incidence rates substantially higher than mortgage loans with lower loan-to-value ratios. In Canada and Australia, the risks of having a portfolio with a significant portion of high loan-to-value mortgages are greater than in the United States and Europe because we generally agree to cover 100% of the losses associated with mortgage defaults in those markets, compared to percentages in the United States and Europe that typically range between 12% and 35% of the loan amount.
Although mortgage insurance premiums for higher loan-to-value ratio loans generally are higher than for loans with lower loan-to-value ratios, the difference in premium rates may not be sufficient to compensate us for the enhanced risks associated with mortgage loans bearing higher loan-to-value ratios.
Our international mortgage insurance business is subject to substantial competition from government-owned and government-sponsored enterprises, and this may put us at a competitive disadvantage on pricing and other terms and conditions.
Like our U.S. mortgage insurance business, our international mortgage insurance business competes with government-owned and government-sponsored enterprises. In Canada, we compete with CMHC, a Crown corporation owned by the Canadian government. In Europe, these enterprises include public mortgage guarantee facilities in a number of countries. Like government-owned and government-sponsored enterprises in the United States, these competitors may establish pricing terms and business practices that may be influenced by motives such as advancing social housing policy or stabilizing the mortgage lending industry, which may not be consistent with maximizing return on capital or other profitability measures. In the event that a government-owned or sponsored entity in one of our markets determines to reduce prices significantly or alter the terms and conditions of its mortgage insurance or other credit enhancement products in furtherance of social or other goals rather than a profit motive, we may be unable to compete in that market effectively, which could have an adverse effect on our financial condition and results of operations. See “—We compete with government-owned and government-sponsored enterprises in our U.S. mortgage insurance business, and this may put us at a competitive disadvantage on pricing and other terms and conditions” below.
In Canada, CMHC is a sovereign entity that provides mortgage lenders a lower capital charge and a 100% government guarantee as compared to loans covered by our policy which benefit from a 90% government guarantee. CMHC also operates the Canadian Mortgage Bond Program, which provides lenders the ability to efficiently guaranty and securitize their mortgage loan portfolios. If we are unable to effectively distinguish ourselves competitively with our Canadian mortgage lender customers, under current market conditions or in the future, we may be unable to compete effectively with CMHC as a result of the more favorable capital relief it can provide or the other products and incentives that it offers to lenders.
Recent conditions in the international financial markets could lead other countries to nationalize our competitors or establish competing governmental agencies, which would further limit our competitive position in international markets and, therefore, materially affect our results of operations.
Changes in regulations could affect our international operations significantly and could reduce the demand for mortgage insurance.
In addition to the general regulatory risks that are described above under “—Our insurance businesses are heavily regulated and changes in regulation may reduce our profitability and limit our growth,” we are also affected by various additional regulations relating particularly to our international mortgage insurance operations.
74
All financial institutions that are federally regulated by OSFI are required to purchase mortgage insurance whenever the amount of a mortgage loan exceeds 80% of the value of the collateral property at the time the loan is made. From time to time, the Canadian government reviews the federal financial services regulatory framework and has in the past examined whether to remove, in whole or in part, the requirement for mortgage insurance on such high loan-to-value mortgages. High loan-to-value mortgage loans constitute a significant part of our portfolio of insured mortgages in Canada, and the removal, in whole or in part, of the regulatory requirement for mortgage insurance for such loans could result in a reduction in the amount of new insurance written by us in Canada in future years. In addition, any increase in the threshold loan-to-value ratio above which mortgage insurance is required could also result in a reduction in the amount of new insurance written by us in Canada in future years. Any of these events could have an adverse effect on our business, results of operations and financial condition.
Over the past several years, the Canadian government implemented a series of revisions to the rules for government guaranteed mortgages aimed at strengthening Canada’s housing finance system and ensuring the long-term stability of the Canadian housing market. These revisions were formalized in amendments to the Government Guarantee Agreement and are now reflected in regulations under PRMHIA.
If the Canadian government were to alter its policy in any manner adverse to us, including by managing its aggregate cap of CAD$300.0 billion on the outstanding principal amount of mortgages insured by private mortgage insurance providers in a manner that is detrimental to private mortgage insurance providers, altering the terms of or terminating its guarantee of the policies of private mortgage insurance providers, including those with Genworth Canada, or varying the treatment of private mortgage insurance in the capital rules, Genworth Canada could lose its ability to compete effectively with CMHC and could effectively be unable to write new business as a private mortgage insurer in Canada. This could have an adverse effect on our ability to offer mortgage insurance products in Canada and could adversely affect our financial condition and results of operations. For further discussion of the Government Guarantee Agreement, refer to “International Mortgage Insurance—Canada—Government Guarantee.”
APRA regulates all ADIs in Australia and life, general, and mortgage insurance companies. APRA also determines the minimum regulatory capital requirements for ADIs. APRA’s current regulations provide for reduced capital requirements for certain ADIs that insure residential mortgages with an “acceptable” mortgage insurer for all non-standard mortgages and for standard mortgages with loan-to-value ratios above 80%. APRA’s regulations currently set out a number of circumstances in which a loan may be considered to be non-standard from an ADI’s perspective. The capital levels for Australian internal ratings-based ADIs are determined by their APRA-approved internal ratings-based models, which may or may not allocate capital credit for LMI. We believe that APRA and the internal ratings-based ADIs have not yet finalized internal models for residential mortgage risk, so we do not believe that the internal ratings-based ADIs currently benefit from a reduction in their capital requirements for mortgages covered by mortgage insurance.
Under rules adopted by APRA effective January 1, 2008, in connection with the revisions to a set of regulatory rules and procedures governing global bank capital standards that were introduced by the Basel Committee of the Bank for International Settlements, ADIs in Australia that are accredited as standardized now receive a reduced capital incentive for using mortgage insurance for high loan-to-value mortgage loans when compared to previous regulations in Australia. ADIs that are considered to be advanced accredited and determine their own capital estimates, are currently working with the mortgage insurers and APRA to determine the appropriate level of incentive mortgage insurance provides for high loan-to-value mortgage loans. The rules also provide that ADIs would be able to acquire mortgage insurance covering less of the exposure to the loan than existing requirements with reduced capital incentives. Accordingly, lenders in Australia may be able to reduce their use of mortgage insurance for high loan-to-value ratio mortgages, or limit their use to the higher risk portions of their portfolios, which may have an adverse effect on our Australian mortgage insurance business.
In December 2010, the Australian government announced a series of banking reforms designed to promote greater competition in the Australian banking industry. One key aspect of the proposals involved boosting
75
consumer flexibility to transfer deposits and mortgages. In particular, the Australian government announced that it would consider instructing the Australian treasury department to accelerate the development of potential frameworks to transfer LMI policies between lenders and introduce a central registry for mortgages. Currently, LMI policies are not transportable between lenders and are issued to a particular lender in respect of a particular loan. The Australian government announced on August 21, 2011 that it did not intend to make LMI portable but rather to seek the introduction of a LMI Key Fact Sheet which lenders will be required to give to borrowers.
The LMI Key Fact sheet will be designed to help home buyers understand the costs and benefits of mortgage insurance when taking out a home loan. The final LMI Key Fact Sheet implementing regulations have not been promulgated by the Australian government. We are unaware of when, or if, the final regulations will be promulgated. Failure to implement final LMI Key Fact Sheet implementing regulations could lead to the Australian government considering other actions regarding portability. If changes relating to the portability of LMI policies were implemented, for whatever reason, this may impact the profitability, required capital and return on equity of our mortgage insurance business in Australia by potentially increasing the cost of underwriting and servicing LMI policies, increasing the time policies remain in force (resulting in capital being held against policies for a greater duration) and decreasing LMI volumes.
In December 2010, revisions to a set of regulatory rules and procedures governing global bank capital standards were introduced by the Basel Committee of the Bank for International Settlements to strengthen regulatory capital, liquidity and other requirements for banks, known as Basel III. Although we believe these revisions could support further use of mortgage insurance as a risk and capital management tool in international markets, their adoption by individual countries internationally and in the United States has not concluded and we cannot be sure that this will be the case. Since the Basel framework continues to evolve, we cannot predict the mortgage insurance benefits, if any, that ultimately will be provided to lenders, or how any such benefits may affect the opportunities for the growth of mortgage insurance. If countries implement Basel III in a manner that does not reward lenders for using mortgage insurance as a credit risk mitigant on high loan-to-value mortgage loans, or if lenders conclude that mortgage insurance does not provide sufficient capital incentives, then we may have to revise our product offerings to meet the new requirements and our results of operations may be adversely affected.
During 2010, APRA issued detailed proposals to revise the capital requirements for all insurers it regulates. Following receipt of feedback from the industry, including quantitative analyses from market participants, APRA published updated proposals in March and December 2011. In October 2012, APRA issued revised prudential and reporting standards that became effective on January 1, 2013. The new standards have not had a material change to the regulatory capital requirements for our business.
Our claims expenses and loss reserves in our U.S. mortgage insurance business have increased in recent periods and could continue to increase if the rate of defaults on mortgages covered by our mortgage insurance continues to increase, and in some cases we expect that paid claims and loss reserves will increase.
Since 2007, we experienced increases in paid claims and loss reserves as a result of a significant increase in delinquencies and foreclosures in certain of our books of business, particularly those of 2005, 2006, 2007 and 2008. This impact was evident in all products across all regions of the country and was particularly evident in our A minus, Alt-A, ARMs and certain 100% loan-to-value products in Florida, California, Arizona and Nevada. In addition, throughout the United States, we experienced an increase in the average loan balance of mortgage loans, including on delinquent loans, as well as a significant decline in home price appreciation in the majority of U.S. markets.
The foregoing factors have contributed to an increase in our incurred losses and loss reserves. While approximately 95% of our primary risk in-force in the United States as of December 31, 2013 is considered prime, based on FICO credit scores of the underlying mortgage loans, continued low or negative home prices, coupled with weakened economic conditions, may cause further increases in our incurred losses and related loss ratios. Our loss experience may increase as policies continue to age. If the claim frequency on the risk in-force
76
significantly exceeds the claim frequency that was assumed in setting premium rates, our financial condition, results of operations and cash flows would be adversely affected.
During 2011, 2012 and 2013, we experienced higher levels of paid claims and a decline in the level of loan modifications for borrowers of mortgage loans underlying our delinquency population. If the loan modification trend worsens in 2014 beyond our expectations, we would expect further aging of our delinquent loan inventory, which would pressure our loss reserves. Additionally, if elevated levels of unemployment or underemployment continue or increase in 2014, we would expect further increases in delinquencies and foreclosures to cause upward pressure on our paid claims and loss reserves. With respect to home prices, while housing inventory has demonstrated some improvement in recent months, the inventory of available homes generally remains elevated. The inventory of homes on the market may rise substantially as vacant properties migrate their way through the foreclosure process. As these homes eventually make their way through an already strained and unpredictable foreclosure cycle and potentially increase an elevated level of inventory of homes available for sale, we expect that home prices may be pressured downward in certain geographic areas depending upon the level and timing of this process. These conditions could result in an adverse impact on our financial condition and results of operations.
Our premium rates vary with the perceived risk of a claim on the insured loan, which takes into account factors such as the loan-to-value ratio, our long-term historical loss experience, whether the mortgage provides for fixed payments or variable payments, the term of the mortgage, the borrower’s credit history and the level of documentation and verification of the borrower’s income and assets. Our ability to properly determine eligibility and accurate pricing for the mortgage insurance we issue is dependent upon our underwriting and other operational routines. These underwriting routines may vary across the jurisdictions in which we do business. Deficiencies in actual practice in this area could have an adverse impact on our results. We establish renewal premium rates for the life of a mortgage insurance policy upon issuance, and we cannot cancel the policy or adjust the premiums after the policy is issued. As a result, we cannot offset the impact of unanticipated claims with premium increases on policies in-force, and we cannot refuse to renew mortgage insurance coverage. The premiums we agree to charge upon writing a mortgage insurance policy may not adequately compensate us for the risks and costs associated with the coverage we provide for the entire life of that policy.
Certain types of mortgages have higher probabilities of claims. These include Alt-A loans, loans with an initial Interest Only payment option and other non-traditional loans that we have insured in prior years, including A minus loans and 100% loan-to-value products. Alt-A loans are originated under programs in which there are a reduced level of verification or disclosure of the borrower’s income or assets and a higher historical and expected default rate at origination than standard documentation loans. Standard documentation loans include loans with reduced or different documentation requirements that meet specifications of GSE approved or other lender proprietary underwriting systems and other reduced documentation programs with historical and expected delinquency rates at origination consistent with our standard portfolio. The Interest Only payment option allows the borrower flexibility to pay interest only or pay interest and as much principal as desired, during an initial period of time. A minus loans generally are loans where the borrowers have FICO credit scores between 575 and 660, and where the borrower has a blemished credit history. A material portion of our Alt-A and Interest Only loans was written in 2005 through 2007. At the end of 2007, we began to adopt changes to our underwriting guidelines to substantially eliminate new insurance on these loans. However, the new guidelines only affect business written after those guidelines became effective. Business written before the effectiveness of those guidelines was insured in accordance with the guidelines in effect at time of the commitment, even though that business would not meet the new guidelines. We believe that Alt-A and Interest Only loans written prior to the adoption of the new guidelines may pose a higher risk of claims that would have an adverse impact on our operating results due to features such as deferred amortization of the loan principal on an Interest Only product and Interest Only loans that contain an adjustable interest rate feature and may reset to a rate above the existing rate. If defaults on Alt-A or Interest Only or other non-traditional loans are higher than the assumptions we made in pricing our mortgage insurance on those loans, then we would be required to make greater claims payments than we had projected, which could have an adverse effect on our financial condition and results of operations.
77
Our U.S. mortgage insurance subsidiaries are subject to minimum statutory capital requirements and hazardous financial condition standards which, if not met or waived, would result in restrictions or prohibitions on our doing business and could have an adverse impact on our results of operations.
The elevated levels of paid claims and increases in loss reserves have impacted the statutory capital base of our U.S. mortgage insurance subsidiaries. Sixteen states have insurance laws or regulations which require a mortgage insurer to maintain a minimum amount of statutory capital relative to its level of risk in-force. While formulations of minimum capital vary in certain states, the most common measure applied allows for a maximum permitted risk-to-capital ratio of 25:1. If one of our U.S. mortgage insurance subsidiaries that is writing business in a particular state fails to maintain that state’s required minimum capital level, we would generally be required to immediately stop writing new business in the state until the insurer re-establishes the required level of capital or receives a waiver of the requirement from the state’s insurance regulator, or until we establish an alternative source of underwriting capacity acceptable to the regulator. GEMICO, our primary U.S. mortgage insurance subsidiary, previously had exceeded the maximum risk-to-capital ratio of 25:1 established under North Carolina law and enforced by the North Carolina Department of Insurance (“NCDOI”), GEMICO’s domestic insurance regulator, but as of December 31, 2013, GEMICO’s risk-to-capital ratio was approximately 19.3:1 compared to 36.9:1 as of December 31, 2012. While it is our expectation that our U.S. mortgage insurance business will continue to meet its regulatory capital requirements, should GEMICO in the future exceed required risk-to-capital levels, we would seek required regulatory and GSE forbearance and approvals or seek approval for the utilization of alternative insurance vehicles. However, there can be no assurance if, and on what terms, such forbearance and approvals may be obtained.
GEMICO’s inability to meet its regulatory capital requirements in the future would not necessarily mean that GEMICO lacks sufficient resources to pay claims on its claim liabilities. While we believe GEMICO has sufficient claims-paying resources currently to meet its claims obligations on existing insurance in-force, we cannot provide assurance that this would always be the case. Furthermore, our estimates of claims-paying resources and claim obligations are based on various assumptions, which include the timing of the receipt of claims on loans in our delinquency inventory and future claims that we anticipate will ultimately be received, our anticipated loss mitigation activities, premiums, housing prices and unemployment rates. These assumptions are subject to inherent uncertainty and require judgment by management. Current conditions in the domestic economy make the assumptions about when anticipated claims will be received, housing values, and unemployment rates uncertain, such that there is a wide range of reasonably possible outcomes. Also, our U.S. mortgage insurance subsidiaries hold certain affiliate assets including, but not limited to, investments in Genworth Canada and the European mortgage insurance subsidiaries that are included in their reported statutory capital. The statutory reported value of these investments is subject to the operating performance of these affiliates as well as changes in foreign exchange rates and mark-to-market valuation on their investment portfolios. These exposures are not currently hedged and, hence, the statutory capital of our U.S. mortgage insurance subsidiaries and their statutory risk-to-capital ratio may fluctuate because of variances in future reported values.
In addition to the minimum statutory capital requirements, our U.S. mortgage insurance business is subject to standards by which insurance regulators in a particular state evaluate the financial condition of the insurer. Typically, regulators are required to evaluate specified criteria to determine whether or not a company may be found to be in hazardous financial condition, in which event restrictions on the business may be imposed. Among these criteria are formulas used in assessing trends relating to statutory capital. One or more of our U.S. mortgage insurance subsidiaries previously had from time to time failed to satisfy one or more of these standards for individual states. We typically meet or correspond with the appropriate regulator in such circumstances and, to date, no regulator has issued a determination that any of our U.S. mortgage insurance subsidiaries is in hazardous financial condition. Nevertheless, this evaluation of our U.S. mortgage insurers’ financial condition is ongoing and we presently provide various insurance regulators with substantial financial information for that purpose. We can provide no assurance as to whether or when a regulator may make a determination of hazardous financial condition and for which entity. Such a determination could likely lead to restrictions or prohibitions on our doing business in that state and could have a material adverse impact on results of operations depending on the number of states involved.
78
During 2012, the NAIC established the MGIWG to determine and make recommendations to the NAIC’s Financial Condition Committee as to what, if any, changes to make to the solvency and other regulations relating to mortgage guaranty insurers. In December 2013, the MGIWG published a draft of proposed amendments of the MGI Model and solicited comments on the proposed amendments. The proposed amendments of the MGI Model relate to, among other things: (i) capital and reserve standards, including increased minimum capital and surplus requirements, mortgage guaranty-specific risk-based capital standards, dividend restrictions and contingency and premium deficiency reserves; (ii) limitations on the geographic concentration of mortgage guaranty risk, including state-based limitations; (iii) restrictions on mortgage insurers’ investments in notes secured by mortgages; (iv) prudent underwriting standards and formal underwriting guidelines to be approved by the insurer’s board; (v) the establishment of formal, internal “Mortgage Guaranty Quality Control Programs” with respect to in-force business; (vi) prohibitions on reinsurance with bank captive reinsurers; and (vii) incorporation of an NAIC “Mortgage Guaranty Insurance Standards Manual.” At this time we cannot predict the outcome of this process, the effect changes, if any, will have on the mortgage guaranty insurance market generally, or on our businesses specifically, the additional costs associated with compliance with any such changes, or any changes to our operations that may be necessary to comply, any of which could have a material adverse effect on our business, results of operations, cash flows or financial condition. We also cannot predict whether other regulatory initiatives will be adopted or what impact, if any, such initiatives, if adopted as laws, may have on our business, financial condition or results of operations.
Fannie Mae, Freddie Mac and a small number of large mortgage lenders exert significant influence over the U.S. mortgage insurance market and changes to the role or structure of Freddie Mac or Fannie Mae could have an adverse impact on our U.S. mortgage insurance business.
Our U.S. mortgage insurance products protect mortgage lenders and investors from default-related losses on residential first mortgage loans made primarily to home buyers with high loan-to-value mortgages, generally, those home buyers who make down payments of less than 20% of their home’s purchase price. Fannie Mae and Freddie Mac purchased approximately 61%, 69% and 63% for the years ended December 31, 2013, 2012 and 2011, respectively, of all the mortgage loans originated in the United States, according to statistics published by Inside Mortgage Finance. We believe the mortgages purchased by Fannie Mae and Freddie Mac have increased the market size for flow private mortgage insurance during recent years. However, while Fannie Mae’s and Freddie Mac’s purchase activity increased in recent years, mortgage insurance penetration did not increase proportionately due to a combination of tighter mortgage insurance guidelines and the impact of GSE loan-level pricing on high loan-to-value loans. Changes by the GSEs in underwriting requirements or pricing terms on mortgage purchases could affect the market size for private mortgage insurance. Fannie Mae’s and Freddie Mac’s charters generally prohibit them from purchasing any mortgage with a face amount that exceeds 80% of the home’s value, unless that mortgage is insured by a qualified insurer or the mortgage seller retains at least a 10% participation in the loan or agrees to repurchase the loan in the event of default. As a result, high loan-to-value mortgages purchased by Fannie Mae or Freddie Mac generally are insured with private mortgage insurance. Fannie Mae and Freddie Mac independently establish eligibility standards for U.S. mortgage insurers. The provisions in Fannie Mae’s and Freddie Mac’s charters create much of the demand for private mortgage insurance in the United States. Fannie Mae and Freddie Mac are also subject to regulatory oversight by HUD and the FHFA. For the year ended December 31, 2013, Fannie Mae and Freddie Mac purchased the majority of the flow mortgage loans that we insured. Fannie Mae’s and Freddie Mac’s mortgage insurance requirements include specified insurance coverage levels and minimum financial strength ratings. Fannie Mae and Freddie Mac historically required maintenance of a rating by at least two out of three listed rating agencies (S&P, Fitch and Moody’s) of at least “AA-”/“Aa3” (as applicable), with no rating below those levels by any of the three listed rating agencies; otherwise, additional limitations or requirements may be imposed for eligibility to insure loans purchased by the GSEs. In February 2008, Fannie Mae and Freddie Mac temporarily suspended automatic imposition of the additional requirements otherwise applicable upon a ratings downgrade below the above-described requirements, subject to certain specified conditions and this suspension remains in effect. Currently, we do not meet these rating requirements and have remained in discussions with the GSEs. Any change in their
79
charter provisions or other statutes or regulations relating to their purchase or guarantee activity, as well as to the mortgage insurer eligibility standards, could have an adverse effect on our financial condition and results of operations.
Increasing consolidation among mortgage lenders, including the recent mergers in the U.S. banking industry, will continue to result in significant customer concentration for U.S. mortgage insurers. As a result of this significant concentration, Fannie Mae, Freddie Mac and the largest mortgage lenders possess substantial market power, which enables them to influence our business and the mortgage insurance industry in general. Although we actively monitor and develop our relationships with Fannie Mae, Freddie Mac and our largest mortgage lending customers, a deterioration in any of these relationships, or the loss of business from any of our key customers, could have an adverse effect on our financial condition and results of operations.
In addition, if the FHLBs reduce their purchases of mortgage loans, purchase uninsured mortgage loans or use other credit-enhancement products, this could have an adverse effect on our financial condition and results of operations.
In September 2008, the FHFA was appointed conservator of the GSEs. Congress has stated its intent to examine the role of the GSEs in the U.S. housing market, and the Obama administration has also stated that it is considering options regarding the future status of the GSEs. If legislation is enacted that reduces or eliminates the need for the GSEs to obtain credit enhancement on above 80% loan-to-value loans or that otherwise reduces or eliminates the role of the GSEs in single-family housing finance, the demand for private mortgage insurance in the United States could be significantly reduced. In February 2011, the Obama Administration issued a white paper setting forth various proposals to gradually eliminate Fannie Mae and Freddie Mac. Since that date, members of Congress, various housing experts and others within the industry have also published similar proposals. We cannot predict whether or when any proposals will be implemented, and if so in what form, nor can we predict the effect of such a proposal, if so implemented, would have on our business, results of operations or financial condition.
The GSEs are conducting a review of their eligibility standards for private mortgage insurers. If we are unable to meet these standards, we may not be eligible to write new insurance on loans sold to or guaranteed by the GSEs, which would have a material adverse effect on our business.
Private mortgage insurers must satisfy the MI Eligibility Standards. Each GSE’s Congressional charter generally prohibits it from purchasing or guaranteeing a mortgage where the loan-to-value ratio exceeds 80% of home value unless the portion of the unpaid principal balance of the mortgage, which is in excess of 80% of the value of the property securing the mortgage, is protected against default by lender recourse, participation or by a qualified insurer. In furtherance of their respective charter requirements, each GSE has adopted MI Eligibility Standards to establish when a mortgage insurer is qualified to issue coverage that will be acceptable to the respective GSE for purchase or guarantee of high loan-to-value mortgages.
The GSEs have the authority to implement new requirements at any time. Each GSE is currently considering changes to their respective MI Eligibility Standards and we expect that these changes will include establishment of risk-to-capital requirements that would replace the use of external credit ratings. For a discussion on the current external credit rating requirements maintained by the GSEs, see “—A downgrade or a potential downgrade in our financial strength or credit ratings could result in a loss of business and adversely affect our financial condition and results of operations.” We have not been informed of the revised capital requirements or their timeframes for effectiveness, but we believe they will be announced in the near term. For a discussion on state regulatory capital requirements, see “—Our U.S. mortgage insurance subsidiaries are subject to minimum statutory capital requirements and hazardous financial condition standards which, if not met or waived, would result in restrictions or prohibitions on our doing business and could have an adverse impact on our results of operations.”
80
In December 2013, Genworth Holdings issued $400 million of senior notes in anticipation of increased capital requirements expected to be imposed by the GSEs in connection with their revised MI Eligibility Standards. As of December 31, 2013, Genworth Financial contributed $100 million of the proceeds to GEMICO with an additional $300 million contributed to a U.S. mortgage holding company. The $100 million contribution in December 2013 to GEMICO, coupled with other performance-related actions, lowered GEMICO’s risk-to-capital ratio to approximately 19.3:1 as of December 31, 2013. We expect the $300 million contributed into our U.S. mortgage holding company will be further contributed to GEMICO, to the extent needed, for the benefit of its capital position after the changes to the asset and capital requirements in the revised GSE MI Eligibility Standards are finalized. In connection with this additional $300 million contribution to GEMICO, we will also evaluate the overall performance of our U.S. mortgage insurance business and conditions existing in the U.S. mortgage insurance industry at the time we decide to make the contribution. If the $300 million had been contributed to GEMICO, its risk-to-capital ratio as of December 31, 2013 would have been lower by approximately four points. In addition to the available funds held at the U.S. mortgage holding company, we have various alternatives available to us to manage GEMICO’s future capital position, including organic earnings growth; utilization of a portion of available deferred tax assets; possible reinsurance transactions; use of proceeds from the planned Australian IPO; issuance of convertible or exchangeable securities at the Genworth Financial and/or the Genworth Holdings levels; and other options that may be available.
Although we believe we could implement one or more of these alternatives so that we would continue to be an eligible mortgage insurer after the revised capital requirements are fully effective, there can be no assurance this will be the case. For the year ended December 31, 2013, Fannie Mae and Freddie Mac purchased the majority of the flow mortgage loans that we insure. If we are unable to meet existing or revised MI Eligibility Standards or determine not to or are unable to implement alternatives, we may not be eligible to write new insurance on loans sold to or guaranteed by the GSEs, which would have a material adverse effect on our business.
We cannot be sure of the extent of benefits we will realize from rescissions and curtailments in our U.S. mortgage insurance business in the future.
As part of our loss mitigation efforts, we routinely investigate insured loans and evaluate the related servicing to ensure compliance with applicable guidelines and to detect possible fraud or misrepresentation. As a result, we have, and may in the future, rescind coverage on loans that do not meet our guidelines or curtail the amount of claims payable for non-compliance. In the past, we recognized significant benefits from taking action on these investigations and evaluations under our master policy. While we believe these actions are valid and expect additional actions based on future investigations and evaluations, we can give no assurance on the extent to which we may continue to see such rescissions or curtailments. In addition, insured lenders may object to our actions and we continue to have discussions with certain of those lenders regarding their objections to our actions that in the aggregate are material. If disputed by the insured and a legal proceeding were instituted, the validity of our actions would be determined by arbitration or judicial proceedings unless otherwise settled. Further, our loss reserving methodology includes estimates of the number of loans in our delinquency inventory that will be rescinded or have their claims curtailed. A variance between ultimate action rates and these estimates could significantly affect our financial position and results of operations. In the near term, sales could be reduced or eliminated as a result of a dispute with one or more lenders and such disputes could have an adverse effect on our long-term relationships with those lenders that are impacted.
The extent to which loan modifications and other similar programs may provide benefits to our U.S. mortgage insurance business is uncertain.
The mortgage finance industry (with government support) has adopted various programs to modify loans to make them more affordable to borrowers with the goal of reducing the number of foreclosures. The effect on us of a loan modification depends on re-default rates, which in turn can be affected by factors such as changes in housing values and unemployment. We cannot predict what the actual volume of loan modifications will be or
81
the ultimate re-default rate, and therefore, we cannot be certain whether these programs will provide material benefits to us. Our estimates of the number of loans qualifying for modification programs are inherently uncertain. Although a moratorium does not affect the accrual of interest and other expenses on a loan, our master insurance policies contain covenants that require cooperation and loss mitigation by insured lenders. Unless a loan is modified during a moratorium to cure the default, at the expiration of the moratorium additional interest and expenses would be due which could result in our losses on loans subject to the moratorium being higher than if there had been no moratorium.
A deterioration in economic conditions or a decline in home prices in the United States may adversely affect our loss experience in mortgage insurance.
Losses in our U.S. mortgage insurance business generally result from events, such as reduction of income, unemployment, underemployment, divorce, illness and inability to manage credit and interest rate levels that reduce a borrower’s ability to continue to make mortgage payments. The amount of the loss we suffer, if any, depends in part on whether the home of a borrower who defaults on a mortgage can be sold for an amount that will cover unpaid principal and interest and the expenses of the sale. A deterioration in economic conditions generally increases the likelihood that borrowers will not have sufficient income to pay their mortgages and can also adversely affect housing values, which increases our risk of loss. A decline in home prices, whether or not in conjunction with deteriorating economic conditions, may also increase our risk of loss.
In recent periods, the United States experienced an economic slowdown and saw a pronounced weakness in its housing markets, as well as declines in home prices. This slowdown and the resulting impact on the housing markets are reflected in our elevated level of delinquencies. However, there has been a lag in the rate at which delinquent loans are going to foreclosure due to various local and lender foreclosure moratoria as well as servicer and court-related backlog issues. As these loans eventually go to foreclosure, our delinquency counts will be reduced and our paid claims will increase accordingly. In addition, ongoing delays in foreclosure processes could cause our losses to increase as expenses accrue for longer periods or if the value of foreclosed homes further decline during such delays. If we experience an increase in delinquencies that is higher than expected, our financial condition and results of operations could be adversely affected.
Problems associated with foreclosure process defects in the United States may cause claim payments to be deferred to later periods.
In the United States, some large mortgage lenders and servicers voluntarily suspended foreclosure actions in response to reports that certain mortgage servicers and other parties may have acted improperly in foreclosure proceedings. Where this occurred, we will evaluate our options under the applicable master policies to curtail interest and expense payments that could have been avoided absent a delay in the foreclosure action. While delays in foreclosure completion may temporarily delay the receipt of claims and increase the length of time a loan remains in our delinquent inventory, our estimated claim rates and claim amounts represent our best estimate of what we actually expect to pay on the loans in default as of the reserve date.
We compete with government-owned and government-sponsored enterprises in our U.S. mortgage insurance business, and this may put us at a competitive disadvantage on pricing and other terms and conditions.
Our U.S. mortgage insurance business competes with government-owned and government-sponsored enterprises, including the FHA and, to a lesser degree, the VA, Fannie Mae and Freddie Mac, as well as local and state housing finance agencies. Since 2008, there has been a significant increase in the number of loans insured by the FHA.
Those competitors may establish pricing terms and business practices that may be influenced by motives such as advancing social housing policy or stabilizing the mortgage lending industry, which may not be consistent with maximizing return on capital or other profitability measures. In addition, those governmental enterprises typically do not have the same capital requirements that we and other mortgage insurance companies
82
have and therefore may have financial flexibility in their pricing and capacity that could put us at a competitive disadvantage. In the event that a government-owned or sponsored entity in one of our markets determines to change prices significantly or alter the terms and conditions of its mortgage insurance or other credit enhancement products in furtherance of social or other goals rather than a profit or risk management motive, we may be unable to compete in that market effectively, which could have an adverse effect on our financial condition and results of operations.
Changes in regulations that affect the U.S. mortgage insurance business could affect our operations significantly and could reduce the demand for mortgage insurance.
In addition to the general regulatory risks that are described above under “—Our insurance businesses are heavily regulated and changes in regulation may reduce our profitability and limit our growth” and under “—The Dodd-Frank Wall Street Reform and Consumer Protection Act subjects us to additional federal regulation, and we cannot predict the effect of such regulation on our business, results of operations, cash flows or financial condition,” we are also affected by various additional regulations relating particularly to our U.S. mortgage insurance operations.
U.S. federal and state regulations affect the scope of our competitors’ operations, which has an effect on the size of the mortgage insurance market and the intensity of the competition in our U.S. mortgage insurance business. This competition includes not only other private mortgage insurers, but also U.S. federal and state governmental and quasi-governmental agencies, principally the FHA, and to a lesser degree, the VA, which are governed by federal regulations. Increases in the maximum loan amount that the FHA can insure, and reductions in the mortgage insurance premiums the FHA charges, can reduce the demand for private mortgage insurance. Decreases in the maximum loan amounts the GSEs will purchase or guarantee, increases in GSE fees, or decreases in the maximum loan-to-value ratio for loans the GSEs will purchase can also reduce demand for private mortgage insurance. Legislative and regulatory changes could cause demand for private mortgage insurance to decrease.
If countries implement revisions to bank capital requirements pursuant to Basel III rules in their proposed form, the rules could discourage the use of mortgage insurance in the United States. If countries implement Basel III rules in a manner that does not reward lenders for using mortgage insurance as a credit risk mitigant on high loan-to-value mortgage loans, or if lenders conclude that mortgage insurance does not provide sufficient capital incentives, then we may have to revise our product offerings to meet the new requirements and our results of operations may be adversely affected. The heightened prudential standards for large bank holding companies and systemically significant financial companies that were proposed by the Federal Reserve Board in December 2011 may also increase the usefulness of mortgage insurance if insurance of that kind is treated as reducing counterparty credit exposure. However, if mortgage insurance is used in that way, it will create a new counterparty credit exposure to the issuer of the insurance, which could limit any usefulness it may otherwise have.
Our U.S. mortgage insurance business, as a credit enhancement provider in the residential mortgage lending industry, is also subject to compliance with various federal and state consumer protection and insurance laws, including RESPA, the ECOA, the FHA, the Homeowners Protection Act, the FCRA, the Fair Debt Collection Practices Act and others. Among other things, these laws prohibit payments for referrals of settlement service business, providing services to lenders for no or reduced fees or payments for services not actually performed, require fairness and non-discrimination in granting or facilitating the granting of credit, require cancellation of insurance and refund of unearned premiums under certain circumstances, govern the circumstances under which companies may obtain and use consumer credit information, and define the manner in which companies may pursue collection activities. Changes in these laws or regulations could adversely affect the operations and profitability of our U.S. mortgage insurance business.
83
A decrease in the volume of high loan-to-value home mortgage originations or an increase in the volume of mortgage insurance cancellations in the United States could result in a decline in our revenue.
We provide mortgage insurance primarily for high loan-to-value mortgages. Factors that could lead to a decrease in the volume of high loan-to-value mortgage originations include, but are not limited to:
| • | a change in the level of home mortgage interest rates and a reduction or loss of mortgage interest deductibility for federal income tax purposes; |
| • | a decline in economic conditions generally, or in conditions in regional and local economies; |
| • | the level of consumer confidence, which may be adversely affected by economic instability, war or terrorist events; |
| • | declines in the price of homes; |
| • | adverse population trends, including lower homeownership rates; |
| • | high rates of home price appreciation, which for refinancings affect whether refinanced loans have loan-to-value ratios that require mortgage insurance; and |
| • | changes in government housing policy encouraging loans to first-time home buyers. |
Many of these factors have emerged in the current economic downturn. A decline in the volume of high loan-to-value mortgage originations would reduce the demand for mortgage insurance and, therefore, could have an adverse effect on our financial condition and results of operations.
In addition, a significant percentage of the premiums we earn each year in our U.S. mortgage insurance business are renewal premiums from insurance policies written in previous years. We estimate that approximately 87%, 91% and 95%, respectively, of our U.S. gross premiums earned in each of the years ended December 31, 2013, 2012 and 2011 were renewal premiums. As a result, the length of time insurance remains in-force is an important determinant of our mortgage insurance revenues. Fannie Mae, Freddie Mac and many other mortgage investors in the United States generally permit a homeowner to ask his loan servicer to cancel his mortgage insurance when the principal amount of the mortgage falls below 80% of the home’s value. Factors that tend to reduce the length of time our mortgage insurance remains in-force include:
| • | declining interest rates, which may result in the refinancing of the mortgages underlying our insurance policies with new mortgage loans that may not require mortgage insurance or that we do not insure; |
| • | significant appreciation in the value of homes, which causes the size of the mortgage to decrease below 80% of the value of the home and enables the borrower to request cancellation of the mortgage insurance; and |
| • | changes in mortgage insurance cancellation requirements under applicable federal law or mortgage insurance cancellation practices by mortgage lenders and investors. |
Our U.S. policy persistency rates increased from 46% for the year ended December 31, 2003 to elevated levels of 85%, 81% and 81% for the years ended December 31, 2011, 2012 and 2013, respectively. A decrease in persistency in the U.S. market generally would reduce the amount of our insurance in-force and could have an adverse effect on our financial condition and results of operations. However, higher persistency on certain products, especially A minus, Alt-A, ARMs and certain 100% loan-to-value loans, could have an adverse effect if claims generated by such products remain elevated or increase.
84
The amount of mortgage insurance we write in the United States could decline significantly if alternatives to private mortgage insurance are used or lower coverage levels of mortgage insurance are selected.
There are a variety of alternatives to private mortgage insurance that may reduce the amount of mortgage insurance we write in the United States. These alternatives include:
| • | originating mortgages that consist of two simultaneous loans, known as “simultaneous seconds,” comprising a first mortgage with a loan-to-value ratio of 80% and a simultaneous second mortgage for the excess portion of the loan, instead of a single mortgage with a loan-to-value ratio of more than 80%; |
| • | using government mortgage insurance programs, including those of the FHA and the VA; |
| • | holding mortgages in the lenders’ own loan portfolios and self-insuring; |
| • | using programs, such as those offered by Fannie Mae and Freddie Mac, requiring lower mortgage insurance coverage levels; |
| • | originating and securitizing loans in mortgage-backed securities whose underlying mortgages are not insured with private mortgage insurance or which are structured so that the risk of default lies with the investor, rather than a private mortgage insurer; and |
| • | using credit default swaps or similar instruments, instead of private mortgage insurance, to transfer credit risk on mortgages. |
A decline in the use of private mortgage insurance in connection with high loan-to-value home mortgages for any reason would reduce the demand for flow mortgage insurance.
We cede a portion of our U.S. mortgage insurance business to mortgage reinsurance companies affiliated with our mortgage lending customers, and this could reduce our profitability.
We, like other mortgage insurers, offer opportunities to our mortgage lending customers that are designed to allow them to participate in the risks and rewards of the mortgage insurance business. Many of the major mortgage lenders with which we do business have established captive mortgage reinsurance subsidiaries. These reinsurance subsidiaries assume a portion of the risks associated with the lender’s insured mortgage loans in exchange for a percentage of the premiums. In most cases, our reinsurance coverage is an “excess of loss” arrangement with a limited band of exposure for the reinsurer. This means that we are required to pay the first layer of losses arising from defaults in the covered mortgages, the reinsurer indemnifies us for the next layer of losses, and we pay any losses in excess of the reinsurer’s obligations. The effect of these arrangements historically has been a reduction in the profitability and return on capital of this business to us. We advised each captive reinsurer with whom we do business under an excess of loss arrangement that effective January 1, 2009 we will reinsure only on a quota share basis. For the years ended December 31, 2013 and 2012, approximately 1% and 2%, respectively, of our U.S. primary new risk written was subject to captive mortgage reinsurance. U.S. mortgage insurance premiums ceded to these reinsurers were $22 million, $52 million and $93 million for the years ended December 31, 2013, 2012 and 2011, respectively. U.S. mortgage insurance loss reserves ceded to these reinsurers were $44 million, $80 million and $178 million for the years ended December 31, 2013, 2012 and 2011, respectively. These arrangements can either favorably or unfavorably affect our profitability within a given calendar year depending upon whether or not the reinsurer’s layer of coverage is attaching and whether or not there are sufficient assets in the captive trust available for payment of claims, thereby covering some portion of losses.
Given the recent business changes to captive reinsurance arrangements, at the end of 2008, the majority of our excess of loss captive reinsurance arrangements was in runoff with no new books of business expected to be added going forward. Additionally, throughout 2009, many lender captive reinsurers have chosen to place their captives into runoff as well. Nonetheless, we will continue to benefit from captive reinsurance on our 2005 through 2008 books of business, although to a lesser extent than in prior periods.
85
Potential liabilities in connection with our U.S. contract underwriting services could have an adverse effect on our financial condition and results of operations.
We offer contract underwriting services to certain of our mortgage lenders in the United States, pursuant to which our employees and contractors work directly with the lender to determine whether the data relating to a borrower and a proposed loan contained in a mortgage loan application file complies with the lender’s loan underwriting guidelines or the investor’s loan purchase requirements. In connection with that service, we also compile the application data and submit it to the automated underwriting systems of Fannie Mae and Freddie Mac, which independently analyze the data to determine if the proposed loan complies with their investor requirements.
Under the terms of our contract underwriting agreements, we agree to indemnify the lender against losses incurred in the event that we make material errors in determining whether loans processed by our contract underwriters meet specified underwriting or purchase criteria, subject to contractual limitations on liability. As a result, we assume credit and interest rate risk in connection with our contract underwriting services. Worsening economic conditions, a deterioration in the quality of our underwriting services or other factors have caused and could further cause our contract underwriting liabilities to increase and have an adverse effect on our financial condition and results of operations. Although we have established reserves to provide for potential claims in connection with our contract underwriting services, we have limited historical experience that we can use to establish reserves for these potential liabilities, and these reserves may not be adequate to cover liabilities that may arise.
Other Risks
We may not realize the anticipated benefits of our expense reduction plan, and we may lose key personnel related to actions like this as well as general uncertainty in the timing of our turnaround.
On June 6, 2013, we announced an expense reduction plan which eliminated approximately 400 positions, including 150 open positions that will not be filled, and will reduce related information technology and program spending to improve the operating performance of our businesses. When fully implemented, we expect to realize approximately $80 million to $90 million in annual pre-tax expense savings primarily related to these actions. We recorded a pre-tax non-operating charge of $20 million in the second quarter of 2013 reflecting severance, outplacement and other costs associated with the expense reduction plan. We cannot provide assurance that the anticipated expense reduction will be achieved in full. In addition, we may lose key personnel due to uncertainty in our turnaround and related actions such as the expense reduction plan.
Adverse market or other conditions might further delay or impede the planned IPO of our mortgage insurance business in Australia.
On November 3, 2011, we announced our plan to sell up to 40% of our Australian mortgage insurance business through an IPO during 2012. On April 17, 2012, we announced a new timeframe for completing the planned Australian IPO of early 2013 and in November 2012 updated this to the fourth quarter of 2013 or later. The execution of the Australian IPO is a strategic priority for 2014, but execution is subject to market conditions, valuation considerations, including business performance, and regulatory considerations. There can be no assurance that the Australian IPO can be executed during 2014, on the desired terms, or at all.
The information in this Annual Report concerning the Australian IPO securities is not an offer to sell, or a solicitation of an offer to buy, any securities. The Australian IPO securities referred to in this Annual Report have not been and will not be registered under the U.S. Securities Act of 1933 and may not be offered or sold in the United States except pursuant to an exemption from, or in a transaction not subject to, the registration requirements of the U.S. Securities Act of 1933. If an offer of Australian IPO securities which requires disclosure in Australia is made, a disclosure document for the offer will be prepared at that time. Any person who wishes to apply to acquire Australian IPO securities will need to complete the application form that will be in or will
86
accompany the disclosure document. In addition, the information in this Annual Report concerning the Australian IPO securities is not intended for public distribution in Australia.
We have agreed to make payments to GE based on the projected amounts of certain tax savings we expect to realize as a result of our IPO. We will remain obligated to make these payments even if we do not realize the related tax savings and the payments could be accelerated in the event of certain changes in control.
Under the Tax Matters Agreement, we have an obligation to pay GE a fixed amount over approximately the next 10 years. This fixed obligation, the estimated present value of which was $245 million and $279 million as of December 31, 2013 and 2012, respectively, equals 80% (subject to a cumulative $640 million maximum amount) of the tax savings projected as a result of our IPO in 2004. Even if we fail to generate sufficient taxable income to realize the projected tax savings, we will remain obligated to pay GE, and this could have a material adverse effect on our financial condition and results of operations. We could also, subject to regulatory approval, be required to pay GE on an accelerated basis in the event of certain changes in control of our company.
Provisions of our certificate of incorporation and bylaws and our Tax Matters Agreement with GE may discourage takeover attempts and business combinations that stockholders might consider in their best interests.
Our certificate of incorporation and bylaws include provisions that may have anti-takeover effects and may delay, deter or prevent a takeover attempt that our stockholders might consider in their best interests. For example, our certificate of incorporation and bylaws:
| • | permit our Board of Directors to issue one or more series of preferred stock; |
| • | limit the ability of stockholders to remove directors; |
| • | limit the ability of stockholders to fill vacancies on our Board of Directors; |
| • | limit the ability of stockholders to call special meetings of stockholders and take action by written consent; and |
| • | impose advance notice requirements for stockholder proposals and nominations of directors to be considered at stockholder meetings. |
Under our Tax Matters Agreement with GE, if any person or group of persons other than GE or its affiliates gains the power to direct the management and policies of our company, we could become obligated immediately to pay to GE the total present value of all remaining tax benefit payments due to GE over the full term of the agreement. The estimated present value of our fixed obligation as of December 31, 2013 and 2012 was $245 million and $279 million, respectively. Similarly, if any person or group of persons other than us or our affiliates gains effective control of one of our subsidiaries, we could become obligated to pay to GE the total present value of all such payments due to GE allocable to that subsidiary, unless the subsidiary assumes the obligation to pay these future amounts under the Tax Matters Agreement and certain conditions are met. The acceleration of payments would be subject to the approval of certain state insurance regulators, and we are obligated to use our reasonable best efforts to seek these approvals. This feature of the agreement could adversely affect a potential merger or sale of our company. It could also limit our flexibility to dispose of one or more of our subsidiaries, with adverse implications for any business strategy dependent on such dispositions.
Risks Relating to Our Common Stock
The Board of Directors has decided to suspend dividends on our common stock until further notice.
We paid quarterly dividends on our common stock from our IPO in May 2004 until November 2008 when the Board of Directors decided to suspend the payment of dividends on our common stock to enhance our liquidity and capital position as a result of the global financial crisis and the challenging economic environment. We cannot assure you when, whether or at what level we will resume paying dividends on our common stock.
87
Our stock price will fluctuate.
Stock markets in general, and our common stock in particular, have experienced significant price and volume volatility since late 2008. The market price and volume of our common stock may continue to be subject to significant fluctuations due not only to general stock market conditions but also to a change in sentiment in the market regarding our industry generally, as well as investor concern about some of our product lines, including but not limited to mortgage and long-term care insurance, our operations, business prospects, liquidity and capital positions. In addition to the risk factors discussed above, the price and volume volatility of our common stock may be affected by, among other issues:
| • | our financial performance and condition and future prospects; |
| • | operating results that vary from the expectations of securities analysts and investors; |
| • | operating and securities price performance of companies that investors consider to be comparable to us; |
| • | announcements of strategic developments, acquisitions and other material events by us or our competitors; |
| • | changes in global financial markets and global economies and general market conditions; |
| • | rating agency announcements or actions with respect to the ratings of our company and our subsidiaries; |
| • | changes in laws and regulations affecting our business; and |
| • | market prices for our equity securities. |
Stock price volatility and a decrease in our stock price could make it difficult for us to raise equity capital or, if we are able to raise equity capital, could result in substantial dilution to our existing stockholders.
| Item 1B. | Unresolved Staff Comments |
We have no unresolved comments from the staff of the SEC.
| Item 2. | Properties |
We own our headquarters facility in Richmond, Virginia, which consists of approximately 461,190 square feet in four buildings, as well as several facilities in Lynchburg, Virginia with approximately 450,360 square feet. In addition, we lease approximately 273,508 square feet of office space in 15 locations throughout the United States. We also own two buildings outside the United States with approximately 108,260 square feet, and we lease approximately 338,340 square feet in 48 locations outside the United States.
Most of our leases in the United States and other countries have lease terms of three to five years. Although some leases have longer terms, no lease has an expiration date beyond 2022. Our aggregate annual rental expense under all leases was $24 million during the year ended December 31, 2013.
We believe our properties are adequate for our business as presently conducted.
| Item 3. | Legal Proceedings |
We face the risk of litigation and regulatory investigations and actions in the ordinary course of operating our businesses, including the risk of class action lawsuits. Our pending legal and regulatory actions include proceedings specific to us and others generally applicable to business practices in the industries in which we operate. In our insurance operations, we are, have been, or may become subject to class actions and individual
88
suits alleging, among other things, issues relating to sales or underwriting practices, increases to in-force long-term care insurance premiums, payment of contingent or other sales commissions, claims payments and procedures, product design, product disclosure, administration, additional premium charges for premiums paid on a periodic basis, denial or delay of benefits, charging excessive or impermissible fees on products, recommending unsuitable products to customers, our pricing structures and business practices in our mortgage insurance businesses, such as captive reinsurance arrangements with lenders and contract underwriting services, violations of RESPA or related state anti-inducement laws, and mortgage insurance policy rescissions and curtailments, and breaching fiduciary or other duties to customers, including but not limited to breach of customer information. Plaintiffs in class action and other lawsuits against us may seek very large or indeterminate amounts which may remain unknown for substantial periods of time. In our investment-related operations, we are subject to litigation involving commercial disputes with counterparties. We are also subject to litigation arising out of our general business activities such as our contractual and employment relationships. In addition, we are also subject to various regulatory inquiries, such as information requests, subpoenas, books and record examinations and market conduct and financial examinations from state, federal and international regulators and other authorities. A substantial legal liability or a significant regulatory action against us could have an adverse effect on our business, financial condition and results of operations. Moreover, even if we ultimately prevail in the litigation, regulatory action or investigation, we could suffer significant reputational harm, which could have an adverse effect on our business, financial condition or results of operations.
In early 2006 as part of an industry-wide review, one of our U.S. mortgage insurance subsidiaries received an administrative subpoena from the Minnesota Department of Commerce, which has jurisdiction over insurance matters, with respect to our reinsurance arrangements, including captive reinsurance transactions with lender-affiliated reinsurers. Since 2006, the Minnesota Department of Commerce has periodically requested additional information. We are engaged in discussions with the Minnesota Department of Commerce to resolve the review and we will continue to cooperate as appropriate with respect to any follow-up requests or inquiries. Inquiries from other regulatory bodies with respect to the same subject matter have been resolved or dormant for a number of years.
Beginning in December 2011 and continuing through January 2013, one of our U.S. mortgage insurance subsidiaries was named along with several other mortgage insurance participants and mortgage lenders as a defendant in twelve putative class action lawsuits alleging that certain “captive reinsurance arrangements” were in violation of RESPA. Those cases are captioned as follows: Samp, et al. v. JPMorgan Chase Bank, N.A., et al., United States District Court for the Central District of California; White, et al., v. The PNC Financial Services Group, Inc., et al., United States District Court for the Eastern District of Pennsylvania; Menichino, et al. v. Citibank NA, et al., United States District Court for the Western District of Pennsylvania; McCarn, et al. v. HSBC USA, Inc., et al., United States District Court for the Eastern District of California; Manners, et al., v. Fifth Third Bank, et al., United States District court for the Western District of Pennsylvania; Riddle, et al. v. Bank of America Corporation, et al., United States District Court for the Eastern District of Pennsylvania; Rulison et al. v. ABN AMRO Mortgage Group, Inc. et al., United States District Court for the Southern District of New York; Barlee, et al. v. First Horizon National Corporation, et al., United States District Court for the Eastern District of Pennsylvania; Cunningham, et al. v. M&T Bank Corp., et al., United States District Court for the Middle District of Pennsylvania; Orange, et al. v. Wachovia Bank, N.A., et al., United States District Court for the Central District of California; Hill et al. v. Flagstar Bank, FSB, et al., United States District Court for the Eastern District of Pennsylvania; and Moriba BA, et al. v. HSBC USA, Inc., et al., United States District Court for the Eastern District of Pennsylvania. Plaintiffs allege that “captive reinsurance arrangements” with providers of private mortgage insurance whereby a mortgage lender through captive reinsurance arrangements received a portion of the borrowers’ private mortgage insurance premiums were in violation of RESPA and unjustly enriched the defendants for which plaintiffs seek declaratory relief and unspecified monetary damages, including restitution. The McCarn case was dismissed by the Court with prejudice as to our subsidiary and certain other defendants on November 9, 2012. On July 3, 2012, the Rulison case was voluntarily dismissed by the plaintiffs. The Barlee case was dismissed by the Court with prejudice as to our subsidiary and certain other defendants on February 27, 2013. The Manners case was dismissed by voluntary stipulation in March 2013. In early May, 2013, the Samp
89
and Orange cases were dismissed with prejudice as to our subsidiary. Plaintiffs appealed both of those dismissals, but have since withdrawn those appeals. The White case was dismissed by the court without prejudice on June 20, 2013, and on July 5, 2013 plaintiffs filed a second amended complaint again naming our U.S. mortgage insurance subsidiary as a defendant. On July 22, 2013, we moved to dismiss the second amended complaint. In the Riddle, Hill, Ba and Cunningham cases, the defendants’ motions to dismiss were denied, but the Court in the Riddle, Hill and Cunningham cases limited discovery at this stage to issues surrounding whether the case should be dismissed on statute of limitations grounds. In the Hill case, on December 17, 2013 we moved for summary judgment dismissing the complaint. In the Riddle case, in late November, 2013, the Court granted our motion for summary judgment dismissing the case. Plaintiffs have appealed that dismissal. The Menichino case was dismissed by the court without prejudice as to our subsidiary and certain other defendants on July 19, 2013. Plaintiffs filed a second amended complaint again naming our U.S. mortgage insurance subsidiary as a defendant and we moved to dismiss the second amended complaint. We intend to vigorously defend the remaining actions.
In December 2009, one of our non-insurance subsidiaries, one of the subsidiary’s officers and Genworth Financial, Inc. were named in a putative class action lawsuit captioned Michael J. Goodman and Linda Brown v. Genworth Financial Wealth Management, Inc., et al., in the United States District Court for the Eastern District of New York. Plaintiffs allege securities law and other violations involving the selection of mutual funds by our subsidiary on behalf of certain of its Private Client Group clients. The lawsuit seeks unspecified monetary damages and other relief. In response to our motion to dismiss the complaint in its entirety, the Court granted the motion to dismiss the state law fiduciary duty claim and denied the motion to dismiss the remaining federal claims. Oral argument on plaintiffs’ motion to certify a class was conducted on January 30, 2013, but the Court has not yet issued a decision. We will continue to vigorously defend this action.
As previously disclosed, in April 2012, two of our U.S. mortgage insurance subsidiaries were named as respondents in two arbitrations, one brought by Bank of America, N.A. and one brought by Countrywide Home Loans, Inc. and Bank of America, N.A. as claimants. Claimants alleged breach of contract and breach of the covenant of good faith and fair dealing and sought in excess of $834 million of damages, as well as interest, punitive damages and a declaratory judgment relating to our denial, curtailment and rescission of mortgage insurance coverage. Subject to GSE approval, we reached an agreement on December 31, 2013 to resolve a portion of both arbitrations with respect to rescission practices. Under the agreement, Genworth, Bank of America, N.A and Countrywide Home Loans, Inc. have agreed to a fixed number of loans for which Genworth will reinstate mortgage insurance coverage representing a portion of the loans with rescinded coverage. Going forward, as to the loans insured by Genworth that are the subject of the agreement, including those loans that were the subject of the arbitrations, Genworth has agreed to cease all future rescission activity and pay a percentage of the claim amount otherwise payable, with no obligation for the remaining percentage. Genworth’s net economic impact of the terms of settlement fall within its previously established reserve amounts for reinstatements and had no income statement impact in the fourth quarter of 2013. The agreement resolves substantially all outstanding claims related to the rescissions of coverage on loans originated or acquired by Bank of America, N.A and Countrywide Home Loans, Inc. prior to 2009. Genworth believes that the rescission settlement resolves approximately $800 million of alleged damages and that claimants’ remaining demand is in excess of $150 million relating to curtailment and denial practices; however, we are unable to estimate the precise remaining disputed amount, in part because we continue to curtail claims, and claimants’ demand includes unspecified punitive damages. In addition to GSE approval, consummation of the settlement is also conditioned upon the parties’ prior negotiation and execution of a definitive agreement requiring submission of curtailment and denial disputes to a binding alternative dispute proceeding (“Curtailment ADR Agreement”). Either party may terminate the agreement if the definitive Curtailment ADR Agreement is not executed by March 31, 2014. The parties continue to negotiate the terms of a Curtailment ADR Agreement. Genworth plans to continue to vigorously defend its practices.
At this time, we cannot determine or predict the ultimate outcome of any of the pending legal and regulatory matters specifically identified above or the likelihood of potential future legal and regulatory matters against us.
90
We also are not able to provide an estimate or range of possible losses related to these matters. Therefore, we cannot ensure that the current investigations and proceedings will not have a material adverse effect on our business, financial condition or results of operations. In addition, it is possible that related investigations and proceedings may be commenced in the future, and we could become subject to additional unrelated investigations and lawsuits. Increased regulatory scrutiny and any resulting investigations or proceedings could result in new legal precedents and industry-wide regulations or practices that could adversely affect our business, financial condition and results of operations.
| Item 4. | Mine Safety Disclosures |
Not applicable.
91
| Item 5. | Market for Registrant’s Common Equity, Related Stockholder Matters and Issuer Purchases of Equity Securities |
Market for Common Stock
Our Class A Common Stock is listed on the New York Stock Exchange under the symbol “GNW.” The following table sets forth the high and low intra-day sales prices per share of our Class A Common Stock, as reported by the New York Stock Exchange, for the periods indicated:
| 2013 |
High | Low | ||||||
| First Quarter |
$ | 10.74 | $ | 7.66 | ||||
| Second Quarter |
$ | 11.48 | $ | 8.98 | ||||
| Third Quarter |
$ | 13.79 | $ | 11.48 | ||||
| Fourth Quarter |
$ | 15.78 | $ | 12.48 | ||||
| 2012 |
High | Low | ||||||
| First Quarter |
$ | 9.68 | $ | 6.57 | ||||
| Second Quarter |
$ | 8.46 | $ | 4.80 | ||||
| Third Quarter |
$ | 6.15 | $ | 4.06 | ||||
| Fourth Quarter |
$ | 7.53 | $ | 5.07 | ||||
As of February 12, 2014, we had 290 holders of record of our Class A Common Stock.
92
Common Stock Performance Graph
The following performance graph and related information shall not be deemed “soliciting material” nor to be “filed” with the SEC, nor shall such information be incorporated by reference into any future filings under the Securities Act of 1933 or the Securities Exchange Act of 1934, each as amended, except to the extent we specifically incorporate it by reference into such filing.
The following graph compares the cumulative total stockholder return on our Class A Common Stock with the cumulative total stockholder return on the S&P 500 Insurance Index and the S&P 500 Stock Index.
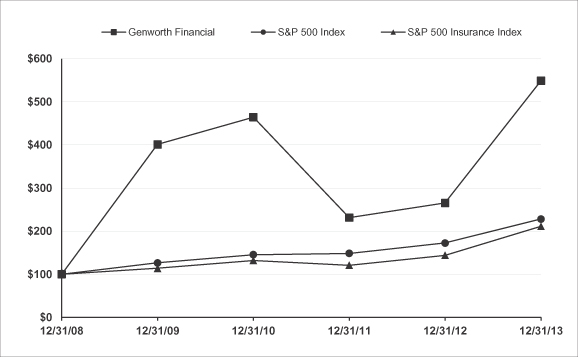
| 2008 | 2009 | 2010 | 2011 | 2012 | 2013 | |||||||||||||||||||
| Genworth Financial, Inc. |
$ | 100.00 | $ | 401.06 | $ | 464.31 | $ | 231.45 | $ | 265.37 | $ | 548.76 | ||||||||||||
| S&P 500 Insurance Index |
$ | 100.00 | $ | 113.90 | $ | 131.89 | $ | 120.97 | $ | 144.07 | $ | 211.36 | ||||||||||||
| S&P 500® |
$ | 100.00 | $ | 126.46 | $ | 145.51 | $ | 148.59 | $ | 172.37 | $ | 228.19 | ||||||||||||
Dividends
In November 2008, to enhance our liquidity and capital position in the challenging market environment, our Board of Directors suspended the payment of dividends on our common stock indefinitely. The declaration and payment of future dividends to holders of our common stock will be at the discretion of our Board of Directors and will depend on many factors including our receipt of dividends from our operating subsidiaries, our financial condition and net income, the capital requirements of our subsidiaries, legal requirements, regulatory constraints, our credit and financial strength ratings and such other factors as the Board of Directors deems relevant. We cannot assure you when, whether or at what level we will resume paying dividends on our common stock.
See “Item 7—Management’s Discussion and Analysis of Financial Condition and Results of Operations” for additional information.
We act as a holding company for our subsidiaries and do not have any significant operations of our own. As a result, our ability to pay dividends in the future will depend on receiving dividends from our subsidiaries. Our insurance subsidiaries are subject to the laws of the jurisdictions in which they are domiciled and licensed and consequently are limited in the amount of dividends that they can pay. See “Part I—Item 1—Business—Regulation.”
93
| Item 6. | Selected Financial Data |
The following table sets forth selected financial information. The selected financial information as of December 31, 2013 and 2012 and for the years ended December 31, 2013, 2012 and 2011 has been derived from our consolidated financial statements, which have been audited by KPMG LLP and are included in “Item 8—Financial Statements and Supplementary Data.” You should read this information in conjunction with the information under “Item 7—Management’s Discussion and Analysis of Financial Condition and Results of Operations,” our consolidated financial statements, the related notes and the accompanying independent registered public accounting firm’s report, which are included in “Item 8—Financial Statements and Supplementary Data.”
| Years ended December 31, | ||||||||||||||||||||
| (Amounts in millions) |
2013 | 2012 | 2011 | 2010 | 2009 | |||||||||||||||
| Consolidated Statements of Income Information |
||||||||||||||||||||
| Revenues: |
||||||||||||||||||||
| Premiums |
$ | 5,148 | $ | 5,041 | $ | 5,688 | $ | 5,833 | $ | 6,004 | ||||||||||
| Net investment income |
3,271 | 3,343 | 3,380 | 3,266 | 3,033 | |||||||||||||||
| Net investment gains (losses) (1) |
(37 | ) | 27 | (195 | ) | (143 | ) | (1,040 | ) | |||||||||||
| Insurance and investment product fees and other |
1,021 | 1,229 | 1,050 | 760 | 779 | |||||||||||||||
|
|
|
|
|
|
|
|
|
|
|
|||||||||||
| Total revenues |
9,403 | 9,640 | 9,923 | 9,716 | 8,776 | |||||||||||||||
|
|
|
|
|
|
|
|
|
|
|
|||||||||||
| Benefits and expenses: |
||||||||||||||||||||
| Benefits and operating expenses |
7,861 | 8,558 | 9,287 | 9,402 | 9,308 | |||||||||||||||
| Interest expense |
492 | 476 | 506 | 457 | 393 | |||||||||||||||
|
|
|
|
|
|
|
|
|
|
|
|||||||||||
| Total benefits and expenses |
8,353 | 9,034 | 9,793 | 9,859 | 9,701 | |||||||||||||||
|
|
|
|
|
|
|
|
|
|
|
|||||||||||
| Income (loss) from continuing operations before income taxes |
1,050 | 606 | 130 | (143 | ) | (925 | ) | |||||||||||||
| Provision (benefit) for income taxes |
324 | 138 | (11 | ) | (279 | ) | (440 | ) | ||||||||||||
|
|
|
|
|
|
|
|
|
|
|
|||||||||||
| Income (loss) from continuing operations |
726 | 468 | 141 | 136 | (485 | ) | ||||||||||||||
| Income (loss) from discontinued operations, net of taxes (2) |
(12 | ) | 57 | 36 | 45 | 33 | ||||||||||||||
|
|
|
|
|
|
|
|
|
|
|
|||||||||||
| Net income (loss) |
714 | 525 | 177 | 181 | (452 | ) | ||||||||||||||
| Less: net income attributable to noncontrolling interests (3) |
154 | 200 | 139 | 143 | 61 | |||||||||||||||
|
|
|
|
|
|
|
|
|
|
|
|||||||||||
| Net income (loss) available to Genworth Financial, Inc.’s common stockholders |
$ | 560 | $ | 325 | $ | 38 | $ | 38 | $ | (513 | ) | |||||||||
|
|
|
|
|
|
|
|
|
|
|
|||||||||||
| Income (loss) from continuing operations available to Genworth Financial, Inc.’s common stockholders per common share: |
||||||||||||||||||||
| Basic |
$ | 1.16 | $ | 0.55 | $ | — | $ | (0.01 | ) | $ | (1.21 | ) | ||||||||
|
|
|
|
|
|
|
|
|
|
|
|||||||||||
| Diluted (4) |
$ | 1.15 | $ | 0.54 | $ | — | $ | (0.01 | ) | $ | (1.21 | ) | ||||||||
|
|
|
|
|
|
|
|
|
|
|
|||||||||||
| Income (loss) from discontinued operations, net of taxes, available to Genworth Financial, Inc.’s common stockholders per common share: |
||||||||||||||||||||
| Basic (2) |
$ | (0.02 | ) | $ | 0.12 | $ | 0.07 | $ | 0.09 | $ | 0.07 | |||||||||
|
|
|
|
|
|
|
|
|
|
|
|||||||||||
| Diluted (2) |
$ | (0.02 | ) | $ | 0.12 | $ | 0.07 | $ | 0.09 | $ | 0.07 | |||||||||
|
|
|
|
|
|
|
|
|
|
|
|||||||||||
| Net income (loss) available to Genworth Financial, Inc.’s common stockholders per common share: |
||||||||||||||||||||
| Basic |
$ | 1.13 | $ | 0.66 | $ | 0.08 | $ | 0.08 | $ | (1.14 | ) | |||||||||
|
|
|
|
|
|
|
|
|
|
|
|||||||||||
| Diluted (4) |
$ | 1.12 | $ | 0.66 | $ | 0.08 | $ | 0.08 | $ | (1.14 | ) | |||||||||
|
|
|
|
|
|
|
|
|
|
|
|||||||||||
| Weighted-average common shares outstanding: (5) |
||||||||||||||||||||
| Basic |
493.6 | 491.6 | 490.6 | 489.3 | 451.1 | |||||||||||||||
|
|
|
|
|
|
|
|
|
|
|
|||||||||||
| Diluted (4) |
498.7 | 494.4 | 493.5 | 493.9 | 451.1 | |||||||||||||||
|
|
|
|
|
|
|
|
|
|
|
|||||||||||
| Cash dividends declared per common share |
$ | — | $ | — | $ | — | $ | — | $ | — | ||||||||||
|
|
|
|
|
|
|
|
|
|
|
|||||||||||
94
| Years ended December 31, | ||||||||||||||||||||
| (Amounts in millions) |
2013 | 2012 | 2011 | 2010 | 2009 | |||||||||||||||
| Selected Segment Information |
||||||||||||||||||||
| Total revenues: |
||||||||||||||||||||
| U.S. Life Insurance |
$ | 6,330 | $ | 6,250 | $ | 6,130 | $ | 5,786 | $ | 4,797 | ||||||||||
| International Mortgage Insurance |
1,361 | 1,408 | 1,507 | 1,372 | 1,259 | |||||||||||||||
| U.S. Mortgage Insurance |
616 | 676 | 702 | 733 | 811 | |||||||||||||||
| International Protection |
786 | 822 | 1,022 | 1,112 | 1,301 | |||||||||||||||
| Runoff |
302 | 381 | 525 | 665 | 672 | |||||||||||||||
| Corporate and Other |
8 | 103 | 37 | 48 | (64 | ) | ||||||||||||||
|
|
|
|
|
|
|
|
|
|
|
|||||||||||
| Total |
$ | 9,403 | $ | 9,640 | $ | 9,923 | $ | 9,716 | $ | 8,776 | ||||||||||
|
|
|
|
|
|
|
|
|
|
|
|||||||||||
| Income (loss) from continuing operations available to Genworth Financial, Inc.’s common stockholders: |
||||||||||||||||||||
| U.S. Life Insurance |
$ | 384 | $ | 274 | $ | 356 | $ | 215 | $ | (183 | ) | |||||||||
| International Mortgage Insurance |
372 | 349 | 353 | 369 | 331 | |||||||||||||||
| U.S. Mortgage Insurance |
37 | (114 | ) | (494 | ) | (578 | ) | (437 | ) | |||||||||||
| International Protection |
39 | (59 | ) | 90 | 73 | 45 | ||||||||||||||
| Runoff |
49 | 58 | (37 | ) | 19 | (46 | ) | |||||||||||||
| Corporate and Other |
(309 | ) | (240 | ) | (266 | ) | (105 | ) | (256 | ) | ||||||||||
|
|
|
|
|
|
|
|
|
|
|
|||||||||||
| Total |
$ | 572 | $ | 268 | $ | 2 | $ | (7 | ) | $ | (546 | ) | ||||||||
|
|
|
|
|
|
|
|
|
|
|
|||||||||||
| Consolidated Balance Sheet Information |
||||||||||||||||||||
| Total investments |
$ | 68,613 | $ | 74,379 | $ | 71,902 | $ | 68,433 | $ | 63,512 | ||||||||||
| All other assets (6) |
39,432 | 38,494 | 39,779 | 41,432 | 43,001 | |||||||||||||||
| Assets associated with discontinued operations (2) |
— | 439 | 506 | 517 | 451 | |||||||||||||||
|
|
|
|
|
|
|
|
|
|
|
|||||||||||
| Total assets |
$ | 108,045 | $ | 113,312 | $ | 112,187 | $ | 110,382 | $ | 106,964 | ||||||||||
|
|
|
|
|
|
|
|
|
|
|
|||||||||||
| Policyholder liabilities |
$ | 70,544 | $ | 71,609 | $ | 70,363 | $ | 69,323 | $ | 69,371 | ||||||||||
| Non-recourse funding obligations |
2,038 | 2,066 | 3,256 | 3,437 | 3,443 | |||||||||||||||
| Short-term borrowings |
— | — | — | — | 930 | |||||||||||||||
| Long-term borrowings |
5,161 | 4,776 | 4,726 | 4,952 | 3,641 | |||||||||||||||
| All other liabilities |
14,682 | 17,019 | 17,630 | 19,079 | 17,531 | |||||||||||||||
| Liabilities associated with discontinued operations (2) |
— | 61 | 80 | 81 | 76 | |||||||||||||||
|
|
|
|
|
|
|
|
|
|
|
|||||||||||
| Total liabilities |
$ | 92,425 | $ | 95,531 | $ | 96,055 | $ | 96,872 | $ | 94,992 | ||||||||||
|
|
|
|
|
|
|
|
|
|
|
|||||||||||
| Accumulated other comprehensive income (loss) |
$ | 2,542 | $ | 5,202 | $ | 4,047 | $ | 1,506 | $ | (172 | ) | |||||||||
| Noncontrolling interests (3) |
$ | 1,227 | $ | 1,288 | $ | 1,110 | $ | 1,096 | $ | 1,061 | ||||||||||
| Total stockholders’ equity |
$ | 15,620 | $ | 17,781 | $ | 16,132 | $ | 13,510 | $ | 11,972 | ||||||||||
| U.S. Statutory Financial Information (7) |
||||||||||||||||||||
| Statutory capital and surplus (8) |
$ | 5,104 | $ | 4,489 | $ | 4,604 | $ | 4,885 | $ | 5,878 | ||||||||||
| Asset valuation reserve |
$ | 272 | $ | 218 | $ | 149 | $ | 133 | $ | 56 | ||||||||||
| (1) | On April 1, 2009, we adopted new accounting guidance related to the recognition and presentation of other-than-temporary impairments. This accounting guidance modified the presentation of other-than-temporary impairments for certain debt securities to only present the impairment loss in net income (loss) that represents the credit loss associated with the other-than-temporary impairment with the remaining impairment loss being presented in other comprehensive income (loss). |
| (2) | On August 30, 2013, we sold our wealth management business. This business was accounted for as discontinued operations and its financial position and results of operations were separately reported for all periods presented. Also included in discontinued operations was our tax and advisor unit, GFIS, which was part of our wealth management business until its sale on April 2, 2012. See note 25 in our consolidated financial statements under “Item 8—Financial Statements and Supplementary Data” for additional information related to discontinued operations. |
| (3) | Noncontrolling interests relate to the IPO of our Canadian mortgage insurance business in July 2009 which reduced our ownership percentage to 57.5%. We currently hold approximately 57.4% of the outstanding |
95
| common shares of Genworth Canada on a consolidated basis. See note 24 in our consolidated financial statements under “Item 8—Financial Statements and Supplementary Data” for additional information related to noncontrolling interests. |
| (4) | Under applicable accounting guidance, companies in a loss position are required to use basic weighted-average common shares outstanding in the calculation of diluted loss per share. Therefore, as a result of our net loss available to Genworth Financial, Inc.’s common stockholders and our loss from continuing operations available to Genworth Financial, Inc.’s common stockholders for December 31, 2009, the inclusion of 1.9 million of shares for stock options, restricted stock units (“RSUs”) and stock appreciation rights (“SARs”) would have been antidilutive to the calculations. If we had not incurred a net loss available to Genworth Financial, Inc.’s common stockholders and a loss from continuing operations available to Genworth Financial, Inc.’s common stockholders for 2009, dilutive potential common shares would have been 453.0 million. Also, as a result of our loss from continuing operations available to Genworth Financial, Inc.’s common stockholders for the year ended December 31, 2010, we used basic weighted-average common shares outstanding in the calculation of diluted loss from continuing operations available to Genworth Financial, Inc.’s common stockholders per share. |
| (5) | The number of shares used in our calculation of diluted earnings per common share in 2009, 2010, 2011, 2012 and 2013 was affected by the additional shares of Class A Common Stock issuable under Equity Units, stock options, RSUs and SARs and was calculated using the treasury method. In May 2009, stockholders approved, and in July 2009 we commenced, an offer to eligible employees to exchange eligible stock options and SARs (the “Eligible Options and SARs”) for a reduced number of stock options and SARs (collectively, the “Replacement Awards”). In August 2009, we granted the Replacement Awards, consisting of an aggregate of 2.6 million new stock options and 308,210 new SARs, in exchange for the Eligible Options and SARs surrendered in the exchange offer. Weighted-average shares outstanding also increased reflecting a public offering of 55.2 million shares of our Class A Common Stock in September 2009. |
| (6) | We have several significant reinsurance transactions with UFLIC, an affiliate of our former parent, in which we ceded certain blocks of structured settlement annuities, variable annuities and long-term care insurance. As a result of these transactions, we transferred investment securities to UFLIC and recorded a reinsurance recoverable that was included in “all other assets.” For a discussion of this transaction, refer to note 9 in our consolidated financial statements under “Item 8—Financial Statements and Supplementary Data.” |
| (7) | We derived the U.S. Statutory Financial Information from Annual Statements of our U.S. insurance company subsidiaries that were filed with the insurance departments in states where we are domiciled and were prepared in accordance with statutory accounting practices prescribed or permitted by the insurance departments in states where we are domiciled. These statutory accounting practices vary in certain material respects from U.S. GAAP. |
| (8) | Combined statutory capital and surplus for our U.S. domiciled insurance subsidiaries includes surplus notes issued by our U.S. life insurance subsidiaries and statutorily required contingency reserves held by our U.S. mortgage insurance subsidiaries. |
96
| Item 7. | Management’s Discussion and Analysis of Financial Condition and Results of Operations |
The following discussion and analysis of our consolidated financial condition and results of operations should be read in conjunction with our audited consolidated financial statements and related notes included in “Item 8—Financial Statements and Supplementary Data.”
Overview
Our business
We are a leading financial services company dedicated to providing insurance, investment and financial solutions to our customers, with a presence in more than 25 countries. We operate through three divisions: U.S. Life Insurance, Global Mortgage Insurance and Corporate and Other. Under these divisions, there are five operating business segments. The U.S. Life Insurance Division includes the U.S. Life Insurance segment. The Global Mortgage Insurance Division includes the International Mortgage Insurance and U.S. Mortgage Insurance segments. The Corporate and Other Division includes the International Protection and Runoff segments and Corporate and Other activities. The following discussion reflects our operating segments:
| • | U.S. Life Insurance. We offer and manage a variety of insurance and fixed annuity products in the United States. Our primary products include life insurance, long-term care insurance and fixed annuities. |
| • | International Mortgage Insurance. We are a leading provider of mortgage insurance products and related services in Canada and Australia and also participate in select European and other countries. Our products predominantly insure prime-based, individually underwritten residential mortgage loans, also known as flow mortgage insurance. We also selectively provide mortgage insurance on a structured, or bulk, basis that aids in the sale of mortgages to the capital markets and helps lenders manage capital and risk. Additionally, we offer services, analytical tools and technology that enable lenders to operate efficiently and manage risk. |
| • | U.S. Mortgage Insurance. In the United States, we offer mortgage insurance products predominantly insuring prime-based, individually underwritten residential mortgage loans, also known as flow mortgage insurance. We selectively provide mortgage insurance on a bulk basis with essentially all of our bulk writings prime-based. Additionally, we offer services, analytical tools and technology that enable lenders to operate efficiently and manage risk. |
| • | International Protection. We are a leading provider of payment protection coverages (referred to as lifestyle protection) in multiple European countries and have operations in select other countries. Our lifestyle protection insurance products primarily help consumers meet specified payment obligations should they become unable to pay due to accident, illness, involuntary unemployment, disability or death. |
| • | Runoff. The Runoff segment includes the results of non-strategic products which are no longer actively sold. Our non-strategic products primarily include our variable annuity, variable life insurance, institutional, corporate-owned life insurance and other accident and health insurance products. Institutional products consist of: funding agreements, FABNs and GICs. In January 2011, we discontinued new sales of retail and group variable annuities while continuing to service our existing blocks of business. Effective October 1, 2011, we completed the sale of our Medicare supplement insurance business. |
We also have Corporate and Other activities which include debt financing expenses that are incurred at the Genworth Holdings level, unallocated corporate income and expenses, eliminations of inter-segment transactions and the results of other businesses that are managed outside of our operating segments, including discontinued operations.
97
Our financial information
The financial information in this Annual Report on Form 10-K has been derived from our consolidated financial statements.
Revenues and expenses
Our revenues consist primarily of the following:
| • | U.S. Life Insurance. The revenues in our U.S. Life Insurance segment consist primarily of: |
| • | net premiums earned on individual term life insurance, individual and group long-term care insurance and single premium immediate annuities with life contingencies; |
| • | net investment income and net investment gains (losses) on the segment’s separate investment portfolios; and |
| • | insurance and investment product fees and other, including surrender charges, mortality and expense risk charges, primarily from universal life insurance policies, and other administrative charges. |
| • | International Mortgage Insurance. The revenues in our International Mortgage Insurance segment consist primarily of: |
| • | net premiums earned on international mortgage insurance policies; and |
| • | net investment income and net investment gains (losses) on the segment’s separate investment portfolio. |
| • | U.S. Mortgage Insurance. The revenues in our U.S. Mortgage Insurance segment consist primarily of: |
| • | net premiums earned on U.S. mortgage insurance policies and premiums assumed through our inter-segment reinsurance with our international mortgage insurance business; |
| • | net investment income and net investment gains (losses) on the segment’s separate investment portfolio; and |
| • | fee revenues from contract underwriting services. |
| • | International Protection. The revenues in our International Protection segment consist primarily of: |
| • | net premiums earned on lifestyle protection insurance policies; |
| • | net investment income and net investment gains (losses) on the segment’s separate investment portfolio; and |
| • | insurance and investment product fees and other, primarily third-party administration fees. |
| • | Runoff. The revenues in our Runoff segment consist primarily of: |
| • | net investment income and net investment gains (losses) on the segment’s separate investment portfolios; and |
| • | insurance and investment product fees and other, including mortality and expense risk charges, primarily from variable annuity contracts, and other administrative charges. |
| • | Corporate and Other. The revenues in Corporate and Other consist primarily of: |
| • | unallocated net investment income and net investment gains (losses); and |
| • | insurance and investment product fees from non-core businesses and eliminations of inter-segment transactions. |
98
Our expenses consist primarily of the following:
| • | benefits provided to policyholders and contractholders and changes in reserves; |
| • | interest credited on general account balances; |
| • | acquisition and operating expenses, including commissions, marketing expenses, policy and contract servicing costs, overhead and other general expenses that are not capitalized (shown net of deferrals); |
| • | amortization of DAC and other intangible assets; |
| • | goodwill impairment charges; |
| • | interest and other financing expenses; and |
| • | income taxes. |
We allocate corporate expenses to each of our operating segments using a methodology that includes allocated capital.
Management’s discussion and analysis by segment contains selected operating performance measures including “sales” and “insurance in-force” or “risk in-force” which are commonly used in the insurance industry as measures of operating performance.
Management regularly monitors and reports sales metrics as a measure of volume of new and renewal business generated in a period. Sales refer to: (1) annualized first-year premiums for term life and long-term care insurance products; (2) annualized first-year deposits plus 5% of excess deposits for universal and term universal life insurance products; (3) 10% of premium deposits for linked-benefits products; (4) new and additional premiums/deposits for fixed annuities; (5) new insurance written for mortgage insurance; and (6) net written premiums for our lifestyle protection insurance business. Sales do not include renewal premiums on policies or contracts written during prior periods. We consider annualized first-year premiums/deposits, premium equivalents, new premiums/deposits, new insurance written and net written premiums to be a measure of our operating performance because they represent a measure of new sales of insurance policies or contracts during a specified period, rather than a measure of our revenues or profitability during that period.
Management regularly monitors and reports insurance in-force and risk in-force. Insurance in-force for our life, international mortgage and U.S. mortgage insurance businesses is a measure of the aggregate face value of outstanding insurance policies as of the respective reporting date. For risk in-force in our international mortgage insurance business, we have computed an “effective” risk in-force amount, which recognizes that the loss on any particular loan will be reduced by the net proceeds received upon sale of the property. Effective risk in-force has been calculated by applying to insurance in-force a factor of 35% that represents our highest expected average per-claim payment for any one underwriting year over the life of our businesses in Canada and Australia. Risk in-force for our U.S. mortgage insurance business is our obligation that is limited under contractual terms to the amounts less than 100% of the mortgage loan value. We consider insurance in-force and risk in-force to be measures of our operating performance because they represent measures of the size of our business at a specific date which will generate revenues and profits in a future period, rather than measures of our revenues or profitability during that period.
We also include information related to loss mitigation activities for our U.S. mortgage insurance business. We define loss mitigation activities as rescissions, cancellations, borrower loan modifications, repayment plans, lender- and borrower-titled pre-sales, claims administration and other loan workouts. Estimated savings related to rescissions are the reduction in carried loss reserves, net of premium refunds and reinstatement of prior rescissions. Estimated savings related to loan modifications and other cure-related loss mitigation actions represent the reduction in carried loss reserves. Estimated savings related to claims mitigation activities represent amounts deducted or “curtailed” from claims due to acts or omissions by the insured or the servicer with respect
99
to the servicing of an insured loan that is not in compliance with obligations under our master policy. For non-cure related actions, including pre-sales, the estimated savings represent the difference between the full claim obligation and the actual amount paid. Loans subject to our loss mitigation actions, the results of which have been included in our reported estimated loss mitigation savings, are subject to re-default and may result in a potential claim in future periods, as well as potential future loss mitigation savings depending on the resolution of the re-defaulted loan. We believe that this information helps to enhance the understanding of the operating performance of our U.S. mortgage insurance business as loss mitigation activities specifically impact current and future loss reserves and level of claim payments.
Management also regularly monitors and reports a loss ratio for our businesses. For our mortgage and lifestyle protection insurance businesses, the loss ratio is the ratio of incurred losses and loss adjustment expenses to net earned premiums. For our long-term care insurance business, the loss ratio is the ratio of benefits and other changes in reserves less tabular interest on reserves less loss adjustment expenses to net earned premiums. We consider the loss ratio to be a measure of underwriting performance in these businesses and helps to enhance the understanding of the operating performance of our businesses.
An assumed tax rate of 35% is utilized in certain adjustments to net operating income and in the explanation of specific variances of operating performance.
These operating measures enable us to compare our operating performance across periods without regard to revenues or profitability related to policies or contracts sold in prior periods or from investments or other sources.
Business trends and conditions
Our business is, and we expect will continue to be, influenced by a number of industry-wide and product-specific trends and conditions.
General conditions and trends affecting our businesses
Financial and economic environment. The stability of both the financial markets and global economies in which we operate impacts the sales, revenue growth and profitability trends of our businesses. While equity and credit markets improved and interest rate spreads were generally stable during the first quarter of 2013, market volatility increased during the remainder of 2013, ending 2013 with credit spreads moderately tighter in most asset classes. Although the U.S. and several international financial markets experienced improvement during 2013, there are still concerns regarding global economies and the rate and strength of recovery.
The U.S. housing market showed signs of recovery during 2012 and 2013 with home prices rising in a number of regions and cities, but ongoing weakness in the U.S. economy continued to impact the rate of recovery. Unemployment and underemployment levels in the United States remained elevated in 2013. We expect unemployment and underemployment levels in the United States to remain at elevated levels relative to those prevailing before 2009 for an extended period and gradually decrease over time. In Canada, stable economic conditions have persisted with housing affordability benefiting from low interest rates and employment growth and average home prices increased modestly during 2013. The unemployment rate in Canada decreased slightly during 2013 and remains near its lowest level since December 2008. In Australia, the overall housing market generally improved as modest economic growth and low interest rates persisted, coupled with average home prices increasing across most regions during 2013, particularly in the fourth quarter of 2013 when it grew at the highest rate since early 2010. Unemployment in Australia increased slightly during 2013, reaching its highest level in three years. Europe remained a challenging region with slow growth or a declining economic environment with lower lending activity and reduced consumer spending, particularly in Greece, Spain, Portugal, Ireland and Italy, in part as a result of actual or anticipated austerity measures, but certain areas within Europe have shown a modest level of improvement during the second half of 2013. The Chinese economy had experienced significant growth over the past decade, but this growth slowed during 2013 as the new Chinese
100
administration began to implement economic and credit market reforms. Gross domestic product growth in China in 2013 was close to that of 2012, but significantly lower from growth over the last decade. Given the relative size of the Chinese economy, the impact of a significant change in the pace of economic expansion in China could impact global economies, partly as a result of lower commodity imports, particularly those from the Asia Pacific region, including Australia. See “—Trends and conditions affecting our segments” below for a discussion regarding the impacts the financial markets and global economies have on our businesses.
Declining, slow or varied levels of economic growth, coupled with uncertain financial markets and economic outlooks, changes in government policy, regulatory reforms and other changes in market conditions, influenced, and we believe will continue to influence, investment and spending decisions by consumers and businesses as they adjust their consumption, debt, capital and risk profiles in response to these conditions. These trends change as investor confidence in the markets and the outlook for some consumers and businesses shift. As a result, our sales, revenues and profitability trends of certain insurance and investment products have been and could be further impacted negatively or positively going forward. In particular, factors such as government spending, monetary policies, the volatility and strength of the capital markets, anticipated tax policy changes and the impact of global financial regulation reform will continue to affect economic and business outlooks and consumer behaviors moving forward.
The U.S. and international governments, Federal Reserve, other central banks and other legislative and regulatory bodies have taken certain actions to support the economy and capital markets, influence interest rates, influence housing markets and mortgage servicing and provide liquidity to promote economic growth. These include various mortgage restructuring programs implemented or under consideration by the GSEs, lenders, servicers and the U.S. government. Outside of the United States, various governments and central banks have taken and continue to take actions to stimulate economies, stabilize financial systems and improve market liquidity. In aggregate, these actions had a positive effect in the short term on these countries and their markets; however, there can be no assurance as to the future level of impact these types of actions may have on the economic and financial markets, including levels of volatility. A delayed economic recovery period, a U.S. or global recession or regional or global financial crisis could materially and adversely affect our business, financial condition and results of operations.
We manage our product offerings, liquidity, capital, investment and asset-liability management strategies to moderate risk especially during periods of strained economic and financial market conditions. In addition, we continue to review our product and distribution management strategies to align with our strengths, profitability targets and risk tolerance.
Credit and investment markets. The Federal Reserve announced the tapering of its Long-Term Securities Asset Purchase Program in the fourth quarter of 2013, an indicator of its intent to gradually normalize monetary policy. The modest size of the purchase reduction program, $10.0 billion of U.S. Treasuries and mortgage-backed securities per month, was largely expected. Prices for higher risk assets increased in response to the announcement. In early 2014, the Federal Reserve announced another $10.0 billion reduction of asset purchases and reiterated its tapering plan. The indicated gradual reductions, if continued through 2014, would conclude the Federal Reserve’s asset purchases by the end of 2014. In combination with the tapering news, global interest rates rose on stronger growth expectations for developed economies, including the United States and Europe.
Credit spreads generally tightened in most asset classes with investment grade and high yield securities outperforming other fixed-income asset classes. Spreads for both sectors ended tighter for the year ended December 31, 2013. In emerging markets, however, a number of currencies came under pressure driven by the combination of the Federal Reserve’s asset taper program and weakness in commodity prices. Currency weakness was especially pronounced for countries with significant current account deficits and heavy reliance on external funding, causing spreads on their respective sovereign securities to widen and underperform their corporate counterparts.
101
We recorded net other-than-temporary impairments of $25 million during 2013 compared to $106 million during 2012. Impairments have decreased across almost all asset classes due to improving economic conditions. Increases in interest rates have lowered the value of our investments and derivatives, resulting in decreases in net unrealized investment gains on securities of $1,751 million and derivatives qualifying as hedges of $590 million in other comprehensive income for the year ended December 31, 2013. Economic conditions will continue to impact the valuation of our investment portfolios and the amount of other-than-temporary impairments.
Looking ahead, while we view the current credit environment as stable and corporate defaults are expected to remain low, company-specific spread widening could occur given an environment in which companies are rewarded to increase debt and return funds to shareholders. In addition, uncertainty relating to developments in emerging markets could continue to result in spread volatility in emerging market bonds. We believe the current credit environment provides us with opportunities to invest across a variety of asset classes, but our returns will continue to be pressured because of low interest rates. The current environment will also provide opportunities to continue execution of various risk management disciplines involving further diversification within the investment portfolio. See “—Investments and Derivative Instruments” for additional information on our investment portfolio.
Trends and conditions affecting our segments
U.S. Life Insurance
Life insurance. Results of our life insurance business are impacted by sales, competitor actions, mortality, persistency, investment yields, expenses, reinsurance and statutory reserve requirements. Additionally, sales of our products and persistency of our insurance in-force are dependent on competitive product features and pricing, underwriting, distribution and customer service. Shifts in consumer demand, competitors’ actions, relative pricing, return on capital or reinsurance decisions and other factors, such as regulatory matters affecting life insurance policy reserve levels, can also affect our sales levels.
Life insurance sales decreased 67% during 2013 compared to 2012 largely attributable to our term universal life insurance product as we discontinued sales of this product in the fourth quarter of 2012. Sales levels were also lower than expected primarily as a result of slower growth in sales from our universal and term life insurance products reflecting actions taken to transition our portfolio. We plan to continue to broaden our life insurance product portfolio, modify pricing and improve service delivery platforms. This may include further re-pricing of our life insurance products or introducing new universal life insurance offerings, which may continue to include optional long-term care insurance riders. Collectively, these changes are expected to result in a broader set of profitable and competitive product offerings and we expect sales to increase over time.
Throughout 2012 and continuing into 2013, we experienced favorable mortality results in our term universal and term life insurance products as compared to priced mortality assumptions. Mortality levels may deviate each period from historical trends because of a variety of factors. We have experienced lower persistency in 2013 as compared to pricing assumptions for our 10-year term life insurance policies as they go through their post-level rate period. We expect this trend in persistency to continue as these 10-year term life insurance policies approach their post-level rate period and then moderate thereafter. As our 15-year term life insurance policies written in 1999 and 2000 approach their post-level rate period, if this block experiences lower persistency compared to pricing, we could expect additional amortization of DAC and lower profitability in our term life insurance products.
Regulations XXX and AXXX require insurers to establish additional statutory reserves for term life insurance policies with long-term premium guarantees and for certain universal life insurance policies with secondary guarantees. This increases the capital required to write these products. We have committed funding sources for approximately 95% of our anticipated peak level reserves currently required under Regulations XXX and AXXX. The NAIC adopted revised statutory reserving requirements for new and in-force secondary
102
guarantee universal life business subject to AG 38 provisions, which became effective December 31, 2012. These requirements reflected an agreement reached and developed by a NAIC Joint Working Group which included regulators from several states, including New York. The financial impact related to the revised statutory reserving requirements on our in-force reserves subject to the new guidance was not significant as of December 31, 2012. On September 11, 2013, the NYDFS announced that it no longer supported the agreement reached by the NAIC Working Group and that it would require New York licensed companies, including our New York domiciled insurance subsidiary, to use an alternative interpretation of AG 38 for universal life insurance products with secondary guarantees. We have been in discussions with the NYDFS about its alternative interpretation and recorded $80 million of additional statutory reserves as of December 31, 2013. We continue to work with the NYDFS to determine potential future impacts, if any. The NYDFS has not finalized a permanent update to the regulation. Depending on the final regulation, our New York domiciled insurance subsidiary’s statutory reserves could increase significantly over time.
Uncertainties associated with our continued use of U.S.-domiciled captive life reinsurance subsidiaries are primarily related to potential regulatory changes. During 2012, the NAIC began a review of the insurance industry’s use of captive life reinsurance subsidiaries and is considering changes to its model regulations. We are currently unable to predict the ultimate outcome of the NAIC’s review.
Although we do not believe it to be likely, a potential outcome of the NAIC review is that we will be prohibited from continuing our use of captive life reinsurance subsidiaries. The expected effect of such prohibition would depend on the specific changes to state regulations that are adopted as a result of the NAIC review, including whether current captive life reinsurance structures would be allowed to continue in existence or, if not, the method and timing of their dissolution, as well as the cost and availability of alternative financing. At this time, given the uncertainty around these matters, we are unable to estimate the expected effects on our consolidated operations and financial position of the discontinuance of the use of captive life reinsurance subsidiaries to finance statutory reserves subject to Regulations XXX and AXXX and AG 38 in the future. If we were to discontinue our use of captive life reinsurance subsidiaries to finance statutory reserves in response to regulatory changes on a prospective basis, the reasonably likely impact would be increased costs related to alternative financing, such as third-party reinsurance, and potential reductions in or discontinuance of new term or universal life insurance sales, all of which would adversely impact our consolidated results of operations and financial condition. In addition, we cannot be certain that affordable alternative financing would be available, if at all.
Long-term care insurance. Results of our long-term care insurance business are influenced by sales, competitor actions, morbidity, mortality, persistency, investment yields, expenses, changes in regulations and reinsurance. Additionally, sales of our products are impacted by the relative competitiveness of our offerings based on product features, pricing and commission levels, including the impact of in-force rate actions on distribution and consumer demand. Changes in regulations or government programs, including long-term care insurance rate action legislation, could impact our long-term care insurance business positively or negatively.
Our long-term care insurance sales decreased 38% during 2013 compared to 2012. The lower sales reflected various price and benefit actions taken in the second half of 2012 to improve product profitability and reduce risk. The lower sales also reflected changes to our ability to generate consumer leads through affinity relationships, including the fact that effective June 1, 2013, we no longer offer AARP-branded long-term care insurance products. Our pricing and benefit actions included the elimination of lifetime benefits coverage and limited pay options on new products, further tightening of underwriting and lowering of first-year commissions in certain channels, as well as a reduction or suspension of certain discounts, which effectively increased average pricing by more than 20% on the products impacted. In 2013, we took additional steps to further improve our profit and risk profile with the introduction of a new product and the suspension of sales of our individual long-term care insurance product in California. As of December 31, 2013, this new product, which includes gender distinct pricing for single applicants and blood and lab underwriting requirements for all applicants, has been
103
launched in 39 states. We have approvals in eight additional states and plan to have the majority of these states launched in the first quarter of 2014. The California actions, which became effective March 21, 2013, addressed an earlier generation product that was still being sold that did not have the benefits and pricing changes associated with our newer products. We received approval from California for a new individual long-term care insurance product which we launched in the third quarter of 2013.
We will continue to focus on managing profitability and reducing risk of our long-term care insurance business, including implementation of new product pricing and benefit changes in addition to premium rate increases on our in-force business. In the fourth quarter of 2013, we began filing for regulatory approval of a new product, scheduled for release in 2014, subject to regulatory approvals. We have also utilized internal and external reinsurance in the form of coinsurance to manage risk and limit capital allocated to this business. We currently have a portion of this business reinsured internally by one of our Bermuda-domiciled captive life reinsurance subsidiaries. One of our strategic priorities in 2014 is to repatriate our long-term care insurance business into our U.S.-domiciled life insurance company. There will be no impact on our U.S. GAAP consolidated results of operations and financial condition as the financial impact of this reinsurance eliminates in consolidation and we anticipate a small impact on our U.S. life insurance company RBC ratio. External new business reinsurance levels vary and are dependent on a number of factors, including price, risk tolerance and capital levels. Over time, there can be no assurance that affordable reinsurance will continue to be available, if at all.
The annual loss ratios of our long-term care insurance business have ranged from 62% to 68% over the last five years and have been increasing over the past several years. We experience volatility in our loss ratios on a quarterly basis, which has produced loss ratios outside of the annual range, from period-to-period caused by variances in terminations, claim severity and changes in claim counts. In addition, we evaluate claim reserves (including the underlying assumptions, e.g., morbidity) and refine our estimates from time to time which may also cause volatility in our operating results and loss ratios.
In spite of the rise in interest rates in 2013, the continued low interest rate environment has put pressure on the profitability and returns of our long-term care insurance business. We seek to manage the impact of low interest rates through asset-liability management and hedging long-term care insurance product cash flows. We recently expanded our hedging strategy in connection with our new long-term care insurance product launched on April 15, 2013 in order to help mitigate interest rate risk.
As a result of ongoing challenges in our long-term care insurance business, we continue pursuing initiatives to improve the risk and profitability profile of our business including: price increases on our in-force liabilities; product refinements; changes to our current product offerings in certain states; investing in care coordination capabilities and service offerings; refining underwriting requirements; maintaining tight expense management; actively exploring additional reinsurance strategies; executing effective investment strategies; and considering other actions to improve the performance of the overall block. These efforts have included evaluating the need for future in-force premium rate increases on issued policies. In the third quarter of 2012, we initiated a round of long-term care insurance in-force premium rate increases with an expectation of achieving an average premium increase in excess of 50% on the older generation policies and an average premium increase in excess of 25% on an earlier series of new generation policies. Subject to regulatory approval, this premium rate increase is expected to generate approximately $250 million to $300 million of additional annual premiums when fully implemented over the next several years. We also expect our reserve levels, and thus our expected profitability, to be impacted by policyholder behavior which could include taking reduced benefits or non-forfeiture options within their policy coverage. The goal of our rate actions is to mitigate losses on the older generation products and help offset higher than priced-for loss ratios due to unfavorable business mix and lower lapse rates than expected on certain newer generation products which remain profitable but with returns lower than original pricing assumptions. As of December 31, 2013, this round of rate actions had been approved in 41 states representing approximately $195 million to $200 million of the targeted premium increase when fully implemented in 2017. In the third quarter of 2013, we began filing for regulatory approval for premium rate increases ranging between 6% and 13% on more than $800 million in annualized in-force premiums on another
104
series of new generation policies. As of December 31, 2013, we have received approvals in four states. The premium rate increases on these policies will help offset higher than priced-for loss ratios, which have been caused by lower than anticipated lapse rates and improvements in life expectancy. The approval process of an in-force rate increase and the amount and timing of the rate increase approved varies by state. In certain states, the decision to approve or disapprove a rate increase can take several years. Upon approval, insureds are provided with written notice of the increase and increases are generally applied on the insured’s policy anniversary date. Therefore, the benefits of any rate increase are not fully realized until the implementation cycle is complete.
Fixed annuities. Results of our fixed annuities business are affected by investment performance, interest rate levels, slope of the interest rate yield curve, net interest spreads, mortality, policyholder surrenders, expense and commission levels, new product sales, competitor actions and competitiveness of our offerings. Our competitive position within many of our distribution channels and our ability to grow this business depends on many factors, including product offerings and relative pricing.
In fixed annuities, sales may fluctuate as a result of consumer demand, competitor actions, changes in interest rates, credit spreads, relative pricing, return on capital decisions and our approach to managing risk. We monitor and change prices and crediting rates on fixed annuities to maintain spreads and targeted returns. We have targeted distributors and producers and maintained sales capabilities that align with our strategy. We expect to continue to manage these distribution relationships while selectively adding or shifting towards other product offerings, including fixed indexed annuities.
Refinements of product offerings and related pricing, including ongoing evaluation of commission structures and changes in investment strategies, support our objective of achieving appropriate risk-adjusted returns. Fixed annuity sales increased 29% during 2013 compared to 2012 primarily attributable to competitive pricing while maintaining targeted returns and from an increase in interest rates in the second half of 2013.
International Mortgage Insurance
Results of our international mortgage insurance business are affected by changes in regulatory environments, employment levels, consumer borrowing behavior, lender mortgage-related strategies, including lender servicing practices, and other economic and housing market influences, including interest rate trends, home price appreciation or depreciation, mortgage origination volume, levels and aging of mortgage delinquencies and movements in foreign currency exchange rates.
Canada and Australia comprise approximately 98% of our international mortgage insurance primary risk in-force. These established markets will continue to be key drivers of revenues and earnings in our international mortgage insurance business. During 2013, foreign currencies weakened against the U.S. dollar, particularly in Canada and Australia, which negatively impacted the underlying reported results of our international mortgage insurance business. Further weakening of foreign currencies could negatively impact future results.
Our participation or entry in other international markets remains selective. During 2012, we became a minority shareholder of a newly-formed joint venture partnership in India. The joint venture offers mortgage guarantees against borrower defaults on housing loans from mortgage lenders in India. This joint venture had a minimal financial impact during 2012 and 2013 and is expected to have a similar minimal financial impact during the next several years.
In Canada, stable economic conditions have persisted with housing affordability benefiting from low interest rates and employment growth. The unemployment rate decreased slightly during 2013 and remains near its lowest level since December 2008. We expect the unemployment rate to stay near current levels in 2014. Additionally, average home prices increased modestly during 2012 and 2013 and we expect home prices to remain flat or decrease modestly in 2014, as a balanced housing market persists and consumers exercise restraint with debt levels. However, some market observers have expressed concerns about the strength of the Canadian
105
housing market, and we will continue to closely monitor the market. The Bank of Canada has maintained the overnight rate at 1.0% during recent years and we expect this rate to be maintained at or near this level in 2014.
Over the past several years, the Canadian government implemented a series of revisions to the mortgage insurance eligibility rules, eliminating high loan-to-value refinancing transactions and imposing more stringent qualifying criteria for insured mortgages by reducing the maximum amortization period to 25 years from 30 years. These changes have reduced the premium opportunity for residential mortgage insurance, particularly for high loan-to-value refinance transactions. As a result, purchase transactions, which normally have higher premium rates compared to refinancing, currently comprise a higher percentage of our business and we expect this to continue in the future.
In the 2013 federal budget, the Canadian government proposed to gradually limit the insurance of low loan-to-value mortgages to only those mortgages that will be used in CMHC securitization programs. In addition, the Canadian government intends to prohibit the use of any taxpayer-backed insured mortgage, both high and low loan-to-value, as collateral in securitization vehicles that are not sponsored by CMHC. We are in ongoing discussions with the Canadian government as it designs the structure to implement the proposed changes. The final impact of these proposed changes on our business cannot be assessed at this time, but could impact our bulk business.
Flow new insurance written in Canada in 2013 decreased modestly compared to 2012 primarily due to a smaller mortgage origination market, particularly for high loan-to-value refinance transactions, as a result of recent revisions to mortgage insurance eligibility rules. During the fourth quarter of 2013, flow new insurance written decreased compared to the third quarter of 2013 primarily from a seasonally smaller mortgage originations market which typically peaks in the spring and summer months. The volume of flow new insurance written in the fourth quarter of 2013, however, was higher than that of the fourth quarter of 2012 due to potential mortgage rate increases. As our large 2007 and 2008 book years are mostly past their peak earnings period, earned premiums in Canada declined in 2013 compared to 2012.
During 2013, losses in Canada decreased from 2012 levels as the total number of delinquencies and the proportion of new higher severity delinquencies from Alberta declined, and we continued to realize benefits from our loss mitigation activities. In Alberta, the economy and housing market conditions have improved in recent quarters, with Alberta reporting one of the lowest unemployment rates of all Canadian provinces at the end of the fourth quarter of 2013. Losses decreased sequentially during each of the four quarters of 2013 as the proportion of new delinquencies from Alberta further declined.
Legislation that was passed in June 2011 by the Canadian government to formalize existing mortgage insurance arrangements with private mortgage insurers, and terminate the existing agreement with the Canadian government, became effective on January 1, 2013. This action included the elimination of the Canadian government guarantee fund and exit fees related to it. The new legislation does not change the current government guarantee of 90% provided on mortgages we insure and, therefore, during 2013, we did not experience any significant impact to our levels of new business as a result of this legislation. Based on the provisions of this legislation, as clarified by the final regulations released in the fourth quarter of 2012, the assets held in the Canadian government guarantee fund were returned to us on January 1, 2013 and the exit fee liability was extinguished. The reversal of the exit fee resulted in a benefit of approximately $78 million to net operating income in the fourth quarter of 2012. As a result of the elimination of the guarantee fund, we are required to hold higher regulatory capital; however, the increase in required capital has been offset by the increase in available capital that resulted from the guarantee fund assets reverting back to us.
In Australia, the overall economy continued to expand during 2013, though at a more modest pace than in prior years, with ongoing evidence of variation in economic activity across sectors and regions. At the same time, housing affordability improved driven primarily by lower interest rates. The unemployment rate increased
106
slightly during 2012 and 2013, reaching its highest level in three years. The unemployment rate is expected to increase modestly from current levels through 2014. The overall housing market in Australia improved during 2013. During 2013, average home prices improved across all regions and during the fourth quarter of 2013 grew at the highest rate since early 2010. We expect average national home prices to increase modestly in 2014. During recent years, the Reserve Bank of Australia has gradually lowered the official cash rate to 2.50%, with the latest interest rate cut occurring in August 2013, as Australian and global economic conditions were somewhat weaker than expected. This historically low level of interest rates is now below the low point reached during the global financial crisis when rates were lowered to 3.00%. While we do not expect cash rates to be reduced significantly from the current level in 2014, the Reserve Bank of Australia has indicated that it will continue to monitor the outlook and adjust policy as needed to support the broader economy.
Total mortgage market activity in Australia improved during 2012 and 2013 as consumer confidence improved and affordability rose to its highest level in recent years. This growth was also reflected in the higher loan-to-value mortgage origination market, and has underpinned improving levels of flow new insurance written throughout 2012 and 2013. Earned premiums in Australia increased during 2013 as compared to 2012 primarily as a result of higher written premiums, the seasoning of our in-force block of business and lower ceded reinsurance premiums.
During the first quarter of 2012, we strengthened reserves $82 million to reflect an observed change in the rate of conversion from later stage delinquency to claim as well as a higher average paid claim amount. The reserve strengthening recognized that we expected to see an elevated number of claims paid and higher average claim amount in the near term. While these factors did impact the level of losses for the remainder of 2012, their effect was partly offset by a lower number of new delinquencies, net of cures. The overall delinquency rate continued to decrease during 2013 ending the year at its lowest level since the end of 2008. The level and number of paid claims in 2013 declined in comparison to 2012. During the first quarter of 2013, losses were higher compared to the fourth quarter of 2012, which was in line with our expectations for a first quarter seasonal decline in cures. Over the remainder of 2013 losses declined sequentially driven by a seasonal recovery in cures and increased borrower sales activity. An improvement in the housing market was supported by the stable economy and low interest rate environment which contributed to a lower volume of claims paid and claims severity.
We previously announced a plan to pursue a sale of up to 40% of our Australian mortgage insurance business subject to market conditions, valuation considerations including business performance in Australia, and regulatory approvals. Executing the planned sale, including through an IPO, remains a key priority in reducing our exposure to mortgage insurance risk, rebalancing the capital among our three main mortgage insurance platforms and generating capital. In Australia, there is concentration among a small group of banks that write most of the mortgages. These banks continue to evaluate the utilization of mortgage insurance in connection with the implementation of the bank capital standards in Australia introduced by the Basel Committee, and this could impact both the size of the private mortgage insurance market in Australia and our market share. The response of banks to the new capital standards will develop over time and this response could impact our Australian mortgage insurance business. The execution of the Australian IPO is a strategic priority for 2014, but execution is subject to market conditions, valuation considerations, including business performance, and regulatory considerations.
The overall economic environment in Europe continues to be dominated by concerns about the fiscal health of specific countries and regions, which has created uncertainty about the timing and speed of economic recovery and renewed concerns about a lingering economic recession. While regional differences exist, the overall business climate and the economic growth outlook in Europe remain pressured from the combination of fiscal austerity, persistent high unemployment rates and low business and consumer confidence. As a result, we have seen an elevated number of delinquencies and lower cures driven by prolonged economic stress, most notably in Ireland, but also in other parts of Europe, contributing to losses in our European mortgage insurance business. In Ireland, which represents approximately 1% of our insurance in-force in our international mortgage insurance business and 21% of our insurance in-force in Other Countries, we experienced increased delinquencies and
107
reserves at the beginning of 2012, driven by prolonged economic and housing market stress. During the remainder of 2012, we observed a moderate improvement in outstanding delinquencies primarily driven by our loss mitigation efforts and lower number of new delinquencies. During the first nine months of 2013, new delinquencies remained at levels similar to those experienced in the second half of 2012. In the fourth quarter of 2013, delinquencies decreased by approximately 2,400 from lender settlements, primarily in Ireland. These settlements also had the benefit of reducing the outstanding risk in-force in Ireland by approximately 50%. We are actively working with lenders and have significantly reduced our exposure and new business volumes from certain European countries as we seek opportunities to manage and mitigate our risk profile in Europe.
Over the past several years, our global loss mitigation operations have enhanced both their capabilities and resources devoted to finding solutions that cure delinquencies and help keep borrowers in their homes. These efforts include lender mortgage-related strategies, such as loan modification programs designed to help borrowers maintain mortgage payments while they are experiencing personal hardships. These programs allow lenders to maintain their relationship with a borrower while retaining an interest earning asset. In addition, we have developed asset management strategies designed to efficiently dispose of properties when a borrower’s hardship cannot be cured. Such efforts include actively partnering with the lender and borrower to optimize the transition process and taking early possession of properties to mitigate claim payments. As a result, these types of loss mitigation activities have had a favorable impact on our financial results as well as our relationships in the marketplace.
U.S. Mortgage Insurance
Results of our U.S. mortgage insurance business are affected by the following factors: competitor actions; unemployment; underemployment; other economic and housing market trends, including interest rates, home prices, mortgage origination volume mix and practices; the levels and aging of mortgage delinquencies, which may be affected by seasonal variations, the inventory of unsold homes, lender modification and other servicing efforts; and resolution of pending or any future litigation. The ongoing impact of prior years’ weakness and uncertainty in the domestic economy, related levels of unemployment and underemployment and resulting increase in foreclosures, the number of borrowers seeking loan modifications and the level of housing inventories with the related impact on home values, all combine to contribute adversely to the performance of our insured book. Overall, we believe that home values reached their lowest levels and expect slow and modest growth on average in these values in 2014. At the same time, we also expect unemployment and underemployment levels to remain at elevated levels relative to those prevailing before 2009 for an extended period and gradually decrease over time. Currently, we expect the results of our U.S. mortgage insurance business in 2014 to improve significantly over 2013. Our profitability expectations are subject to the continued recovery of the U.S. housing market, the extent of seasonality that has been historically experienced in the second half of the year, and certain other items such as the cost of resolution of pending litigation.
Prior to 2012, the convergence of a weak housing market, tightened lending standards, the lack of consumer confidence and the lack of liquidity in some mortgage securitization markets, along with volatility in mortgage interest rates, came together to drive a smaller mortgage origination market. Within the private mortgage insurance market, the mortgage insurance penetration rate and overall market size was driven down over previous periods by growth in the FHA originations, associated with multiple pricing, underwriting and loan size factors, and the negative impact of GSE guarantee fees and loan level pricing which made private mortgage insurance solutions less competitive with FHA solutions. From 2011 through 2013, the private mortgage insurance industry saw its purchase and refinance penetration rates increase as private mortgage insurance competitiveness improved versus the FHA alternative driven in part by FHA price and risk management actions. In addition, the FHA price increase, which was effective April 1, 2013, continues to have a favorable impact on private mortgage insurance competitiveness going forward. The positive impact to private mortgage insurance demand caused by this pattern has been offset in part by the increase in the cost of loans sold to the GSEs, which are insured by private mortgage insurance, that has resulted from increased GSE loan level fees compared to FHA insured loans which are not subject to GSE fees. Further GSE guarantee or loan level fee increases could
108
limit the demand for or competitiveness of private mortgage insurance. Considering both of these trends, we still believe the industry is likely to regain market share over time.
Driven by mortgage originations and mortgage insurance penetration, the overall insured market was larger in 2013 compared to 2012. Our U.S. mortgage insurance market share in the fourth quarter of 2013 remained flat with the third quarter of 2013 driven in part by the impact of competitor pricing and underwriting guidelines. Our recent principal sources of competition include other private mortgage guaranty insurers, but we cannot predict the impact on our business of the change in the mix of private mortgage guaranty insurer competition following the financial crisis when certain legacy competitors ceased writing new business while other new entrants began writing business in recent periods. Even though home affordability is above historical levels, an ongoing rise in interest rates may slow the housing recovery. Conversely, rising interest rates and resulting slowing down of refinance activity levels improves the persistency levels of our insured portfolio as fewer loans pay off and corresponding mortgage insurance coverage remains in force. The positive effect on home prices caused by recent investor purchases of existing housing may also abate, further slowing housing recovery momentum. Meanwhile, we continue to manage the quality of new business through prudent underwriting guidelines, which we modify from time to time when circumstances warrant in a manner we expect will limit the amount of coverage we write on riskier loans. In October 2013, and in addition to the pricing and guideline changes that we announced in September 2013, we announced further reduced pricing and expanded underwriting guidelines that are more in line with industry prices and guideline standards, which we believe will increase our competitiveness in the mortgage insurance market while maintaining what we believe will be a profitable book of business. As of December 31, 2013, loans modified through the Home Affordable Refinance Program (“HARP”), accounted for approximately $0.8 billion of insurance in the fourth quarter of 2013 and $6.5 billion for the full year ended December 31, 2013, and are treated as a modification of the coverage on existing insurance in-force rather than new insurance written. Loans modified through HARP have extended amortization periods and reduced interest rates which reduce borrower’s monthly payments. Over time, these modified loans are expected to result in extended premium streams and a lower incidence of default. We also continue to believe that the mortgage insurance industry level of market penetration and eventual market size will continue to be affected by any actions taken by the GSEs, the FHA or the U.S. government impacting housing or housing finance policy, underwriting standards, loan limits or related reforms.
In June 2013, the Federal Housing Finance Agency announced strategic priorities for the GSEs and indicated that there could be changes to the MI Eligibility Standards. We expect these changes could increase capital or asset requirements for mortgage insurers, including our U.S. mortgage insurance business. Currently, we do not know what these new eligibility standards will be or when they may be implemented. The NAIC is also reviewing the current Mortgage Guaranty Model Act, including minimum capital and surplus requirements for mortgage insurers through the MGIWG. The MGIWG has not established a date by which it must make proposals to change such requirements. However, as we learn more specific information about these activities, we continue to assess the potential impact, if any, that these new standards and requirements may have on our U.S. mortgage insurance business and evaluate the options potentially available to meet these new GSE requirements and any legislative or regulatory measures adopted as a result of the NAIC recommendations. If regulatory changes (including those under consideration by the GSEs and NAIC) or other business-related considerations indicate a contribution is required and appropriate, we could provide additional capital to GEMICO with an asset contribution or a cash contribution through a variety of means. In addition to the available funds held at the U.S. mortgage holding company, we have various alternatives available to us to manage GEMICO’s future capital position, including organic earnings growth; utilization of a portion of available deferred tax assets; possible reinsurance transactions; use of proceeds from the planned Australian IPO; issuance of convertible or exchangeable securities at the Genworth Financial and/or the Genworth Holdings levels; and other options that may be available.
Effective July 2013, Fannie Mae no longer purchases loans with down payments of less than 5% (subject to certain limited exceptions). Freddie Mac has had a similar policy in place since June 2011. We believe this will limit the demand for private mortgage insurance on loans with down payments below 5%. In addition, FHFA issued
109
a proposal recently to reduce GSE loan limits. If implemented, these actions could also limit demand for mortgage loans with private mortgage insurance coverage. In August 2013, U.S. federal regulators issued a notice of revised proposed rules to implement the credit risk retention provision under the Dodd-Frank Act. The revised rules propose to define “qualified residential mortgages” to include low-down-payment mortgage loans, which is consistent with the definition of qualified residential mortgages that is already adopted by the CFPB. If finalized, this rule would have the effect of including many low-down-payment mortgage loans within the definition of qualified residential mortgage, which could increase the demand for mortgage loans with private mortgage insurance coverage.
While we continue to experience an ongoing decrease in the level of new delinquencies, the performance of our portfolio continues to be adversely affected by our 2005 through 2008 book years, although we believe these loans peaked in their delinquency development during the first quarter of 2010. Albeit at a lower level, delinquencies for these book years continue to drive the level of new delinquencies reported to us. Beginning in mid-2010, we saw an increase in foreclosure starts as well as an increase in our paid claims as late stage delinquency loans go through foreclosure. While foreclosure starts remain elevated through current periods, we are seeing a decline in the number of foreclosure starts. This decrease in the number of foreclosure starts, along with the declining rate at which foreclosures are initiated, were consistent with the current lower level of early stage or pre-foreclosure delinquencies within our delinquency inventory. In addition, we saw material differences in performance among loan servicers regarding the ability to modify loans. Suspensions and delays of foreclosure actions in response to problems associated with lender and servicer foreclosure process changes and defects have caused, and could further cause, claim payments to be deferred to later periods and potentially have an adverse impact on the timing of a recovery of the U.S. residential mortgage market. Several major servicers reached agreement in principle in February 2012 with the U.S. Department of Justice, various federal agencies and 49 state attorneys general on servicing practices, and this could adversely affect timelines for claims submissions or administration actions. In addition, the joint announcement in early January 2013 by two key federal regulators of a negotiated agreement with 10 mortgage servicing firms would affect more than 3.8 million consumers who allegedly were wrongfully foreclosed upon during 2009 and 2010. Brokered by the Federal Reserve and the Office of the Comptroller of the Currency, mortgage servicing firms agreed to jointly pay foreclosed consumers $3.3 billion and allot another $5.2 billion for loan modifications and other services. The effect on us of these agreements remains uncertain at this time.
Expanded efforts in the mortgage servicing market to modify loans and improved performance of our 2009 through 2013 book years compared with the performance of prior book years, coupled with the diminished impact of our 2005 through 2008 book years as those loans are resolved, resulted in continued reductions in overall delinquency levels through 2013. As the aging of delinquencies continued to increase through 2011 and 2013, loan modification efforts have continued to remain more difficult to complete. Moreover, both foreclosures and liquidations remained elevated through the same period, thereby resulting in ongoing elevated levels of loss reserves and claims. We believe that the ability to cure delinquent loans is dependent upon such things as employment levels, home values and mortgage interest rates. In addition, while we continue to execute on our loan modification strategy, which cures the underlying delinquencies and improves the ability of borrowers to meet the debt service on the mortgage loans going forward, we have seen the level of loan modification actions moderating during 2011 through 2013 compared with the levels we experienced during 2010. We expect our level of loan modifications to continue declining going forward in line with expected declining delinquency counts. However, we further expect the rate at which we modify delinquent loans to remain steady as new programs take effect and the overall economy continues improving over time.
Our loss mitigation activities, including those relating to workouts, loan modifications, pre-sales, rescissions, claims administration (including curtailment of claim amounts) and targeted settlements, net of reinstatements or adjustments, resulted in an estimated reduction of expected losses of $563 million and $674 million, respectively, including $347 million and $357 million, respectively, from workouts and loan modifications during the years ended December 31, 2013 and 2012.
Since 2010, benefits from loss mitigation activities have shifted from rescissions to loan modification activities and reviews of loan servicing and claims administration compliance from which we expect a majority
110
of our loss mitigation benefits to arise going forward. While we expect to continue evaluating compliance of the insured or its loan servicer with respect to its servicing obligations under our master policy for loans insured thereunder and may curtail claim amounts payable based on our evaluations of such compliance, we cannot give assurance on the extent or level at which such claim curtailments will continue. Although loan servicers continue to pursue a wide range of approaches to execute appropriate loan modifications, government-sponsored programs such as Home Affordable Modification Program (“HAMP”) continue to result in fewer modifications as alternative programs have gained momentum. With lower benefits from government-sponsored programs and the impact from alternative programs to date, we have experienced higher levels of loss reserves and/or paid claims. Recently, the Obama Administration announced that it would extend HAMP through December 31, 2015, and expand borrower eligibility by adjusting certain underwriting requirements. In addition, incentives paid to the owner of a loan that qualifies for principal reduction under HAMP are being increased and, for the first time, will be offered to the GSEs. However, to date, the GSEs are not participating in this program. While the impact of the these program extensions to date has been positive, there can be no assurance that the increase in the number of loans that are modified under HAMP, including mortgage loans we insure currently, is sustainable over time or that any such modifications will succeed in avoiding foreclosure. Depending upon the mix of loss mitigation activity, market trends, employment levels in future periods and other general economic impacts which influence the U.S. residential housing market, we could see additional adverse loss reserve development going forward. We expect the primary source of new reserves and losses to come from new delinquencies.
We have reinsurance programs in place in which we share portions of our premiums associated with flow insurance written on loans originated or purchased by lenders with captive insurance entities of these lenders in exchange for an agreed upon level of loss coverage above a specified attachment point. We have exhausted certain captive reinsurance tiers for our 2004 through 2008 book years based on loss development trends. While we continue to receive cash benefits from these captive arrangements at the time of claim payment, the level of benefit is expected to continue to decline going forward due to exhaustion of reinsurance as more reinsurers satisfy their contractual obligations such that remaining risk is borne by GEMICO. All of our captive reinsurance arrangements are in runoff with no new books of business being added going forward. However, we will continue to consider new third-party reinsurance arrangements. In addition, in April 2013, GEMICO and other mortgage insurance companies agreed to settle with the CFPB to end the agency’s review of captive reinsurance arrangements in the mortgage insurance industry. As part of the settlement, GEMICO (and its affiliates, officers, employees and certain other related parties, including certain of Genworth Financial’s executive officers) are enjoined from entering into or revising certain reinsurance arrangements and violating any provisions of RESPA for a period of 10 years and GEMICO paid approximately $4 million.
As of December 31, 2013, GEMICO’s risk-to-capital ratio was below the maximum risk-to-capital ratio of 25:1 established under North Carolina law and enforced by the NCDOI, which is GEMICO’s domestic insurance regulator. Fifteen other states maintain similar risk-to-capital requirements. As of December 31, 2013, GEMICO’s risk-to-capital ratio was approximately 19.3:1, compared with a risk-to-capital ratio of approximately 36.9:1 as of December 31, 2012. GEMICO’s ongoing risk-to-capital ratio will depend principally on the magnitude of future losses incurred by GEMICO, the effectiveness of ongoing loss mitigation activities, new business volume and profitability, as well as the amount of policy lapses and the amount of additional capital that is generated within the business or capital support (if any) that we provide. Our estimate of the amount and timing of future losses is inherently uncertain, requires significant judgment and may change significantly over time. We expect to continue to manage GEMICO’s risk-to-capital ratio to be below the maximum regulatory requirement.
We have taken steps to improve the financial condition of our U.S. mortgage insurance business throughout 2013. In April 2013, we completed our Capital Plan that provided additional capital support and other benefits to our U.S. mortgage insurance business. The Capital Plan included a cash contribution of $100 million, the transfer of ownership of our European mortgage insurance subsidiaries to GEMICO, our primary U.S. mortgage insurance subsidiary, and our holding company reorganization. In addition, in December 2013, Genworth Holdings issued $400 million of senior notes in anticipation of increased capital requirements expected to be
111
imposed by the GSEs in connection with their revised MI Eligibility Standards. As of December 31, 2013, Genworth Financial contributed $100 million of the proceeds to GEMICO with an additional $300 million contributed to a U.S. mortgage holding company. The $100 million contribution in December 2013 to GEMICO, coupled with other performance-related actions, lowered GEMICO’s risk-to-capital ratio to approximately 19.3:1 as of December 31, 2013. We expect the $300 million contributed into our U.S. mortgage holding company will be further contributed to GEMICO, to the extent needed, for the benefit of its capital position after the changes to the asset and capital requirements in the revised GSE MI Eligibility Standards are finalized. In connection with this additional $300 million contribution to GEMICO, we will also evaluate the overall performance of our U.S. mortgage insurance business and conditions existing in the U.S. mortgage insurance industry at the time we decide to make the contribution. If the $300 million had been contributed to GEMICO, its risk-to-capital ratio as of December 31, 2013 would have been lower by approximately four points. In addition to the available funds held at the U.S. mortgage holding company, we have various alternatives available to us to manage GEMICO’s future capital position, including organic earnings growth; utilization of a portion of available deferred tax assets; possible reinsurance transactions; use of proceeds from the planned Australian IPO; issuance of convertible or exchangeable securities at the Genworth Financial and/or the Genworth Holdings levels; and other options that may be available. While there is no assurance that our U.S. mortgage insurance subsidiaries would meet any revised GSE capital-related requirements by their effective date, we currently believe that we could implement one or more of these alternatives so that we would continue to be an eligible provider of mortgage insurance after any new GSE capital-related requirements would be in effect.
GEMICO initially returned to compliance with maximum state regulatory risk-to-capital ratios of 25:1 as of April 30, 2013, and because it remains below the maximum risk-to-capital requirements, GEMICO does not currently face the associated limitations on its ability to write new business. As of January 20, 2014, all new business is being written out of GEMICO. Previously, beginning in 2010 through April 2013, GEMICO had exceeded its regulatory risk-to-capital levels and operated pursuant to regulatory forbearance (typically in the form of a waiver or the regulatory equivalent thereof) or we instead operated through affiliated insurers that met applicable state regulatory requirements and where we had obtained GSE approval of the affiliates as eligible insurers (subject to specified conditions). In Florida, we had been using an affiliated insurer because the state suspended GEMICO’s authority to write business there due to non-compliance with applicable risk-to-capital standards, but during the fourth quarter of 2013, the suspension was lifted and we obtained reauthorization of GEMICO’s authority to write business in Florida. Of the waivers and required approvals previously relied upon by GEMICO, four state waivers (one of which is North Carolina which permits us to write in other states with no explicit risk-to-capital requirements so long as North Carolina, as our domiciliary regulator, permits us to write) do not expire until July 31, 2014 (although the company plans to allow those waiver to expire pursuant to their terms in 2014); two state waivers expired by their terms on December 31, 2013; and each GSE’s approval in connection with the use of an alternative affiliated insurer (and the limitations imposed on the business contained therein) expired by their respective terms on December 31, 2013.
While it is our expectation that our U.S. mortgage insurance subsidiaries will continue to meet their regulatory capital requirements, should GEMICO in the future exceed required risk-to-capital levels, we would pursue required regulatory and GSE forbearance and approvals or pursue approval for the utilization of alternative insurance vehicles. However, there can be no assurance if, and on what terms, such forbearance and approvals may be obtained.
International Protection
Growth and performance of our lifestyle protection insurance business is dependent in part on economic conditions and other factors, including competitor actions, consumer lending and spending levels, unemployment trends, client account penetration and mortality and morbidity trends. Additionally, the types and mix of our products will vary based on regulatory and consumer acceptance of our products.
Consumer lending levels in Europe remain challenged particularly given concerns regarding various European economies and the effect of the European debt crisis. Unemployment rates increased slightly in the
112
fourth quarter of 2013 with regional variation; however, in aggregate, European gross domestic product grew in the fourth quarter of 2013, building on the growth in the third quarter of 2013 and reversing the negative trend experienced in 2012 and in the first half of 2013. Net operating income of our lifestyle protection insurance business in 2013 remained flat with 2012 as higher losses, lower premiums and lower net investment income were offset by lower operating and commission expenses and favorable taxes. New claim registrations decreased 18% in 2013 from 2012 levels. We could experience higher losses if claim registrations increase, particularly with continued rising unemployment in Europe. Our declining premiums in 2013 compared to 2012 contributed to a loss ratio of 25% for the year ended December 31, 2013 compared to 22% for year ended December 31, 2012.
In Southern Europe, stressed economies resulted in a decline in consumer lending where most of our insurance coverages attach as banks tightened lending criteria and consumer demand declined, while in Northern Europe consumer lending levels have stabilized. We have strengthened our focus in Europe on key strategic client relationships and are de-emphasizing our distribution with some other distributors where we are not expecting to achieve desired sales and profitability levels. This focus should enable us to better serve our strategic clients and promote improved profitability and a lower cost structure over time. Additionally, we continue to pursue expanding our geographical distribution into Latin America and China and have secured agreements with large insurance partners in both of these regions. We are currently working with these partners to establish product, distribution and servicing capabilities and anticipate bringing our products and services to the market in the near future.
Assuming the economies and lending environment in Europe are stable and do not improve in the near term, we expect our lifestyle protection insurance business to produce only slightly positive earnings in 2014. With our focus on enhanced distribution capabilities in Europe and growth in select new markets, we anticipate these efforts, coupled with sound risk and cost management disciplines, should, over time, improve profitability and help offset the impact of economic or employment pressures as well as lower levels of consumer lending in Europe. However, depending on the economic situation in Europe, we could experience additional declines in sales and operating results.
Distributor conduct associated with the sale of payment protection insurance products is currently under regulatory scrutiny in Ireland and Italy. The outcome of these reviews is unknown at this time, but impacts on how the product is distributed could have a negative impact on our sales.
Runoff
Results of our Runoff segment are affected by investment performance, interest rate levels, net interest spreads, equity market conditions, mortality, policyholder surrenders and scheduled maturities. In addition, the results of our Runoff segment can significantly impact our operating performance, regulatory capital requirements, distributable earnings and liquidity.
In January 2011, we discontinued sales of our individual and group variable annuities; however, we continue to service our existing block of business and accept additional deposits on existing contracts. Throughout 2012 and into 2013, equity market volatility has caused fluctuations in the results of our variable annuity products and regulatory capital requirements. In the future, equity and interest rate market performance and volatility could result in additional gains or losses in our variable annuity products although associated hedging activities are expected to partially mitigate these impacts. Volatility in the results of our variable annuity products can result in favorable or unfavorable impacts on earnings and statutory capital. In addition to the use of hedging activities to help mitigate impacts related to equity market volatility and interest rate risks, in the future, we may pursue reinsurance opportunities to further mitigate volatility in results and manage capital.
The results of our institutional products are impacted by scheduled maturities, as well as liquidity levels. However, we believe our liquidity planning and our asset-liability management will mitigate this risk. During the
113
year ended December 31, 2013, we paid benefits related to these products of $1.3 billion. While we do not actively sell institutional products, we may periodically issue funding agreements for asset-liability matching purposes.
We expect to manage our runoff products for at least the next several years. Several factors may impact the time period for these products to runoff including the specific policy types, economic conditions and management strategies.
Critical Accounting Estimates
The accounting estimates discussed in this section are those that we consider to be particularly critical to an understanding of our consolidated financial statements because their application places the most significant demands on our ability to judge the effect of inherently uncertain matters on our financial results. For all of these policies, we caution that future events seldom develop exactly as forecasted, and management’s best estimates may require adjustment.
Valuation of fixed maturity securities. Our portfolio of fixed maturity securities is comprised primarily of investment grade securities, which are carried at fair value.
Estimates of fair values for fixed maturity securities are obtained primarily from industry-standard pricing methodologies utilizing market observable inputs. For our less liquid securities, such as our privately placed securities, we utilize independent market data to employ alternative valuation methods commonly used in the financial services industry to estimate fair value. Based on the market observability of the inputs used in estimating the fair value, the pricing level is assigned.
The following tables summarize the primary sources of data considered when determining fair value of each class of fixed maturity securities as of December 31:
| 2013 | ||||||||||||||||
| (Amounts in millions) |
Total | Level 1 | Level 2 | Level 3 | ||||||||||||
| Fixed maturity securities: |
||||||||||||||||
| Pricing services |
$ | 52,451 | $ | — | $ | 52,451 | $ | — | ||||||||
| Broker quotes |
1,488 | — | — | 1,488 | ||||||||||||
| Internal models |
4,690 | — | 654 | 4,036 | ||||||||||||
|
|
|
|
|
|
|
|
|
|||||||||
| Total fixed maturity securities |
$ | 58,629 | $ | — | $ | 53,105 | $ | 5,524 | ||||||||
|
|
|
|
|
|
|
|
|
|||||||||
| 2012 | ||||||||||||||||
| (Amounts in millions) |
Total | Level 1 | Level 2 | Level 3 | ||||||||||||
| Fixed maturity securities: |
||||||||||||||||
| Pricing services |
$ | 55,935 | $ | — | $ | 55,935 | $ | — | ||||||||
| Broker quotes |
1,141 | — | — | 1,141 | ||||||||||||
| Internal models |
5,085 | — | 486 | 4,599 | ||||||||||||
|
|
|
|
|
|
|
|
|
|||||||||
| Total fixed maturity securities |
$ | 62,161 | $ | — | $ | 56,421 | $ | 5,740 | ||||||||
|
|
|
|
|
|
|
|
|
|||||||||
See notes 2, 4 and 17 in our consolidated financial statements under “Item 8—Financial Statements and Supplementary Data” for additional information related to the valuation of fixed maturity securities and a description of the fair value measurement requirements and level assignments.
Other-than-temporary impairments on available-for-sale securities. As of each balance sheet date, we evaluate securities in an unrealized loss position for other-than-temporary impairments. For debt securities, we consider all available information relevant to the collectability of the security, including information about past
114
events, current conditions, and reasonable and supportable forecasts, when developing the estimate of cash flows expected to be collected. For equity securities, we recognize an impairment charge in the period in which we determine that the security will not recover to book value within a reasonable period.
See notes 2 and 4 in our consolidated financial statements under “Item 8—Financial Statements and Supplementary Data” for additional information related to other-than-temporary impairments on available-for-sale securities.
Derivatives. We enter into freestanding derivative transactions primarily to manage the risk associated with variability in cash flows or changes in fair values related to our financial assets and liabilities. We also use derivative instruments to hedge certain currency exposures. Additionally, we purchase investment securities, issue certain insurance policies and engage in certain reinsurance contracts that have embedded derivatives. The associated financial statement risk is the volatility in net income which can result from among other things: (i) changes in the fair value of derivatives not qualifying as accounting hedges; (ii) changes in the fair value of embedded derivatives required to be bifurcated from the related host contract; (iii) ineffectiveness of designated hedges; and (iv) counterparty default. Accounting for derivatives is complex, as evidenced by significant authoritative interpretations of the primary accounting standards which continue to evolve. See notes 2, 5 and 17 in our consolidated financial statements under “Item 8—Financial Statements and Supplementary Data” for an additional description of derivative instruments and fair value measurements of derivative instruments.
Deferred acquisition costs. DAC represents costs that are related directly to the successful acquisition of new and renewal insurance policies and investment contracts which are deferred and amortized over the estimated life of the related insurance policies. These costs primarily include commissions in excess of ultimate renewal commissions and underwriting and contract and policy issuance expenses for policies successfully acquired. DAC is subsequently amortized to expense in relation to the anticipated recognition of premiums or gross profits.
The amortization of DAC for traditional long-duration insurance products (including guaranteed renewable term life insurance, life-contingent structured settlements and immediate annuities and long-term care insurance) is determined as a level proportion of premium based on accepted actuarial methods and reasonable assumptions about mortality, morbidity, lapse rates, expenses, and future yield on related investments, established when the contract or policy is issued. U.S. GAAP requires that assumptions for these types of products not be modified (or unlocked) unless recoverability testing deems them to be inadequate. Amortization is adjusted each period to reflect policy lapse or termination rates as compared to anticipated experience. Accordingly, we could experience accelerated amortization of DAC if policies terminate earlier than originally assumed.
Amortization of DAC for annuity contracts without significant mortality risk and for investment and universal life insurance products is based on expected gross profits. Expected gross profits are adjusted quarterly to reflect actual experience to date or for the unlocking of underlying key assumptions based on experience studies such as mortality, withdrawal or lapse rates, investment spreads or maintenance expenses. The estimation of expected gross profits is subject to change given the inherent uncertainty as to the underlying key assumptions employed and the long duration of our policy or contract liabilities. Changes in expected gross profits reflecting the unlocking of underlying key assumptions could result in a material increase or decrease in the amortization of DAC depending on the magnitude of the change in underlying assumptions. Significant factors that could result in a material increase or decrease in DAC amortization for these products include material changes in withdrawal or lapse rates, investment spreads or mortality assumptions. For the years ended December 31, 2013, 2012 and 2011, key assumptions were unlocked in our U.S. Life Insurance and Runoff segments to reflect our current expectation of future investment spreads, lapse rates, mortality and reinsurance costs.
The amortization of DAC for mortgage insurance is based on expected gross margins. Expected gross margins, defined as premiums less losses, are set based on assumptions for future persistency and loss development of the business. These assumptions are updated for actual experience to date or as our expectations of future experience are revised based on experience studies. Due to the inherent uncertainties in making
115
assumptions about future events, materially different experience from expected results in persistency or loss development could result in a material increase or decrease to DAC amortization for this business. For the years ended December 31, 2013, 2012 and 2011, key assumptions were unlocked in our international mortgage insurance business to reflect our current expectation of future persistency and loss projections.
The following table sets forth the increase (decrease) in amortization of DAC related to unlocking of underlying key assumptions by segment for the years ended December 31:
| (Amounts in millions) |
2013 | 2012 | 2011 | |||||||||
| U.S. Life Insurance |
$ | 21 | $ | (45 | ) | $ | (15 | ) | ||||
| International Mortgage Insurance |
1 | 4 | 5 | |||||||||
| Runoff |
1 | 4 | — | |||||||||
|
|
|
|
|
|
|
|||||||
| Total |
$ | 23 | $ | (37 | ) | $ | (10 | ) | ||||
|
|
|
|
|
|
|
|||||||
The DAC amortization methodology for our variable products (variable annuities and variable universal life insurance) includes a long-term average appreciation assumption of 8.5%. When actual returns vary from the expected 8.5%, we assume a reversion to the expected return over a three-year period. The assumed returns over this reversion to the expected return period are limited to the 85th percentile of historical equity market performance.
We regularly review DAC to determine if it is recoverable from future income as part of our loss recognition testing. For deposit products, if the current present value of estimated future gross profits is less than the unamortized DAC for a line of business, a charge to income is recorded for additional DAC amortization, and for certain products, an increase in benefit reserves may be required. For other products, if the benefit reserves plus anticipated future premiums and interest income for a line of business are less than the current estimate of future benefits and expenses (including any unamortized DAC), a charge to income is recorded for additional DAC amortization and potentially an increase in benefit reserves, to address any premium deficiency. The establishment of such a reserve is subject to inherent uncertainty and requires significant judgment and estimates to determine the present values of future premium, estimated gross profits and expected losses and expenses of our businesses. As of December 31, 2013, we believe all of our businesses have sufficient future income where the related DAC is recoverable based on our best estimates of morbidity, mortality, expected premiums, claim loss development, withdrawal or lapse rate, maintenance expense, or interest rates expected to occur.
Continued low interest rates have impacted the margins on our fixed immediate annuity products. As of December 31, 2013 and 2012, we had margin of approximately $78 million and $73 million, respectively, on $6,526 million and $6,830 million, respectively, of net U.S. GAAP liability related to our fixed immediate annuity products. The risks we face include adverse variations in interest rates and/or mortality. As of December 31, 2013 and 2012, we had DAC of $28 million and $31 million, respectively, related to our immediate annuity products. Adverse experience in one or both of these risks could result in the DAC associated with our immediate annuity products being no longer fully recoverable as well as the establishment of additional benefit reserves. As of December 31, 2013, for our immediate annuity products, 50 basis points lower interest rates and 2% lower mortality, which we consider reasonably possible, would result in margin reduction of approximately $20 million and $26 million, respectively. Margin reduction below zero results in a charge to current period earnings. Any favorable variation would result in additional margin in our DAC loss recognition analysis and would result in higher income recognition over the remaining duration of the in-force block. As of December 31, 2013, we believe all of our other businesses have sufficient future income where the related DAC would be recoverable under adverse variations in morbidity, mortality, claim loss development, withdrawal or lapse rate, maintenance expense or interest rates that could be considered reasonably possible to occur.
For the years ended December 31, 2013 and 2011, there were no charges to income as a result of our DAC loss recognition testing. As part of a life block transaction in the third quarter of 2012, we recorded $39 million of additional DAC amortization to reflect loss recognition on certain term life insurance policies under a
116
reinsurance treaty. See notes 2 and 6 in our consolidated financial statements under “Item 8—Financial Statements and Supplementary Data” for additional information related to DAC.
Present value of future profits. In conjunction with the acquisition of a block of insurance policies or investment contracts, a portion of the purchase price is assigned to the right to receive future gross profits arising from existing insurance and investment contracts. This intangible asset, called PVFP, represents the actuarially estimated present value of future cash flows from the acquired policies. PVFP is amortized, net of accreted interest, in a manner similar to the amortization of DAC.
We regularly review our assumptions and periodically test PVFP for recoverability in a manner similar to our treatment of DAC. As of December 31, 2013, we believe all of our businesses have sufficient future income where the related PVFP is recoverable based on our best estimates of morbidity, mortality, withdrawal or lapse rate, maintenance expense, premiums and interest rates that are expected to occur.
Continued low interest rates, lower than expected termination rates and resulting higher than anticipated number of claims have impacted the margins on our acquired long-term care insurance business. As of December 31, 2013 and 2012, we had margin of approximately $156 million and $17 million, respectively, on $2,529 million and $2,657 million, respectively, of net U.S. GAAP liability related to our individual and group long-term care insurance products. The risks we face include adverse variations in morbidity, interest rates, lapse and mortality. Adverse variation in one or more of these risks could result in additional amortization of PVFP or the establishment of additional benefit reserves. As of December 31, 2013, adverse variation that we consider reasonably possible would result in an additional charge to income of up to approximately $41 million. However, more adverse variation could result in additional amortization of PVFP or establishment of additional benefit reserves, while any favorable variation would result in additional margin in our PVFP loss recognition analysis and would result in higher earnings recognition over the remaining duration of the in-force block. As of December 31, 2013, we believe all of our other businesses have sufficient future income where the related PVFP would be recoverable under adverse variations in morbidity, mortality, expected premiums, claim loss development, withdrawal or lapse rate, maintenance expense or interest rates that could be considered reasonably possible to occur.
For the years ended December 31, 2013, 2012, and 2011, there were no charges to income as a result of our PVFP recoverability testing. See notes 2 and 7 in our consolidated financial statements under “Item 8—Financial Statements and Supplementary Data” for additional information related to PVFP.
Goodwill. Goodwill represents the excess of the amounts paid to acquire a business over the fair value of its net assets at the date of acquisition. Subsequent to acquisition, goodwill could become impaired if the fair value of a reporting unit as a whole were to decline below the value of its individually identifiable assets and liabilities. This may occur for various reasons, including changes in actual or expected income or cash flows of a reporting unit or generation of income by a reporting unit at a lower rate of return than similar businesses.
Under U.S. GAAP, we test the carrying value of goodwill for impairment at least annually at the “reporting unit” level, which is either an operating segment or a business one level below the operating segment. Under certain circumstances, interim impairment tests may be required if events occur or circumstances change that would more likely than not reduce the fair value of a reporting unit below its carrying value.
The determination of fair value for our reporting units is primarily based on an income approach whereby we use discounted cash flows for each reporting unit. When available, and as appropriate, we use market approaches or other valuation techniques to corroborate discounted cash flow results. The discounted cash flow model used for each reporting unit is based on either operating income or statutory distributable income, depending on the reporting unit being valued.
For the operating income model, we determine fair value based on the present value of the most recent income projections for each reporting unit and calculate a terminal value utilizing a terminal growth rate. We
117
primarily utilize the operating income model to determine fair value for all reporting units except for our life and long-term care insurance reporting units. In addition to the operating income model, we also consider the valuation of our Canadian mortgage insurance subsidiary’s publicly traded stock price in determining fair value for that reporting unit. The significant assumptions in the operating income model include: income projections, which are dependent on new business production, customer behavior, operating expenses and market conditions; discount rate; and terminal growth rate.
For the statutory distributable income model, we determine fair value based on the present value of projected statutory net income and changes in required capital to determine distributable income for the respective reporting unit. We utilize the statutory distributable income model to determine fair value for our life and long-term care insurance reporting units. The significant assumptions in the statutory distributable income model include: required capital levels; income projections, which are dependent on mortality or morbidity, new business production growth, new business projection period, policyholder behavior and other specific industry and market conditions; and discount rate.
The cash flows used to determine fair value are dependent on a number of significant assumptions based on our historical experience, our expectations of future performance and expected economic environment. We determine the best estimate of our income projections based on current market conditions as well as our expectation of future market conditions. Our estimates of projected income are subject to change given the inherent uncertainty in predicting future results. Additionally, the discount rate used to determine fair value is based on our judgment of the appropriate rate for each reporting unit based on the relative risk associated with the projected cash flows as well as our expectation of the discount rate that would be utilized by a hypothetical market participant.
We consider our market capitalization in assessing the reasonableness of the fair values estimated for our reporting units in connection with our goodwill impairment testing. In prior years, we impaired all goodwill associated with our U.S. mortgage and lifestyle protection insurance businesses as well as our annuity and institutional products. Accordingly, these businesses are no longer subject to goodwill impairment testing but do have a significant impact on our market capitalization in comparison to our book value. When reconciling to our market capitalization, we estimate the fair value for these businesses and also consider the negative value that would be associated with corporate debt, which would be subtracted from the fair value of our businesses to calculate the total value attributed to equity holders. We then compare the total value attributed to equity holders to our market capitalization.
During the third quarter of 2013, we completed our annual goodwill impairment analysis as of July 1, 2013. As a result of this analysis, we determined fair value was in excess of book value for all of our reporting units with goodwill, except for our long-term care insurance reporting unit discussed further below. While the remaining reporting units with goodwill had fair values in excess of their respective book values, we noted that our life insurance reporting unit had a fair value that was relatively close to book value and was at greater risk compared to our other reporting units of fair value being below book value in the future.
As part of our annual goodwill impairment testing, we noted that our long-term care insurance reporting unit’s fair value continues to be less than its book value. If fair value is lower than book value, the reporting unit’s fair value is allocated to assets and liabilities as if the reporting unit had been acquired in a business combination with the amount of goodwill being established representing the “implied goodwill” amount that is recoverable. If this “implied goodwill” exceeds the reporting unit’s recorded goodwill balance, goodwill is deemed recoverable. Accordingly, we evaluated our long-term care insurance reporting unit’s goodwill balance of $354 million and determined that the amount of implied goodwill exceeded the amount of goodwill currently recorded by more than 100%. Accordingly, goodwill was recoverable and not impaired.
The key assumptions that impact our evaluation of goodwill for our long-term care insurance reporting unit under our goodwill impairment assessment primarily relate to the discount rate utilized to determine the present
118
value of the projected cash flows and the valuation of new business. While the valuation of our in-force business for long-term care insurance is included in the fair value of the reporting unit, the in-force value does not contribute significant, incremental value to support goodwill. Based on a hypothetical acquisition under our goodwill impairment assessment, any difference in our current carrying value and the fair value of our in-force business would be associated with an intangible asset for the present value of future profits and would not create additional implied goodwill.
We utilized a discount rate for our long-term care insurance reporting unit of 14% based on our estimate of the weighted-average cost of capital that a hypothetical market participant would use in assessing the value of the business. The valuation of new business is determined by utilizing several inputs such as expected new business production for the next 10 years, which is primarily dependent on policyholder assumptions, expected investment returns and targeted capital levels. The inclusion of 10 years of new business production is based on our experience of actuarial appraisals for life insurance companies where this is a common assumption. Annual sales projections included in our determination of fair value for our long-term care insurance reporting unit were projected to increase to approximately $200 million over the first five years and remaining constant at approximately $200 million per year for the remainder of the 10 year new business projection period. These new business sales projections are relatively consistent with recent sales levels. Significant changes in the expected new business production that would be used by a hypothetical market participant could result in a future impairment of goodwill.
In our annual goodwill assessment of our life insurance reporting unit, we used our best estimate of the future performance of the business and discounted these projections using a 10% discount rate. We determined the discount rate assumption used in our valuation based on our estimate of the weighted-average cost of capital that a hypothetical market participant would use in assessing the value of the business. Based on our annual goodwill impairment testing, our life insurance reporting unit’s fair value exceeded book value by approximately 15% with a goodwill balance of $495 million.
As a result of relatively low sales for our life insurance reporting unit that continued during the fourth quarter of 2013, we lowered our near-term sales projections and evaluated the impact on fair value of the reporting unit. The near-term changes in sales reduced the fair value of our life insurance reporting unit, but the fair value still exceeds its book value by approximately 10%. However, future changes that would establish longer-term sales projections at levels similar to our near-term projections could result in a goodwill impairment for our life insurance reporting unit. The annual sales projections included in the determination of fair value for our life insurance reporting unit as of December 31, 2013 were projected to increase to approximately $220 million over the first five years and remaining constant at approximately $220 million per year for the remainder of the 10 year new business projection period with the mix of sales projected to be relatively evenly split between term and universal life insurance. While these projected sales are significantly higher than 2013 sales of $57 million, such sales levels are similar to recent historical sales levels and are projected to be attainable as a result of re-pricing certain products, introducing new products or features, certain sales growth initiatives, or a combination of these actions. Changes in projected new business volume as well as market conditions, new business product mix, or regulatory environment could have a significant impact on our life insurance reporting unit’s fair value and could result in recognizing a future goodwill impairment. As we consider our sales levels going forward, our projections may change, and we will continue to closely monitor any potential changes in our sales projections that could impact our goodwill impairment testing results for our life insurance reporting unit.
In the third quarter of 2012, considering current market conditions, including the market environment in Europe, lower trading multiples of European financial services companies and the impact of those conditions on our international protection reporting unit in a market transaction that may require a higher risk premium, we determined the fair value of the reporting unit was below book value and determined the goodwill associated with this reporting unit was not recoverable. Therefore, we recorded a goodwill impairment of $89 million for the write-off of all of the goodwill associated with our international protection reporting unit in the third quarter of 2012.
119
During the fourth quarter of 2011, as a result of our reorganized operating segments, our reverse mortgage business was newly identified as a separate reporting unit. Previously, this business was a component of the long-term care insurance reporting unit. Due to historical business performance and recent adverse developments within the industry that negatively impacted the valuation of the business, we impaired all of the goodwill related to our reverse mortgage business reported in Corporate and Other activities in the fourth quarter of 2011. The key assumptions utilized in this valuation included expected future business performance and the discount rate, both of which were adversely impacted as a result of the recent industry developments.
Deteriorating or adverse market conditions for certain businesses may have a significant impact on the fair value of our reporting units and could result in future impairments of goodwill.
See notes 2 and 8 in our consolidated financial statements under “Item 8—Financial Statements and Supplementary Data” for additional information related to goodwill.
Insurance liabilities and reserves. We calculate and maintain reserves for the estimated future payment of claims to our policyholders and contractholders based on actuarial assumptions and in accordance with industry practice and U.S. GAAP. Many factors can affect these reserves, including, but not limited to, interest rates, economic and social conditions, mortality and morbidity trends, inflation, healthcare experience, changes in doctrines of legal liability and damage awards in litigation. Therefore, the reserves we establish are necessarily based on estimates, assumptions and our analysis of historical experience. Our results depend significantly upon the extent to which our actual claims experience is consistent with the assumptions we used in determining our reserves and pricing our products. Our reserve assumptions and estimates require significant judgment and, therefore, are inherently uncertain. We cannot determine with precision the ultimate amounts that we will pay for actual claims or the timing of those payments.
Insurance reserves differ for long- and short-duration insurance policies. Measurement of long-duration insurance reserves (such as guaranteed renewable term life insurance, annuity and long-term care insurance products) is based on approved actuarial methods, and includes assumptions about expenses, mortality, morbidity, lapse rates and future yield on related investments. Short-duration contracts (such as lifestyle protection insurance) are accounted for based on actuarial estimates of the amount of loss inherent in that period’s claims, including losses incurred for which claims have not been reported. Short-duration contract loss estimates rely on actuarial observations of ultimate loss experience for similar historical events.
The liability for future policy benefits of our long-term care insurance products represents the present value of such future benefits, less the present value of future net premiums based on assumptions as to future interest rates, lapse, morbidity and other factors, which are determined and locked-in during the year the policies are issued. These reserves are evaluated for potential reserve deficiencies in the aggregate using current assumptions, except for the purchased block of long-term care insurance products that are evaluated as a part of PVFP. Currently, the assumptions that have the most significant impact on our margins are morbidity, lapse rates, in-force rate increases and discount rate. Our morbidity and lapse assumptions are based on our most recent experience. Our morbidity assumption includes an average of 1.6% annual improvement for 10 years across all products and is based on observed improvement in claim incidence rates with each successive generation of underwriting standards, with variations by policy duration, issue year and issue age. Our lapse assumption represents an average ultimate lapse rate of 0.7% based on our experience where lapses rates have been decreasing by policy duration. Our assumption for in-force rate increases is that the annual premiums will increase by $280 million through 2017 and is based on our best estimate of the rate increases we expect using our historical experience from rate increase approvals. We assume a static discount rate of 5.9%, which represents our expected investment returns based on the portfolio of assets supporting the net U.S. GAAP liability as of the calculation date and, therefore, excluded the benefits of qualifying hedge gains that are not currently amortizing. Using these assumptions, we determined our long-term care insurance net U.S. GAAP liability was sufficient with a loss recognition testing margin in the aggregate of approximately $3.2 billion as of December 31, 2013. Between 2012 and 2013, our morbidity trends were consistent with our expected experience, whereas our
120
portfolio yield for the assets backing our net U.S. GAAP liability declined from 6.0% to 5.9%, which reduced our margins but did not require us to establish additional reserves and, therefore, did not impact our results of operations. Our expected ultimate lapse rate assumptions were 1.9% or lower, depending on the product, and did not change between 2012 and 2013 because they were consistent with our experience, and therefore, did not impact our results of operations.
The liability for policy and contract claims for our long-term care insurance products represents the amount needed to provide for the estimated ultimate cost of settling claims relating to insured events that have occurred on or before the end of the respective reporting period. We monitor actual experience, and when circumstances warrant, revise our assumptions. The methods of determining such estimates and establishing the reserves are reviewed continuously and any adjustments are reflected in operations in the period in which they become known. We included a declining trend in interest rates in our current reserve assumptions, reflecting investment performance from the continued low interest rate environment, which did not materially impact our reserves in 2013.
Health care experience is a factor we also consider in establishing reserves for our long-term care insurance business, but the cost of health care is not closely correlated to trends in long-term care insurance claim experience. Accordingly, increasing health care costs have not materially impacted our liability for future policy benefits or liability for policy and contract claims.
Estimates of mortgage insurance reserves for losses and loss adjustment expenses are based on notices of mortgage loan defaults and estimates of defaults that have been incurred but have not been reported by loan servicers, using assumptions developed based on past experience and our expectation of future development. These assumptions include claim rates for loans in default, the average amount paid for loans that result in a claim and an estimate of the number of loans in our delinquency inventory that will be rescinded or modified (collectively referred to as “loss mitigation actions”) based on the effects that such loss mitigation actions have had on our historical claim frequency rates, including an estimate for reinstatement of previously rescinded coverage. Each of these assumptions is established by management based on historical and expected experience. We have established processes, as well as contractual rights, to ensure we receive timely information from loan servicers to aid us in the establishment of our estimates. In addition, when we have obtained sufficient facts and circumstances through our investigative process, we have the unilateral right under our master policies and at law to rescind coverage ab initio on the underlying loan certificate as if coverage never existed. As is common accounting practice in the mortgage insurance industry and in accordance with U.S. GAAP, loss reserves are not established for future claims on insured loans that are not currently in default.
Management reviews quarterly the loss reserves for adequacy, and if indicated, updates the assumptions used for estimating and calculating such reserves based on actual experience and our historical frequency of claim and severity of loss rates that are applied to the current population of delinquencies. Factors considered in establishing loss reserves include claim frequency patterns (reflecting the loss mitigation actions on such claim patterns), the aged category of the delinquency (i.e., age and progression of delinquency to claim) and loan coverage percentage. The establishment of our mortgage insurance loss reserves is subject to inherent uncertainty and requires judgment by management. The actual amount of the claim payments may vary significantly from the loss reserve estimates. Our estimates could be adversely affected by several factors, including, but not limited to, a deterioration of regional or national economic conditions leading to a reduction in borrowers’ income and thus their ability to make mortgage payments, a drop in housing values that could expose us to greater loss on resale of properties obtained through foreclosure proceedings and an adverse change in the effectiveness of loss mitigation actions that could result in an increase in the frequency of expected claim rates. Our estimates are also affected by the extent of fraud and misrepresentation that we uncover in the loans that we have insured and the coverage upon which we have consequently rescinded or may rescind going forward. Our loss reserving methodology includes estimates of the number of loans in our delinquency inventory that will be rescinded or modified, as well as estimates of the number of loans for which coverage may be reinstated under certain conditions following a rescission action.
121
In considering the potential sensitivity of the factors underlying management’s best estimate of our U.S. and international mortgage insurance reserves for losses, it is possible that even a relatively small change in estimated claim rate (“frequency”) or a relatively small percentage change in estimated claim amount (“severity”) could have a significant impact on reserves and, correspondingly, on results of operations. Based on our actual experience during the three-year period ended December 31, 2013 in our U.S. mortgage insurance business, a reasonably possible quarterly change could be a 9% change in the average frequency reserve factor, which would change the gross reserve amount for such quarter by approximately $204 million for our U.S. mortgage insurance business. Based on our actual experience during 2013 in our international mortgage insurance business, a reasonably possible quarterly change could be a $1,000 change in the average severity reserve factor combined with a 1% change in the average frequency reserve factor, which would change the gross reserve amount by approximately $21 million for our international mortgage insurance business based on current exchange rates. As these sensitivities are based on our 2013 experience, given the high level of uncertainty in the economic environment, there is a reasonable likelihood that these changes in assumptions could occur in the near term. Adjustments to our reserve estimates are reflected in the consolidated financial statements in the years in which the adjustments are made.
In addition to the sensitivities discussed above, certain books of business in both our U.S. and certain international mortgage insurance businesses have experienced higher losses as a result of the global economic environment. In our U.S. mortgage insurance business, our 2005 through 2008 books of business have been experiencing delinquencies and incurred losses substantially higher than those generated from previous book years we have written. Early loss development patterns from these book years indicate that we would expect a higher level of total losses generated. Variations we consider reasonably possible could include an increase of 10% in these expected losses over a three-year period ending December 31, 2016 that would result in a decrease in after-tax operating results of approximately $37 million. Additional adverse variation could result in additional negative impacts while favorable variations would result in improved margins. Regardless of the ultimate loss development pattern on these books, we expect they will continue to generate significant paid and incurred losses for at least the next two years and thus will continue to have a significant adverse impact on our operating results over these same periods.
In our international mortgage insurance business, we anticipate reduced levels of losses as a result of stable housing markets and economies. However, if housing markets and economies do not remain stable and instead deteriorate, we may experience increased losses. Variations we consider reasonably possible to occur could include an increase in projected losses for our international mortgage insurance business of between 45% and 50% over the next year. If changes at these levels were to occur, after-tax operating results could be negatively impacted by approximately $90 million to approximately $100 million over this same period based on current foreign exchange rates and leaving other assumptions constant. The potential for either additional adverse loss development or favorable loss development exists that could further impact our business underwriting margins.
Unearned premiums. In our international mortgage insurance business, the majority of our insurance contracts are single premium. For single premium insurance contracts, we recognize premiums over the policy life in accordance with the expected pattern of risk emergence. We recognize a portion of the revenue in premiums earned in the current period, while the remaining portion is deferred as unearned premiums and earned over time in accordance with the expected pattern of risk emergence. If single premium policies are cancelled and the premium is non-refundable, then the remaining unearned premium related to each cancelled policy is recognized to earned premiums upon notification of the cancellation, if not included in our expected earnings pattern. The expected pattern of risk emergence on which we base premium recognition is inherently judgmental and is based on actuarial analysis of historical and expected experience. Changes in market conditions could cause a decline in mortgage originations, mortgage insurance penetration rates or our market share, all of which could impact new insurance written. For example, a decline in flow new insurance written of $1.0 billion would result in approximately a $4 million reduction in earned premiums in the first full year based on current pricing and expected pattern of risk emergence. However, this decline would be partially offset by the recognition of earned premiums from established unearned premium reserves primarily from the last three years of business.
122
As of December 31, 2013 and 2012, we had $4.1 billion and $4.3 billion, respectively, of unearned premiums, of which $2.8 billion and $3.1 billion, respectively, related to our international mortgage insurance business. We recognize international mortgage insurance unearned premiums over a period of up to 20 years, most of which are recognized between three and seven years from issue date. The recognition of earned premiums for our international mortgage insurance business involves significant estimates and assumptions as to future loss development and policy cancellations. These assumptions are based on our historical experience and our expectations of future performance, which are highly dependent on assumptions as to long-term macroeconomic conditions including interest rates, home price appreciation and the rate of unemployment. We regularly review our expected pattern of risk emergence and make adjustments based on actual experience and changes in our expectation of future performance with any adjustments reflected in current period income. For the years ended December 31, 2013, 2012 and 2011, increases to earned premiums in our international mortgage insurance business as a result of adjustments made to our expected pattern of risk emergence and policy cancellation assumptions were $12 million, $36 million and $46 million, respectively.
Our expected pattern of risk emergence for our international mortgage insurance business is subject to change given the inherent uncertainty as to the underlying loss development and policy cancellation assumptions and the long duration of our international mortgage insurance policy contracts. Actual experience that is different than expected for loss development or policy cancellations could result in a material increase or decrease in the recognition of earned premiums depending on the magnitude of the difference between actual and expected experience. Loss development and policy cancellation variations that could be considered reasonably possible to occur in the future could result in an increase in after-tax operating results of up to $90 million or a decrease in after-tax operating results of up to $29 million, depending on the magnitude of variation experienced and leaving other assumptions constant. It is important to note that the variation discussed above is not meant to be a best-case or worst-case scenario, and therefore, it is possible that future variation may exceed the amounts discussed above.
In our U.S. mortgage insurance business, the majority of our insurance contracts have recurring premiums. We recognize recurring premiums over the terms of the related insurance policy on a pro-rata basis (i.e., monthly). Changes in market conditions could cause a decline in mortgage originations, mortgage insurance penetration rates and our market share, all of which could impact new insurance written. For example, a decline in flow new insurance written of $1.0 billion would result in a reduction in earned premiums of approximately $5 million in the first full year. Likewise, if flow persistency declined on our existing insurance in-force by 10%, earned premiums would decline by approximately $55 million during the first full year, potentially offset by lower reserves due to policies no longer being in force.
The remaining portion of our unearned premiums relates to our lifestyle protection and long-term care insurance businesses where the underlying assumptions as to risk emergence are not subject to significant uncertainty. Accordingly, changes in underlying assumptions as to premium recognition we consider being reasonably possible for these businesses would not result in a material impact on our results of operations.
Valuation of deferred tax assets. Deferred tax assets represent the tax benefit of future deductible temporary differences and operating loss and tax credit carryforwards. Deferred tax assets are measured using the enacted tax rates expected to be in effect when such benefits are realized if there is no change in tax law. Under U.S. GAAP, we test the value of deferred tax assets for impairment on a quarterly basis at our taxpaying component level within each tax jurisdiction, consistent with our filed tax returns. Deferred tax assets are reduced by a valuation allowance if, based on the weight of available evidence, it is more likely than not that some portion, or all, of the deferred tax assets will not be realized. In determining the need for a valuation allowance, we consider carryback capacity, reversal of existing temporary differences, future taxable income and tax planning strategies. Tax planning strategies are actions that are prudent and feasible, that an entity ordinarily might not take, but would take to prevent an operating loss or tax credit carryforward from expiring unused. The determination of the valuation allowance for our deferred tax assets requires management to make certain judgments and assumptions regarding future operations that are based on our historical experience and our expectations of future
123
performance. Our judgments and assumptions are subject to change given the inherent uncertainty in predicting future performance, which is impacted by, but not limited to, policyholder behavior, competitor pricing, new product introductions, and specific industry and market conditions. Tax planning strategies are incorporated into our analysis and assessment. Based on our analysis, we believe it is more likely than not that the results of future operations and the implementation of tax planning strategies will generate sufficient taxable income to enable us to realize the deferred tax assets for which we have not established valuation allowances.
As of December 31, 2013, we had a net deferred tax liability of $206 million with a $312 million valuation allowance related to state deferred tax assets, foreign net operating losses and a specific federal separate tax return net operating loss deferred tax asset. We have a consolidated gross deferred tax asset of $1,762 million related to NOL carryforwards of $5,059 million as of December 31, 2013, which, if unused, will expire beginning in 2021. Foreign tax credit carryforwards amounted to $432 million as of December 31, 2013, which, if unused, will begin to expire in 2014.
Deferred taxes on permanently reinvested foreign income. We do not record U.S. deferred taxes on foreign income that we do not expect to remit or repatriate to U.S. corporations within our consolidated group. Under U.S. GAAP, we are generally required to record U.S. deferred taxes on the anticipated repatriation of foreign income as the income is recognized for financial reporting purposes. An exception under certain accounting guidance permits us not to record a U.S. deferred tax liability for foreign income that we expect to reinvest in our foreign operations and for which remittance will be postponed indefinitely. If it becomes apparent that some or all undistributed income will be remitted in the foreseeable future, the related deferred taxes are recorded in that period. In determining indefinite reinvestment, we regularly evaluate the capital needs of our domestic and foreign operations considering all available information, including operating and capital plans, regulatory capital requirements, parent company financing and cash flow needs, as well as the applicable tax laws to which our domestic and foreign subsidiaries are subject. Our estimates are based on our historical experience and our expectation of future performance. Our judgments and assumptions are subject to change given the inherent uncertainty in predicting future capital needs, which are impacted by such things as regulatory requirements, policyholder behavior, competitor pricing, new product introductions, and specific industry and market conditions. As of December 31, 2013, U.S. deferred income taxes were not provided on approximately $3,019 million of unremitted foreign income we considered permanently reinvested. Our international businesses held cash and short-term investments of $464 million related to the unremitted earnings of foreign operations considered to be permanently reinvested as of December 31, 2013.
Contingent liabilities. A liability is contingent if the amount is not presently known, but may become known in the future as a result of the occurrence of some uncertain future event. We estimate our contingent liabilities based on management’s estimates about the probability of outcomes and their ability to estimate the range of exposure. Accounting standards require that a liability be recorded if management determines that it is probable that a loss has occurred and the loss can be reasonably estimated. In addition, it must be probable that the loss will be confirmed by some future event. As part of the estimation process, management is required to make assumptions about matters that are by their nature highly uncertain.
The assessment of contingent liabilities, including legal and income tax contingencies, involves the use of estimates, assumptions and judgments. Management’s estimates are based on their belief that future events will validate the current assumptions regarding the ultimate outcome of these exposures. However, there can be no assurance that future events, such as court decisions or IRS positions, will not differ from management’s assessments. Whenever practicable, management consults with third-party experts (including attorneys, accountants and claims administrators) to assist with the gathering and evaluation of information related to contingent liabilities. Based on internally and/or externally prepared evaluations, management makes a determination whether the potential exposure requires accrual in the consolidated financial statements.
124
Consolidated Results of Operations
The following is a discussion of our consolidated results of operations and should be read in conjunction with “—Business trends and conditions.” For a discussion of our segment results, see “—Results of Operations and Selected Financial and Operating Performance Measures by Segment.”
The following table sets forth the consolidated results of operations for the periods indicated:
| Years ended December 31, | Increase (decrease) and percentage change |
|||||||||||||||||||||||||||
| (Amounts in millions) |
2013 | 2012 | 2011 | 2013 vs. 2012 | 2012 vs. 2011 | |||||||||||||||||||||||
| Revenues: |
||||||||||||||||||||||||||||
| Premiums |
$ | 5,148 | $ | 5,041 | $ | 5,688 | $ | 107 | 2 | % | $ | (647 | ) | (11 | )% | |||||||||||||
| Net investment income |
3,271 | 3,343 | 3,380 | (72 | ) | (2 | )% | (37 | ) | (1 | )% | |||||||||||||||||
| Net investment gains (losses) |
(37 | ) | 27 | (195 | ) | (64 | ) | NM | (1) | 222 | 114 | % | ||||||||||||||||
| Insurance and investment product fees and other |
1,021 | 1,229 | 1,050 | (208 | ) | (17 | )% | 179 | 17 | % | ||||||||||||||||||
|
|
|
|
|
|
|
|
|
|
|
|||||||||||||||||||
| Total revenues |
9,403 | 9,640 | 9,923 | (237 | ) | (2 | )% | (283 | ) | (3 | )% | |||||||||||||||||
|
|
|
|
|
|
|
|
|
|
|
|||||||||||||||||||
| Benefits and expenses: |
||||||||||||||||||||||||||||
| Benefits and other changes in policy reserves |
4,895 | 5,378 | 5,941 | (483 | ) | (9 | )% | (563 | ) | (9 | )% | |||||||||||||||||
| Interest credited |
738 | 775 | 794 | (37 | ) | (5 | )% | (19 | ) | (2 | )% | |||||||||||||||||
| Acquisition and operating expenses, net of deferrals |
1,659 | 1,594 | 1,930 | 65 | 4 | % | (336 | ) | (17 | )% | ||||||||||||||||||
| Amortization of deferred acquisition costs and intangibles |
569 | 722 | 593 | (153 | ) | (21 | )% | 129 | 22 | % | ||||||||||||||||||
| Goodwill impairment |
— | 89 | 29 | (89 | ) | (100 | )% | 60 | NM | (1) | ||||||||||||||||||
| Interest expense |
492 | 476 | 506 | 16 | 3 | % | (30 | ) | (6 | )% | ||||||||||||||||||
|
|
|
|
|
|
|
|
|
|
|
|||||||||||||||||||
| Total benefits and expenses |
8,353 | 9,034 | 9,793 | (681 | ) | (8 | )% | (759 | ) | (8 | )% | |||||||||||||||||
|
|
|
|
|
|
|
|
|
|
|
|||||||||||||||||||
| Income from continuing operations before income taxes |
1,050 | 606 | 130 | 444 | 73 | % | 476 | NM | (1) | |||||||||||||||||||
| Provision (benefit) for income taxes |
324 | 138 | (11 | ) | 186 | 135 | % | 149 | NM | (1) | ||||||||||||||||||
|
|
|
|
|
|
|
|
|
|
|
|||||||||||||||||||
| Income from continuing operations |
726 | 468 | 141 | 258 | 55 | % | 327 | NM | (1) | |||||||||||||||||||
| Income (loss) from discontinued operations, net of taxes |
(12 | ) | 57 | 36 | (69 | ) | (121 | )% | 21 | 58 | % | |||||||||||||||||
|
|
|
|
|
|
|
|
|
|
|
|||||||||||||||||||
| Net income |
714 | 525 | 177 | 189 | 36 | % | 348 | 197 | % | |||||||||||||||||||
| Less: net income attributable to noncontrolling interests |
154 | 200 | 139 | (46 | ) | (23 | )% | 61 | 44 | % | ||||||||||||||||||
|
|
|
|
|
|
|
|
|
|
|
|||||||||||||||||||
| Net income available to Genworth Financial, Inc.’s common stockholders |
$ | 560 | $ | 325 | $ | 38 | $ | 235 | 72 | % | $ | 287 | NM | (1) | ||||||||||||||
|
|
|
|
|
|
|
|
|
|
|
|||||||||||||||||||
| (1) | We define “NM” as not meaningful for increases or decreases greater than 200%. |
2013 compared to 2012
Premiums. Premiums consist primarily of premiums earned on insurance products for life, long-term care and Medicare supplement insurance, single premium immediate annuities and structured settlements with life contingencies, lifestyle protection insurance and mortgage insurance.
| • | Our U.S. Life Insurance segment increased $168 million primarily as a result of an increase of $142 million in our life insurance business from higher ceded reinsurance premiums on certain term life insurance policies as part of a life block transaction in 2012 that did not recur. This increase was partially offset by lapses and higher ceded reinsurance premiums of older term life insurance policies that outpaced sales of our new term life insurance products in 2013. Our long-term care insurance business increased $66 million mainly attributable to $42 million of increased premiums from in-force rate actions and growth of our in-force block from new sales, partially offset by $14 million of |
125
| unfavorable adjustments in 2013. Our fixed annuities business decreased $40 million driven by lower sales of our life-contingent products in 2013. |
| • | Our U.S. Mortgage Insurance segment increased $5 million principally driven by lower ceded reinsurance premiums related to our captive arrangements and a lower accrual for premium refunds on delinquent loans in 2013. These increases were partially offset by lower premiums assumed from an affiliate under an intercompany reinsurance agreement that was terminated effective July 1, 2012. |
| • | Our International Protection segment decreased $46 million, including an increase of $16 million attributable to changes in foreign exchange rates, primarily due to lower premiums from our runoff clients and lower premium volume driven by continued reduced levels of consumer lending in Europe in 2013. |
| • | Our International Mortgage Insurance segment decreased $20 million, including a decrease of $33 million attributable to changes in foreign exchange rates. Excluding the effects of foreign exchange, premiums increased. In Australia, premiums increased $10 million primarily as a result of a larger in-force portfolio and lower ceded reinsurance premiums, partially offset by lower premiums from policy cancellations in 2013. In Canada, premiums decreased $27 million principally from the seasoning of our larger 2007 and 2008 in-force blocks of business which are past their peak earning potential, partially offset by the elimination of the risk premium related to the Government Guarantee Agreement in 2013. In Other Countries, premiums decreased $3 million primarily as a result of the seasoning of our in-force block of business and higher ceded reinsurance premiums, partially offset by higher premiums as result of lender settlements in Ireland in 2013. |
Net investment income. Net investment income represents the income earned on our investments.
| • | Weighted-average investment yields decreased to 4.7% for the year ended December 31, 2013 from 4.8% for the year ended December 31, 2012. The decrease in overall weighted-average investment yields was primarily attributable to lower reinvestment yields and $4 million of lower gains related to limited partnerships, partially offset by higher average invested assets in longer duration products. |
| • | Net investment income for the year ended December 31, 2013 also included $11 million of higher bond calls and mortgage loan prepayments. |
| • | The year ended December 31, 2013 included a decrease of $9 million attributable to changes in foreign exchange rates. |
Net investment gains (losses). Net investment gains (losses) consist primarily of realized gains and losses from the sale or impairment of our investments, unrealized and realized gains and losses from our trading securities and derivative instruments. For further discussion of the change in net investment gains (losses), see the comparison for this line item under “—Investments and Derivative Instruments.”
| • | We recorded $25 million of net other-than-temporary impairments in 2013 as compared to $106 million in 2012. Of total impairments in 2013 and 2012, $15 million and $80 million, respectively, related to structured securities, including $6 million and $50 million, respectively, related to sub-prime and Alt-A residential mortgage-backed and asset-backed securities. Impairments related to corporate fixed maturity securities which were a result of bankruptcies, receivership or concerns about the issuer’s ability to continue to make contractual payments or intent to sell were $6 million in 2013. Impairments related to corporate securities were $20 million in 2012 predominately attributable to a financial hybrid security related to a bank in the United Kingdom that was downgraded to below investment grade. |
| • | Net investment losses related to derivatives of $49 million in 2013 were primarily associated with derivatives used to protect statutory surplus from equity market fluctuation on embedded derivatives related to variable annuity products with GMWB riders. We also had net losses on the change in derivatives and GMWB embedded derivatives as a result of adjustments to the GMWB embedded derivative related to updating our lapse and mortality assumptions and policyholder funds |
126
| underperforming as compared to market indices. In addition, there were losses related to hedge ineffectiveness from our cash flow hedge programs for our long-term care insurance business due to an increase in long-term interest rates and losses related to derivatives used to hedge foreign currency risk associated with assets held and derivatives used to hedge macroeconomic conditions in foreign markets. These losses were partially offset by gains driven by tightening credit spreads on credit default swaps where we sold protection to improve diversification and portfolio yield, gains related to a non-qualified derivative strategy to mitigate interest rate risk associated with our statutory capital positions and gains related to derivatives used to hedge foreign currency risk associated with near-term expected dividend payments from certain subsidiaries. Net investment gains related to derivatives of $4 million in 2012 were primarily due to gains from the narrowing of credit spreads associated with credit default swaps where we sold protection to improve diversification and portfolio yield. These gains were partially offset by losses related to derivatives used to hedge foreign currency risk associated with near-term expected dividend payments from certain subsidiaries and to mitigate foreign subsidiary macroeconomic risk. Additionally, there were losses on embedded derivatives related to variable annuity products with GMWB riders primarily due to the policyholder funds underperformance of underlying variable annuity funds as compared to market indices and market losses resulting from volatility. |
| • | Net losses related to the sale of available-for-sale securities were $8 million in 2013 compared to net gains of $29 million in 2012. During 2013, we recorded $23 million of losses related to trading securities compared to $21 million of gains in 2012 due to higher unrealized losses offsetting gains on sales of securities. We recorded $12 million of lower net gains related to securitization entities during 2013 compared to 2012 primarily due to losses on trading securities in 2013 compared to gains in 2012. In 2013, we recorded $4 million of net losses related to limited partnerships. We also recorded $6 million of contingent consideration adjustments in 2012. |
Insurance and investment product fees and other. Insurance and investment product fees and other consist primarily of fees assessed against policyholder and contractholder account values, surrender charges, cost of insurance assessed on universal and term universal life insurance policies, advisory and administration service fees assessed on investment contractholder account values, broker/dealer commission revenues and other fees.
| • | Our U.S. Life Insurance segment decreased $120 million mainly driven by our life insurance business related predominately to $124 million of gains on the repurchase of notes secured by our non-recourse funding obligations in 2012 that did not recur and from a decrease in our universal life insurance in-force block. These decreases were partially offset by an $8 million favorable unlocking in our universal life insurance products related to interest assumptions in 2013 and an unfavorable valuation adjustment in 2012 that did not recur. |
| • | Corporate and Other activities decreased $76 million primarily attributable to lower income related to our reverse mortgage business, which was sold on April 1, 2013. |
| • | Our U.S. Mortgage Insurance segment decreased $21 million principally from a gain related to the termination of an external reinsurance arrangement in 2012. |
| • | Our Runoff segment increased $9 million mainly attributable to the recapture of a reinsurance agreement related to our corporate-owned life insurance products in 2013, partially offset by lower average account values from outflows of our variable annuity products in 2013. |
Benefits and other changes in policy reserves. Benefits and other changes in policy reserves consist primarily of benefits paid and reserve activity related to current claims and future policy benefits on insurance and investment products for life, long-term care and Medicare supplement insurance, structured settlements and single premium immediate annuities with life contingencies, lifestyle protection insurance and claim costs incurred related to mortgage insurance products.
| • | Our U.S. Mortgage Insurance segment decreased $313 million primarily driven by a decline in new delinquencies and improvements in net cures and aging on existing delinquencies in 2013. Overall |
127
| delinquencies continued to decline from factors such as increased cure rates resulting from improvements in the overall housing market, fewer new delinquencies and ongoing loss mitigation efforts. Reserves for prior year delinquencies benefited $63 million during 2013 from improvements in net cures and aging. |
| • | Our International Mortgage Insurance segment decreased $199 million, including a decrease of $7 million attributable to changes in foreign exchange rates. Australia decreased $140 million primarily driven by a reserve strengthening of $82 million in the first quarter of 2012 that did not recur and lower new delinquencies in 2013. In 2013, paid claims also decreased as a result of a decrease in both the number of claims and the average claim payment. In Canada, losses decreased $54 million mainly driven by lower new delinquencies, net of cures, and lower paid claims due to a shift in regional mix, with fewer claims from Alberta where the severity on paid claims has been higher than other regions. Higher benefits from loss mitigation activities also contributed to the decrease in losses in 2013. Other Countries decreased $5 million primarily from lower new delinquencies, net of cures, particularly in Ireland, and benefits from ongoing loss mitigation activities in 2013. |
| • | Our Runoff segment decreased $5 million predominately from lower GMDB reserves in our variable annuity products due to favorable equity market performance in 2013. |
| • | Our U.S. Life Insurance segment increased $25 million primarily attributable to an increase of $77 million in our long-term care insurance business primarily from the aging and growth of our in-force block, partially offset by reduced benefits of $76 million from in-force rate actions. Additionally, benefits and changes in reserves in 2013 included $22 million of favorable reserve and other adjustments primarily related to the continuation of a multi-stage system conversion, a $17 million favorable adjustment for the refinement of the methodology for calculating incurred but not reported reserves to more fully reflect product-specific incidence rates and a $24 million unfavorable correction that increased reserves to reflect a benefit for policyholders related to an accumulated benefit option, totaling a net favorable adjustment of $15 million. In 2012, benefits and changes in reserves included $60 million of favorable reserve adjustments primarily related to the continuation of a multi-stage system conversion and an $8 million unfavorable adjustment related to a change in interest rate assumptions on claim reserves. Our life insurance business increased $22 million principally related to higher ceded reinsurance as we initially ceded $209 million of certain term life insurance reserves under a new reinsurance treaty as part of a life block transaction in 2012. This increase was partially offset by a $70 million favorable unlocking in our term universal and universal life insurance products related to mortality and interest assumptions in 2013 compared to a $31 million unfavorable unlocking related to interest assumptions in 2012. The increase was also partially offset by a $28 million favorable reserve correction in our term universal life insurance product, a $7 million favorable adjustment related to a refinement of the incurred but not reported reserve calculation in 2013 and mortality which was favorable to pricing and to the prior year. Our fixed annuities business decreased $74 million largely attributable to lower sales of our life-contingent products and favorable mortality in 2013 compared to 2012. |
| • | Our International Protection segment increased $9 million, including an increase of $4 million attributable to changes in foreign exchange rates, primarily driven by lower favorable claim reserve adjustments, partially offset by lower paid claims from a decrease in new claim registrations in 2013. |
Interest credited. Interest credited represents interest credited on behalf of policyholder and contractholder general account balances.
| • | Our U.S. Life Insurance segment decreased $24 million mainly related to a decrease in our fixed annuities business primarily from lower crediting rates in a low interest rate environment in 2013. |
| • | Our Runoff segment decreased $13 million largely related to our institutional products as a result of lower interest paid on our floating rate policyholder liabilities due to a decrease in outstanding liabilities of $1.3 billion in 2013, partially offset by our corporate-owned life insurance products primarily from higher account values in 2013. |
128
Acquisition and operating expenses, net of deferrals. Acquisition and operating expenses, net of deferrals, represent costs and expenses related to the acquisition and ongoing maintenance of insurance and investment contracts, including commissions, policy issuance expenses and other underwriting and general operating costs. These costs and expenses are net of amounts that are capitalized and deferred, which are costs and expenses that are related directly to the successful acquisition of new or renewal insurance policies and investment contracts, such as first-year commissions in excess of ultimate renewal commissions and other policy issuance expenses.
| • | Our International Mortgage Insurance segment increased $186 million, including a decrease of $8 million attributable to changes in foreign exchange rates. Canada increased $173 million mainly related to a favorable adjustment of $186 million from the reversal of the accrued liability for exit fees related to the modification of the Government Guarantee Agreement in the fourth quarter of 2012 that did not recur and higher stock-based compensation expense in 2013. Australia increased $11 million primarily from higher operating expenses, including a $6 million charge related to a customer contract in the fourth quarter of 2013, and higher employee compensation and benefit expenses in 2013. Other Countries increased $2 million primarily from higher employee compensation and benefit expenses, including a $1 million restructuring charge in 2013. |
| • | Corporate and Other activities decreased $55 million primarily attributable to a decrease of $87 million as a result of the sale of our reverse mortgage business on April 1, 2013. This decrease was partially offset by a $30 million make-whole payment related to the debt redemption in 2013. |
| • | Our International Protection segment decreased $50 million, including an increase of $9 million attributable to changes in foreign exchange rates, largely from lower profit commissions, lower paid commissions related to a decline in new business and lower operating expenses as a result of an ongoing cost-saving initiative. The decrease was also attributable to $3 million of reduced benefit costs driven by the closure of the U.K. pension plan in 2013. These decreases were partially offset by a restructuring charge of $3 million in 2013. |
| • | Our U.S. Life Insurance segment decreased $19 million from a decrease of $14 million in our long-term care insurance business predominately from lower production, partially offset by a $7 million restructuring charge in 2013. Our life insurance business decreased $11 million largely from lower expenses in our term universal life insurance product that we no longer offer, partially offset by higher expenses in our term life insurance products as we began offering these products in the fourth quarter of 2012 and a restructuring charge of $3 million in 2013. Our fixed annuities business increased $6 million largely related to guarantee funds from an accrual of $4 million in 2013 compared to a favorable adjustment of $4 million in 2012 and from a restructuring charge in 2013. |
Amortization of deferred acquisition costs and intangibles. Amortization of DAC and intangibles consists primarily of the amortization of acquisition costs that are capitalized, PVFP and capitalized software.
| • | Our U.S. Life Insurance segment decreased $93 million. Our life insurance business decreased $101 million primarily from the initial write-off of $142 million of DAC associated with certain term life insurance policies under a reinsurance treaty as part of a life block transaction in the first quarter of 2012 that did not recur. The decrease was also attributable to higher amortization of DAC of $39 million reflecting loss recognition on certain term life insurance policies under a reinsurance treaty as part of a life block transaction in the third quarter of 2012 that did not recur. These decreases were partially offset by a $60 million unfavorable unlocking related to mortality and interest assumptions in our term universal and universal life insurance products in 2013 compared to a $19 million favorable unlocking related to interest assumptions in 2012. Our fixed annuities business decreased $17 million primarily related to higher net investment losses largely driven by lower derivative gains in 2013. Our long-term care insurance business increased $25 million largely from growth of our in-force block, higher amortization of $4 million from an unfavorable adjustment primarily related to the continuation of a multi-stage system conversion and the write-off of computer software included in a restructuring charge in 2013. |
129
| • | Our Runoff segment decreased $45 million related to our variable annuity products largely from favorable equity market performance in 2013 and $3 million less of unfavorable unlockings in 2013. These decreases were partially offset by higher net investment gains on embedded derivatives associated with our variable annuity products with GMWBs in 2013. |
| • | Our International Protection segment decreased $7 million, including an increase of $2 million attributable to changes in foreign exchange rates, mainly as a result of lower premium volume in 2013. |
| • | Corporate and Other activities decreased $5 million primarily attributable to lower software amortization in 2013. |
Goodwill impairment. Charges for impairment of goodwill are as a result of declines in the fair value of the reporting units. The goodwill impairment charge in the third quarter of 2012 wrote off the entire goodwill balance for our lifestyle protection insurance business.
Interest expense. Interest expense represents interest related to our borrowings that are incurred at Genworth Holdings or subsidiaries and our non-recourse funding obligations and interest expense related to the Tax Matters Agreement and certain reinsurance arrangements being accounted for as deposits.
| • | Our U.S. Life Insurance segment increased $11 million principally driven by our life insurance business largely related to a $20 million favorable adjustment in 2012 related to the Tax Matters Agreement with our former parent company that did not recur. This increase was partially offset by the write-off of $8 million in deferred borrowing costs from the repurchase and repayment of non-recourse funding obligations associated with a life block transaction in 2012 that did not recur. |
| • | Corporate and Other activities increased $10 million largely attributable to a favorable adjustment of $20 million in 2012 related to the Tax Matters Agreement with our former parent company that did not recur and from debt issuances in August and December of 2013. These increases were partially offset by the maturity of Genworth Holdings’ senior notes in June 2012 and repurchases of Genworth Holdings’ senior notes that mature in June 2014 of $100 million in the fourth quarter of 2012 and $15 million during June and August of 2013. Genworth Holdings also redeemed $350 million of its senior notes that were due in 2015. |
| • | Our International Protection segment decreased $3 million, including an increase of $1 million attributable to changes in foreign exchange rates, mainly due to reinsurance arrangements accounted for under the deposit method of accounting as certain of these arrangements were in a lower loss position in 2013. |
Provision (benefit) for income taxes. The effective tax rate increased to 30.9% for the year ended December 31, 2013 from 22.8% for the year ended December 31, 2012. Included in 2013 was additional tax expense of $25 million, including $13 million from a correction of prior years, related to non-deductible stock compensation expense resulting from cancellations. The increase in the effective tax rate was also attributable to a valuation allowance on a deferred tax asset on a specific separate tax return net operating loss that is no longer expected to be realized, state income taxes and the proportion of lower taxed foreign income to pre-tax income in 2013 compared to 2012, partially offset by a non-deductible goodwill impairment in 2012. The year ended December 31, 2013 included a decrease of $4 million attributable to changes in foreign exchange rates.
Net income attributable to noncontrolling interests. Net income attributable to noncontrolling interests represents the portion of equity in a subsidiary attributable to third parties. The decrease was primarily from a favorable adjustment of $58 million from the reversal of the accrued liability for exit fees related to the modification of the Government Guarantee Agreement in the fourth quarter of 2012 that did not recur, partially offset by lower losses in 2013.
130
Net income available to Genworth Financial, Inc.’s common stockholders. We had higher net income available to Genworth Financial, Inc.’s common stockholders in 2013 primarily related to significantly lower losses in our U.S. Mortgage Insurance segment in 2013 and from a goodwill impairment in 2012 that did not recur. Our long-term care insurance business also benefited from in-force rate actions from increased premiums and reduced benefits of $74 million in 2013. Our life insurance business also increased from favorable unlockings and an $18 million favorable reserve correction in 2013. The prior year also included a reserve strengthening in our Australian mortgage insurance business and $47 million of net losses related to life block transactions completed by our life insurance business that did not recur. These increases were partially offset by a favorable adjustment of $78 million in our Canadian mortgage insurance business from the reversal of the accrued liability for exit fees related to the modification of the Government Guarantee Agreement in the fourth quarter of 2012 that did not recur and $40 million of prior year favorable adjustments in our long-term care insurance business that did not recur. There was also a $13 million restructuring charge in 2013 related to an expense reduction plan. For a discussion of each of our segments and Corporate and Other activities, see the “—Results of Operations and Selected Financial and Operating Performance Measures by Segment.” Included in net income available to Genworth Financial, Inc.’s common stockholders for the year ended December 31, 2013 was a decrease of $17 million, net of taxes, attributable to changes in foreign exchange rates.
2012 compared to 2011
Premiums
| • | Our Runoff segment decreased $255 million driven by the sale of our Medicare supplement insurance business in the fourth quarter of 2011. |
| • | Our U.S. Life Insurance segment decreased $190 million primarily as a result of a decrease of $322 million in our life insurance business related to our term life insurance products from higher ceded reinsurance on certain term life insurance policies under new reinsurance treaties as part of life block transactions in 2012 and from not offering these products until the fourth quarter of 2012. This decrease was partially offset by an increase of $123 million in our long-term care insurance business due to growth of our in-force block from new sales and in-force rate actions. Our fixed annuities business increased $9 million from higher sales of our life-contingent products in 2012. |
| • | Our International Protection segment decreased $157 million, including a decrease of $50 million attributable to changes in foreign exchange rates, primarily due to lower premium volume driven by reduced levels of consumer lending and lower premiums from the exit of certain client bank relationships. |
| • | Our International Mortgage Insurance segment decreased $47 million, including a decrease of $12 million attributable to changes in foreign exchange rates. Premiums decreased mainly as a result of the seasoning of our larger in-force block of business in Canada. In Other Countries, premiums decreased as a result of the seasoning of our in-force block of business and lower premium volume from existing lenders in Europe. In Australia, premiums decreased driven by lower policy cancellations in 2012 and higher ceded reinsurance premiums, partially offset by an increase from an actuarial update to premium recognition factors related to policy cancellation experience in 2012. |
| • | Our U.S. Mortgage Insurance segment increased $2 million as lower insurance in-force and lower premiums assumed from an affiliate under an intercompany reinsurance agreement was partially offset by lower ceded reinsurance premiums related to our captive arrangements. |
Net investment income
| • | Weighted-average investment yields decreased to 4.8% for the year ended December 31, 2012 from 4.9% for the year ended December 31, 2011. The decrease in overall weighted-average investment yields was primarily attributable to lower reinvestment yields and lower income attributable to reinsurance arrangements accounted for under the deposit method of accounting as certain of these |
131
| arrangements were in a lower gain position in 2012, partially offset by higher average invested assets in longer duration products and $17 million of higher gains related to limited partnerships accounted for under the equity method. |
| • | Net investment income for the year ended December 31, 2012 also included $6 million of lower bond calls and prepayments. |
| • | The year ended December 31, 2012 included a decrease of $14 million attributable to changes in foreign exchange rates. |
Net investment gains (losses). For further discussion of the change in net investment gains (losses), see the comparison for this line item under “—Investments and Derivative Instruments.”
| • | We recorded $106 million of net other-than-temporary impairments in 2012 as compared to $132 million in 2011. Of total impairments, $80 million and $66 million, respectively, related to structured securities, including $50 million and $37 million, respectively, related to sub-prime and Alt-A residential mortgage-backed and asset-backed securities in 2012 and 2011. Impairments related to corporate securities were $20 million in 2012 predominately attributable to a financial hybrid security related to a bank in the United Kingdom that was downgraded to below investment grade. Impairments related to corporate fixed maturity securities which were a result of bankruptcies, receivership or concerns about the issuer’s ability to continue to make contractual payments or intent to sell were $56 million in 2011. In 2012 and 2011, we recorded $1 million and $2 million, respectively, of impairments related to limited partnership investments. In 2011, we also recorded $3 million of impairments related to real estate held-for-investment. |
| • | Net investment gains related to derivatives of $4 million in 2012 were primarily due to gains from the narrowing of credit spreads associated with credit default swaps where we sold protection to improve diversification and portfolio yield. These gains were partially offset by losses related to derivatives used to hedge foreign currency risk associated with near-term expected dividend payments from certain subsidiaries and to mitigate foreign subsidiary macroeconomic risk. Additionally, there were losses on embedded derivatives related to variable annuity products with GMWB riders primarily due to the policyholder funds underperformance of underlying variable annuity funds as compared to market indices and market losses resulting from volatility. Net investment losses related to derivatives of $99 million in 2011 were primarily associated with embedded derivatives related to variable annuity products with GMWB riders and credit default swaps. The GMWB losses were primarily attributable to underperformance of the underlying variable annuity funds as compared to market indices and market losses resulting from increased volatility. Additionally, there were losses from the change in market value of our credit default swaps due to widening credit spreads. These losses were partially offset by ineffectiveness gains from our cash flow hedge programs related to our long-term care insurance business attributable to significant long-term interest rate declines. |
| • | Net gains related to the sale of available-for-sale securities were $29 million in 2012 compared to $50 million in 2011. We recorded $81 million of net gains related to securitization entities during 2012 compared to $47 million of net losses during 2011 primarily associated with derivatives. During 2012, we recorded $6 million of contingent consideration adjustments. During 2012, we also recorded $6 million of lower gains related to trading securities compared to 2011. |
Insurance and investment product fees and other
| • | Our U.S. Life Insurance segment increased $189 million driven by our life insurance business related to $76 million of higher gains from the repurchase of notes secured by our non-recourse funding obligations in 2012 and growth of our term universal and universal life insurance products. |
| • | Corporate and Other activities increased $80 million primarily attributable to higher income related to our reverse mortgage business in 2012. |
132
| • | Our U.S. Mortgage Insurance segment increased $18 million principally from a gain related to the termination of an external reinsurance arrangement in 2012. |
| • | Our Runoff segment decreased $92 million mainly attributable to a $79 million gain recognized on the sale of our Medicare supplement insurance business in 2011 that did not recur and lower average account values of our variable annuity products in 2012. |
| • | Our International Mortgage Insurance segment decreased $8 million primarily related to currency transactions related to a foreign branch closure in 2011. |
| • | Our International Protection segment decreased $8 million attributable to lower third-party administration fees in 2012 and non-functional currency transactions as a result of changes in foreign exchange rates. |
Benefits and other changes in policy reserves
| • | Our U.S. Mortgage Insurance segment decreased $600 million from lower new delinquencies in 2012 and a reserve strengthening of $299 million in 2011 that did not recur. Net paid claims increased principally related to continued aging of the delinquency inventory volume and a significant reduction in ceded claims under captive arrangements in 2012. |
| • | Our Runoff segment decreased $197 million principally from the sale of our Medicare supplement insurance business in the fourth quarter of 2011 and a decrease in our GMDB reserves in our variable annuity products due to favorable equity market impacts in 2012. |
| • | Our U.S. Life Insurance segment increased $161 million primarily attributable to an increase of $250 million in our long-term care insurance business from the aging and growth of our in-force block, an increase in severity and duration of claims associated with observed loss development and higher average reserve costs on new claims in 2012. Also included in the increase was a reclassification of loss adjustment expenses of $42 million from acquisition and operating expenses, net of deferrals, an $11 million increase in reserves associated with a methodology change related to pending claims in 2012, an $8 million unfavorable adjustment related to a change in interest rate assumptions on claim reserves in the fourth quarter of 2012 and a decrease in reserves in the fourth quarter of 2011 from terminating policies related to the processing of deaths that had not been previously confirmed that did not recur. These increases were partially offset by favorable reserve and actuarial adjustments of $60 million primarily related to the continuation of a multi-stage system conversion in 2012 compared to a $13 million favorable valuation adjustment in 2011. Our fixed annuities business increased $22 million largely attributable to a $10 million favorable reserve adjustment in 2011 that did not recur from terminating contracts related to deaths that had not been previously reported, higher sales of our life-contingent products and unfavorable mortality in 2012 compared to 2011. These increases were partially offset by a decrease of $111 million in our life insurance business principally related to higher ceded reinsurance in 2012. We initially ceded $209 million of certain term life insurance reserves under a new reinsurance treaty as part of a life block transaction in the first quarter of 2012. The decrease was also attributable to a $17 million unfavorable claims adjustment in 2011 that did not recur from the use of the U.S. Social Security Administration’s Death Master File to identify certain life insurance policies where the covered person may be deceased but a claim had not yet been reported. These decreases were partially offset by growth of our term universal and universal life insurance products, a $31 million unfavorable unlocking in our term universal and universal life insurance products primarily related to interest assumptions in 2012 and less favorable mortality in our term and term universal life insurance products in 2012 compared to 2011. |
| • | Our International Mortgage Insurance segment increased $58 million, including a decrease of $2 million attributable to changes in foreign exchange rates. In Australia, losses increased $91 million mainly driven by a reserve strengthening of $82 million in the first quarter of 2012 due to higher than anticipated frequency and severity of claims paid from later stage delinquencies from prior years, |
133
| particularly in coastal tourism areas of Queensland as a result of regional economic pressures as well as our 2007 and 2008 vintages which have a higher concentration of self-employed borrowers. Claims paid also increased in 2012 as a result of an increase in both the number of claims and the average claim payment. These increases were partially offset by lower new delinquencies, net of cures, in 2012. Other Countries increased $2 million primarily from the continued aging of existing delinquencies, particularly in Ireland and Italy, and a higher average reserve per delinquency which were partially offset by benefits from ongoing loss mitigation activities. In Canada, losses decreased $35 million primarily driven by lower new delinquencies, net of cures, and higher benefits from loss mitigation activities. Claims paid also decreased due to a shift in regional mix, with fewer claims from Alberta. These decreases were partially offset by a higher average reserve per delinquency in 2012. |
| • | Our International Protection segment increased $15 million, including a decrease of $10 million attributable to changes in foreign exchange rates, primarily driven by lower favorable claim reserve adjustments, partially offset by lower paid claims from a decrease in new claim registrations in 2012. In addition, we reclassified loss adjustment expenses of $12 million from acquisition and operating expenses, net of deferrals, in 2012. |
Interest credited
| • | Our U.S. Life Insurance segment decreased $16 million from a decrease of $26 million in our fixed annuities business primarily attributable to lower crediting rates in a low interest rate environment, partially offset by a $10 million increase in our life insurance business from growth of our universal life insurance products. |
| • | Our Runoff segment decreased $3 million principally from our institutional products as a result of lower interest paid on our floating rate policyholder liabilities due to a decrease in average outstanding liabilities. |
Acquisition and operating expenses, net of deferrals
| • | Our International Mortgage Insurance segment decreased $193 million, including a decrease of $7 million attributable to changes in foreign exchange rates. Canada decreased $191 million largely as a result of a favorable adjustment of $186 million in the fourth quarter of 2012 associated with the finalization of the new government guarantee framework which resulted in the reversal of the accrued liability for exit fees. Other Countries decreased $8 million as a result of lower operating expenses from cost-saving initiatives. Australia increased $6 million related to higher employee compensation expenses in 2012. |
| • | Our International Protection segment decreased $107 million, including a decrease of $31 million attributable to changes in foreign exchange rates, as a result of lower paid commissions from a decline in new business in 2012 and lower operating expenses as a result of a cost-saving initiative in 2011 and 2012. In addition, we reclassified loss adjustment expenses of $12 million to benefits and other changes in policy reserves in 2012. |
| • | Our Runoff segment decreased $63 million principally from the sale of our Medicare supplement insurance business in the fourth quarter of 2011, a $9 million charge from the discontinuance of our variable annuity offerings in 2011 that did not recur and lower production of our variable annuity products in 2012 due to block runoff. |
| • | Our U.S. Life Insurance segment decreased $59 million primarily attributable to a $33 million decrease in our long-term care insurance business from a reclassification of loss adjustment expenses of $42 million to benefits and other changes in policy reserves in 2012, partially offset by growth of our in-force block. Our life insurance business decreased $18 million primarily driven by lower expenses related to our term life insurance products as we did not offer these products until the fourth quarter of 2012 and from expense management, partially offset by a $13 million favorable cumulative impact |
134
| from a change in premium taxes in Virginia in 2011 that did not recur. Our fixed annuities business decreased $8 million primarily related to a favorable adjustment of $4 million associated with guarantee funds in 2012 compared to a $10 million accrual related to guarantee funds in 2011, partially offset by higher sales in 2012. |
| • | Our U.S. Mortgage Insurance segment decreased $13 million related to lower operating expenses as a result of a cost-saving initiative in 2011. |
| • | Corporate and Other activities increased $99 million as a result of an increase of $78 million associated with our reverse mortgage business primarily related to broker commissions on loans and higher unallocated expenses to our operating segments in 2012. |
Amortization of deferred acquisition costs and intangibles
| • | Our U.S. Life Insurance segment increased $180 million principally from an increase in our life insurance business of $161 million largely related to higher ceded reinsurance as we wrote off $142 million of DAC associated with certain term life insurance policies under a new reinsurance treaty as part of a life block transaction in the first quarter of 2012. Higher amortization of DAC of $39 million reflected loss recognition on certain term life insurance policies under a reinsurance treaty as part of a life block transaction in the third quarter of 2012. There was also a $12 million favorable impact related to an actuarial system conversion in 2011 that did not recur and a lower favorable unlocking of $6 million primarily related to interest assumptions in our term universal life insurance product in 2012. These increases were partially offset by a $17 million favorable unlocking related to interest assumptions in our universal life insurance products in 2012 compared to a $7 million unfavorable unlocking in 2011. Our fixed annuities business increased $17 million primarily due to higher amortization of DAC attributable to higher net investment gains in 2012, partially offset by a $10 million favorable unlocking related to maintenance expense assumption changes and lower surrenders in 2012. Our long-term care insurance business increased $2 million primarily from growth of our in-force block. |
| • | Our International Protection segment decreased $30 million, including a decrease of $8 million attributable to changes in foreign exchange rates, mainly as a result of lower premium volume in 2012. |
| • | Our Runoff segment decreased $19 million largely related the sale of our Medicare supplement insurance business in the fourth quarter of 2011. Our variable annuity products were flat as favorable equity market impacts in 2012 and a $9 million favorable unlocking driven by lower surrenders were offset by higher net investment gains on embedded derivatives associated with our variable annuity products with GMWBs and a $13 million unfavorable unlocking related to our annual review of assumptions. |
Goodwill impairment
| • | Our International Protection segment recorded a goodwill impairment of $89 million in the third quarter of 2012 and included a decrease of $8 million attributable to changes in foreign exchange rates. |
| • | Corporate and Other activities recorded a goodwill impairment of $29 million in the fourth quarter of 2011 related to our reverse mortgage business. |
Interest expense
| • | Corporate and Other activities decreased $23 million primarily attributable to a favorable adjustment of $20 million in 2012 related to the Tax Matters Agreement with our former parent company. |
| • | Our U.S. Life Insurance segment decreased $18 million related to our life insurance business primarily from a favorable adjustment of $20 million in 2012 related to the Tax Matters Agreement with our former parent company and the repurchase and repayment of non-recourse funding obligations in 2012. |
135
| These decreases were partially offset by the write-off of $8 million in deferred borrowing costs from the repurchase and repayment of non-recourse funding obligations associated with a life block transaction in 2012. |
| • | Our International Protection segment increased $7 million, including a decrease of $4 million attributable to changes in foreign exchange rates, due to reinsurance arrangements accounted for under the deposit method of accounting as certain of these arrangements were in a higher loss position in 2012. |
| • | Our International Mortgage Insurance segment increased $5 million from the issuance of debt by our wholly-owned Australian mortgage insurance subsidiary in June 2011. |
Provision (benefit) for income taxes. The effective tax rate increased to 22.8% for the year ended December 31, 2012 from (8.5)% for the year ended December 31, 2011. The increase in the effective tax rate was primarily attributable to lower tax favored investments in 2012, the proportion of lower taxed foreign income to pre-tax earnings in 2012 compared to 2011 and a goodwill impairment in 2012, partially offset by the sale of a subsidiary in 2011. The year ended December 31, 2012 included a decrease of $4 million attributable to changes in foreign exchange rates.
Net income attributable to noncontrolling interests. The increase was primarily from a favorable adjustment of $58 million in the fourth quarter of 2012 associated with the finalization of the new government guarantee framework in Canada which resulted in the reversal of the accrued liability for exit fees.
Net income available to Genworth Financial, Inc.’s common stockholders. Higher net income available to Genworth Financial, Inc.’s common stockholders in 2012 was primarily related to significantly lower losses in our U.S. Mortgage Insurance segment in 2012 as a result of a reserve strengthening in 2011 that did not recur and a favorable adjustment of $78 million in the fourth quarter of 2012 associated with the finalization of the new government guarantee framework in Canada resulting in the reversal of the accrued liability for exit fees related to the modification of the Government Guarantee Agreement. The increase was also attributable to an increase in our variable annuities from favorable equity market performance in 2012 and net investment gains in 2012 compared to net investment losses in 2011. These increases were partially offset by $47 million of net losses related to life block transactions completed by our life insurance business, a reserve strengthening in our Australian mortgage insurance business and a higher goodwill impairment recorded in 2012. For a discussion of each of our segments and Corporate and Other activities, see the “—Results of Operations and Selected Financial and Operating Performance Measures by Segment.” Included in net income available to Genworth Financial, Inc.’s common stockholders for the year ended December 31, 2012 was a decrease of $9 million, net of taxes, attributable to changes in foreign exchange rates.
Reconciliation of net income to net operating income
Net operating income for the years ended December 31, 2013, 2012 and 2011 was $616 million, $403 million and $54 million, respectively. We define net operating income (loss) as income (loss) from continuing operations excluding the after-tax effects of income attributable to noncontrolling interests, net investment gains (losses), goodwill impairments, gains (losses) on the sale of businesses, gains (losses) on the early extinguishment of debt, gains (losses) on insurance block transactions and infrequent or unusual non-operating items. Gains (losses) on insurance block transactions are defined as gains (losses) on the early extinguishment of non-recourse funding obligations, early termination fees for other financing restructuring and/or resulting gains (losses) on reinsurance restructuring for certain blocks of business. We exclude net investment gains (losses) and infrequent or unusual non-operating items because we do not consider them to be related to the operating performance of our segments and Corporate and Other activities. A component of our net investment gains (losses) is the result of impairments, the size and timing of which can vary significantly depending on market credit cycles. In addition, the size and timing of other investment gains (losses) can be subject to our discretion and are influenced by market opportunities, as well as asset-liability matching considerations. Goodwill
136
impairments and gains (losses) on the sale of businesses, the early extinguishment of debt and insurance block transactions are also excluded from net operating income (loss) because in our opinion, they are not indicative of overall operating trends. Other non-operating items are also excluded from net operating income (loss) if, in our opinion, they are not indicative of overall operating trends.
In the fourth quarter of 2013, we revised our definition of net operating income (loss) to exclude gains (losses) on the early extinguishment of debt and gains (losses) on insurance block transactions to better reflect the basis on which the performance of our business is internally assessed and to reflect management’s opinion that they are not indicative of overall operating trends. All prior periods have been re-presented to reflect this new definition.
Based on the revised definition of net operating income (loss), the following transactions were excluded from net operating income (loss) for the periods presented. In the third quarter of 2013, we paid an after-tax make-whole expense of approximately $20 million related to the early redemption of Genworth Holdings’ 4.95% senior notes that mature in 2015 (the “2015 Notes”). In the fourth quarter of 2012, we repurchased principal of approximately $100 million of Genworth Holdings’ notes that mature in June 2014 for an after-tax loss of $4 million. In the fourth quarter of 2012, we also repurchased $20 million of non-recourse funding obligations resulting in an after-tax gain of approximately $3 million. During 2011, we acquired $175 million aggregate principal amount of our non-recourse funding obligations, plus accrued interest, for an after-tax gain of $31 million. In the third quarter of 2012, we completed a life block transaction resulting in an after-tax loss of $6 million. In January 2012, we also completed a life block transaction resulting in an after-tax loss of approximately $41 million.
We recorded after-tax goodwill impairments of $86 million related to our lifestyle protection insurance business in the third quarter of 2012 and $19 million related to our reverse mortgage business recorded in the fourth quarter of 2011. There was a $36 million gain related to the sale of our Medicare supplement insurance business recorded in the fourth quarter of 2011.
There were no infrequent or unusual items excluded from net operating income (loss) during the periods presented other than a $13 million after-tax expense recorded in the second quarter of 2013 related to restructuring costs.
While some of these items may be significant components of net income (loss) available to Genworth Financial, Inc.’s common stockholders in accordance with U.S. GAAP, we believe that net operating income (loss), and measures that are derived from or incorporate net operating income (loss), are appropriate measures that are useful to investors because they identify the income (loss) attributable to the ongoing operations of the business. Management also uses net operating income (loss) as a basis for determining awards and compensation for senior management and to evaluate performance on a basis comparable to that used by analysts. However, the items excluded from net operating income (loss) have occurred in the past and could, and in some cases will, recur in the future. Net operating income (loss) is not a substitute for net income (loss) available to Genworth Financial, Inc.’s common stockholders determined in accordance with U.S. GAAP. In addition, our definition of net operating income (loss) may differ from the definitions used by other companies.
137
The following table includes a reconciliation of net income to net operating income for the years ended December 31:
| (Amounts in millions) |
2013 | 2012 | 2011 | |||||||||
| Net income |
$ | 714 | $ | 525 | $ | 177 | ||||||
| Less: net income attributable to noncontrolling interests |
154 | 200 | 139 | |||||||||
|
|
|
|
|
|
|
|||||||
| Net income available to Genworth Financial, Inc.’s common stockholders |
560 | 325 | 38 | |||||||||
| Adjustments to net income available to Genworth Financial, Inc.’s common stockholders: |
||||||||||||
| Net investment (gains) losses, net of taxes and other adjustments |
11 | 1 | 100 | |||||||||
| (Income) loss from discontinued operations, net of taxes |
12 | (57 | ) | (36 | ) | |||||||
| Goodwill impairment, net of taxes |
— | 86 | 19 | |||||||||
| Gain on sale of business, net of taxes |
— | — | (36 | ) | ||||||||
| Expenses related to restructuring, net of taxes |
13 | — | — | |||||||||
| (Gains) losses on early extinguishment of debt, net of taxes |
20 | 1 | (31 | ) | ||||||||
| (Gains) losses from life block transactions, net of taxes |
— | 47 | — | |||||||||
|
|
|
|
|
|
|
|||||||
| Net operating income |
$ | 616 | $ | 403 | $ | 54 | ||||||
|
|
|
|
|
|
|
|||||||
Earnings per share
The following table provides basic and diluted earnings per common share for the years ended December 31:
| (Amounts in millions, except per share amounts) |
2013 | 2012 | 2011 | |||||||||
| Income from continuing operations available to Genworth Financial, Inc.’s common stockholders per common share: |
||||||||||||
| Basic |
$ | 1.16 | $ | 0.55 | $ | — | ||||||
|
|
|
|
|
|
|
|||||||
| Diluted |
$ | 1.15 | $ | 0.54 | $ | — | ||||||
|
|
|
|
|
|
|
|||||||
| Net income available to Genworth Financial, Inc.’s common stockholders per common share: |
||||||||||||
| Basic |
$ | 1.13 | $ | 0.66 | $ | 0.08 | ||||||
|
|
|
|
|
|
|
|||||||
| Diluted |
$ | 1.12 | $ | 0.66 | $ | 0.08 | ||||||
|
|
|
|
|
|
|
|||||||
| Net operating income per common share: |
||||||||||||
| Basic |
$ | 1.25 | $ | 0.82 | $ | 0.11 | ||||||
|
|
|
|
|
|
|
|||||||
| Diluted |
$ | 1.24 | $ | 0.82 | $ | 0.11 | ||||||
|
|
|
|
|
|
|
|||||||
| Weighted-average common shares outstanding: |
||||||||||||
| Basic |
493.6 | 491.6 | 490.6 | |||||||||
|
|
|
|
|
|
|
|||||||
| Diluted |
498.7 | 494.4 | 493.5 | |||||||||
|
|
|
|
|
|
|
|||||||
Diluted weighted-average shares outstanding for 2013, 2012 and 2011 reflect the effects of potentially dilutive securities including stock options, RSUs and other equity-based compensation.
138
Results of Operations and Selected Financial and Operating Performance Measures by Segment
Our chief operating decision maker evaluates segment performance and allocates resources on the basis of net operating income (loss). See note 20 in our consolidated financial statements under “Item 8—Financial Statements and Supplementary Data” for a reconciliation of net operating income of our segments and Corporate and Other activities to net income available to Genworth Financial, Inc.’s common stockholders.
The following discussions of our segment results of operations should be read in conjunction with the “—Business trends and conditions.”
U.S. Life Insurance Division
Division results of operations
The following table sets forth the results of operations relating to our U.S. Life Insurance Division. See below for a discussion by segment.
| Years ended December 31, | Increase (decrease) and percentage change |
|||||||||||||||||||||||||||
| (Amounts in millions) |
2013 | 2012 | 2011 | 2013 vs. 2012 | 2012 vs. 2011 | |||||||||||||||||||||||
| Net operating income: |
||||||||||||||||||||||||||||
| U.S. Life Insurance segment: |
||||||||||||||||||||||||||||
| Life insurance |
$ | 173 | $ | 151 | $ | 180 | $ | 22 | 15 | % | $ | (29 | ) | (16 | )% | |||||||||||||
| Long-term care insurance |
129 | 101 | 99 | 28 | 28 | % | 2 | 2 | % | |||||||||||||||||||
| Fixed annuities |
92 | 82 | 78 | 10 | 12 | % | 4 | 5 | % | |||||||||||||||||||
|
|
|
|
|
|
|
|
|
|
|
|||||||||||||||||||
| Total U.S. Life Insurance segment |
394 | 334 | 357 | 60 | 18 | % | (23 | ) | (6 | )% | ||||||||||||||||||
|
|
|
|
|
|
|
|
|
|
|
|||||||||||||||||||
| Total net operating income |
394 | 334 | 357 | 60 | 18 | % | (23 | ) | (6 | )% | ||||||||||||||||||
| Adjustments to net operating income: |
||||||||||||||||||||||||||||
| Net investment gains (losses), net of taxes and other adjustments |
(1 | ) | (16 | ) | (32 | ) | 15 | 94 | % | 16 | 50 | % | ||||||||||||||||
| Expenses related to restructuring, net of taxes |
(9 | ) | — | — | (9 | ) | NM | (1) | — | — | % | |||||||||||||||||
| Gains (losses) on early extinguishment of debt, net of taxes |
— | 3 | 31 | (3 | ) | (100 | )% | (28 | ) | (90 | )% | |||||||||||||||||
| Gains (losses) from life block transactions, net of taxes |
— | (47 | ) | — | 47 | 100 | % | (47 | ) | NM | (1) | |||||||||||||||||
|
|
|
|
|
|
|
|
|
|
|
|||||||||||||||||||
| Net income available to Genworth Financial, Inc.’s common stockholders |
$ | 384 | $ | 274 | $ | 356 | $ | 110 | 40 | % | $ | (82 | ) | (23 | )% | |||||||||||||
|
|
|
|
|
|
|
|
|
|
|
|||||||||||||||||||
| (1) | We define “NM” as not meaningful for increases or decreases greater than 200%. |
139
U.S. Life Insurance segment
Segment results of operations
The following table sets forth the results of operations relating to our U.S. Life Insurance segment for the periods indicated:
| Years ended December 31, | Increase (decrease)
and percentage change |
|||||||||||||||||||||||||||
| (Amounts in millions) |
2013 | 2012 | 2011 | 2013 vs. 2012 | 2012 vs. 2011 | |||||||||||||||||||||||
| Revenues: |
||||||||||||||||||||||||||||
| Premiums |
$ | 2,957 | $ | 2,789 | $ | 2,979 | $ | 168 | 6 | % | $ | (190 | ) | (6 | )% | |||||||||||||
| Net investment income |
2,621 | 2,594 | 2,538 | 27 | 1 | % | 56 | 2 | % | |||||||||||||||||||
| Net investment gains (losses) |
(3 | ) | (8 | ) | (73 | ) | 5 | 63 | % | 65 | 89 | % | ||||||||||||||||
| Insurance and investment product fees and other |
755 | 875 | 686 | (120 | ) | (14 | )% | 189 | 28 | % | ||||||||||||||||||
|
|
|
|
|
|
|
|
|
|
|
|||||||||||||||||||
| Total revenues |
6,330 | 6,250 | 6,130 | 80 | 1 | % | 120 | 2 | % | |||||||||||||||||||
|
|
|
|
|
|
|
|
|
|
|
|||||||||||||||||||
| Benefits and expenses: |
||||||||||||||||||||||||||||
| Benefits and other changes in policy reserves |
3,975 | 3,950 | 3,789 | 25 | 1 | % | 161 | 4 | % | |||||||||||||||||||
| Interest credited |
619 | 643 | 659 | (24 | ) | (4 | )% | (16 | ) | (2 | )% | |||||||||||||||||
| Acquisition and operating expenses, net of deferrals |
658 | 677 | 736 | (19 | ) | (3 | )% | (59 | ) | (8 | )% | |||||||||||||||||
| Amortization of deferred acquisition costs and intangibles |
384 | 477 | 297 | (93 | ) | (19 | )% | 180 | 61 | % | ||||||||||||||||||
| Interest expense |
97 | 86 | 104 | 11 | 13 | % | (18 | ) | (17 | )% | ||||||||||||||||||
|
|
|
|
|
|
|
|
|
|
|
|||||||||||||||||||
| Total benefits and expenses |
5,733 | 5,833 | 5,585 | (100 | ) | (2 | )% | 248 | 4 | % | ||||||||||||||||||
|
|
|
|
|
|
|
|
|
|
|
|||||||||||||||||||
| Income from continuing operations before income taxes |
597 | 417 | 545 | 180 | 43 | % | (128 | ) | (23 | )% | ||||||||||||||||||
| Provision for income taxes |
213 | 143 | 189 | 70 | 49 | % | (46 | ) | (24 | )% | ||||||||||||||||||
|
|
|
|
|
|
|
|
|
|
|
|||||||||||||||||||
| Income from continuing operations available to Genworth Financial, Inc.’s common stockholders |
384 | 274 | 356 | 110 | 40 | % | (82 | ) | (23 | )% | ||||||||||||||||||
| Adjustments to income from continuing operations available to Genworth Financial, Inc.’s common stockholders: |
||||||||||||||||||||||||||||
| Net investment (gains) losses, net of taxes and other adjustments |
1 | 16 | 32 | (15 | ) | (94 | )% | (16 | ) | (50 | )% | |||||||||||||||||
| Expenses related to restructuring, net of taxes |
9 | — | — | 9 | NM | (1) | — | — | % | |||||||||||||||||||
| (Gains) losses on early extinguishment of debt, net of taxes |
— | (3 | ) | (31 | ) | 3 | 100 | % | 28 | 90 | % | |||||||||||||||||
| (Gains) losses from life block transactions, net of taxes |
— | 47 | — | (47 | ) | (100 | )% | 47 | NM | (1) | ||||||||||||||||||
|
|
|
|
|
|
|
|
|
|
|
|||||||||||||||||||
| Net operating income |
$ | 394 | $ | 334 | $ | 357 | $ | 60 | 18 | % | $ | (23 | ) | (6 | )% | |||||||||||||
|
|
|
|
|
|
|
|
|
|
|
|||||||||||||||||||
| (1) | We define “NM” as not meaningful for increases or decreases greater than 200%. |
140
The following table sets forth net operating income for the businesses included in our U.S. Life Insurance segment for the periods indicated:
| Years ended December 31, | Increase (decrease)
and percentage change |
|||||||||||||||||||||||||||
| (Amounts in millions) |
2013 | 2012 | 2011 | 2013 vs. 2012 | 2012 vs. 2011 | |||||||||||||||||||||||
| Net operating income: |
||||||||||||||||||||||||||||
| Life insurance |
$ | 173 | $ | 151 | $ | 180 | $ | 22 | 15 | % | $ | (29 | ) | (16 | )% | |||||||||||||
| Long-term care insurance |
129 | 101 | 99 | 28 | 28 | % | 2 | 2 | % | |||||||||||||||||||
| Fixed annuities |
92 | 82 | 78 | 10 | 12 | % | 4 | 5 | % | |||||||||||||||||||
|
|
|
|
|
|
|
|
|
|
|
|||||||||||||||||||
| Total net operating income |
$ | 394 | $ | 334 | $ | 357 | $ | 60 | 18 | % | $ | (23 | ) | (6 | )% | |||||||||||||
|
|
|
|
|
|
|
|
|
|
|
|||||||||||||||||||
2013 compared to 2012
Net operating income
| • | Our life insurance business increased $22 million principally from an $11 million net favorable unlocking in our term universal and universal life insurance products primarily related to mortality and interest assumptions in 2013 compared to a $9 million unfavorable unlocking related to interest assumptions in 2012. The increase was also attributable to an $18 million favorable reserve correction in our term universal life insurance product in 2013 and favorable mortality. These increases were partially offset by a $13 million favorable adjustment related to the Tax Matters Agreement with our former parent company in 2012 that did not recur and a $12 million unfavorable tax valuation allowance in 2013. |
| • | Our long-term care insurance business increased $28 million principally attributable to $74 million of increased premiums and reduced benefits from in-force rate actions, partially offset by lower investment yields in 2013. In addition, the prior year included $40 million of favorable reserve adjustments primarily related to the continuation of a multi-stage system conversion. |
| • | Our fixed annuities business increased $10 million primarily related to favorable mortality and lower interest credited in 2013, partially offset by lower investment income and from an accrual related to guarantee funds of $3 million in 2013 compared to a favorable adjustment of $3 million in 2012. |
Revenues
Premiums
| • | Our life insurance business increased $142 million primarily from higher ceded reinsurance premiums on certain term life insurance policies as part of a life block transaction in 2012 that did not recur. This increase was partially offset by lapses and higher ceded reinsurance premiums of older term life insurance policies that outpaced sales of our new term life insurance products in 2013. |
| • | Our long-term care insurance business increased $66 million mainly attributable to $42 million of increased premiums from in-force rate actions and from growth of our in-force block from new sales, partially offset by $14 million of unfavorable adjustments in 2013. |
| • | Our fixed annuities business decreased $40 million primarily driven by lower sales of our life-contingent products in 2013. |
Net investment income
| • | Our life insurance business increased $16 million primarily from higher gains of $5 million from limited partnerships and higher bond calls and mortgage loan prepayments of $2 million. The increase |
141
| was also attributable to a favorable impact from prepayment speed adjustments on structured securities in 2013. These increases were partially offset by lower average invested assets and lower reinvestment yields in 2013. |
| • | Our long-term care insurance business increased $54 million largely from an increase in average invested assets due to growth of our in-force block and higher bond calls and prepayments of $5 million, partially offset by lower reinvestment yields and lower gains of $8 million from limited partnerships in 2013. |
| • | Our fixed annuities business decreased $43 million primarily attributable to lower reinvestment yields, partially offset by higher bond calls and prepayments of $6 million in 2013. |
Net investment gains (losses). For further discussion of the change in net investment gains (losses), see the comparison for this line item under “—Investments and Derivative Instruments.”
| • | In 2013, net investment gains of $13 million in our life insurance business were primarily related to net gains from the sale of investment securities, partially offset by impairments. Net investment losses of $6 million in 2012 were mainly from impairments, partially offset by net gains from the sale of investment securities. |
| • | In 2013, net investment losses of $11 million in our long-term care insurance business were largely related to impairments and net losses from the sale of investment securities, partially offset by derivative gains. In 2012, impairments were offset by derivative gains and net gains from the sale of investment securities. |
| • | Net investment losses in our fixed annuities business increased $3 million primarily driven by higher net losses from the sale of investment securities and lower derivative gains in 2013, partially offset by lower impairments. |
Insurance and investment product fees and other. The decrease was principally attributable to our life insurance business related predominately to $124 million of gains on the repurchase of notes secured by our non-recourse funding obligations in 2012 that did not recur and from a decrease in our universal life insurance in-force block. These decreases were partially offset by an $8 million favorable unlocking in our universal life insurance products related to interest assumptions in 2013 and an unfavorable valuation adjustment in 2012 that did not recur.
Benefits and expenses
Benefits and other changes in policy reserves
| • | Our life insurance business increased $22 million primarily from a life block transaction in 2012 when we initially ceded $209 million of certain term life insurance reserves under a new reinsurance treaty. This increase was partially offset by a $70 million favorable unlocking in our term universal and universal life insurance products related to mortality and interest assumptions in 2013 compared to a $31 million unfavorable unlocking related to interest assumptions in 2012. The increase was also partially offset by a $28 million favorable reserve correction in our term universal life insurance product, a $7 million favorable adjustment related to a refinement of the incurred but not reported reserve calculation in 2013 and mortality which was favorable to pricing and to the prior year. |
| • | Our long-term care insurance business increased $77 million primarily from the aging and growth of our in-force block, partially offset by reduced benefits of $76 million from in-force rate actions. Additionally, benefits and changes in reserves in 2013 included $22 million of favorable reserve and other adjustments primarily related to the continuation of a multi-stage system conversion, a $17 million favorable adjustment for the refinement of the methodology for calculating incurred but not reported reserves to more fully reflect product-specific incidence rates and a $24 million unfavorable |
142
| correction that increased reserves to reflect a benefit for policyholders related to an accumulated benefit option, totaling a net favorable adjustment of $15 million. In 2012, benefits and changes in reserves included $60 million of favorable reserve adjustments primarily related to the continuation of a multi-stage system conversion and an $8 million unfavorable adjustment related to a change in interest rate assumptions on claim reserves. |
| • | Our fixed annuities business decreased $74 million largely attributable to lower sales of our life-contingent products and favorable mortality in 2013 compared to 2012. |
Interest credited. The decrease in interest credited was principally related to our fixed annuities business driven by lower crediting rates in a low interest rate environment in 2013.
Acquisition and operating expenses, net of deferrals
| • | Our life insurance business decreased $11 million largely from lower expenses in our term universal life insurance product that we no longer offer, partially offset by higher expenses in our term life insurance products as we began offering these products in the fourth quarter of 2012 and a restructuring charge of $3 million in 2013. |
| • | Our long-term care insurance business decreased $14 million predominately from lower production, partially offset by a $7 million restructuring charge in 2013. |
| • | Our fixed annuities business increased $6 million largely related to guarantee funds from an accrual of $4 million in 2013 compared to a favorable adjustment of $4 million in 2012 and from a restructuring charge in 2013. |
Amortization of deferred acquisition costs and intangibles
| • | Our life insurance business decreased $101 million primarily from the initial write-off of $142 million of DAC associated with certain term life insurance policies under a reinsurance treaty as part of a life block transaction in the first quarter of 2012 that did not recur. The decrease was also attributable to higher amortization of DAC of $39 million reflecting loss recognition on certain term life insurance policies under a reinsurance treaty as part of a life block transaction in the third quarter of 2012 that did not recur. These decreases were partially offset by a $60 million unfavorable unlocking related to mortality and interest assumptions in our term universal and universal life insurance products in 2013 compared to a $19 million favorable unlocking related to interest assumptions in 2012. |
| • | Our long-term care insurance business increased $25 million largely from growth of our in-force block, higher amortization of $4 million from an unfavorable adjustment primarily related to the continuation of a multi-stage system conversion and the write-off of computer software included in a restructuring charge in 2013. |
| • | Our fixed annuities business decreased $17 million primarily related to lower amortization of DAC attributable to higher net investment losses largely driven by lower derivative gains in 2013. |
Interest expense. Interest expense increased principally driven by our life insurance business largely related to a $20 million favorable adjustment in 2012 related to the Tax Matters Agreement with our former parent company that did not recur. This increase was partially offset by the write-off of $8 million in deferred borrowing costs from the repurchase and repayment of non-recourse funding obligations associated with a life block transaction in 2012 that did not recur.
Provision for income taxes. The effective tax rate increased to 35.7% for the year ended December 31, 2013 from 34.3% for the year ended December 31, 2012. The increase in the effective tax rate was primarily
143
attributable to a valuation allowance on a deferred tax asset on a specific separate tax return net operating loss that is no longer expected to be realized and changes in uncertain tax positions in 2012, partially offset by lower state income taxes in 2013.
2012 compared to 2011
Net operating income
| • | Our life insurance business decreased $29 million principally from less favorable mortality in our term life insurance products in 2012 compared to 2011, a $9 million unfavorable unlocking in our term universal and universal life insurance products primarily related to interest assumptions in 2012 and an $8 million favorable cumulative impact from a change in premium taxes in Virginia in 2011 that did not recur. These decreases were partially offset by a $13 million favorable adjustment related to the Tax Matters Agreement with our former parent company in 2012 and growth of our term universal life insurance product. |
| • | Our long-term care insurance business increased $2 million principally from $40 million of favorable reserve adjustments in 2012 primarily related to the continuation of a multi-stage system conversion compared to an $8 million favorable valuation adjustment in 2011. The increase was also attributable to premium growth of newer issued policies and in-force rate actions. These increases were partially offset by higher average reserve costs on new claims in 2012, a $7 million increase in reserves associated with a methodology change related to pending claims in 2012 and a decrease in reserves in the fourth quarter of 2011 from terminating policies related to the processing of deaths that had not been previously confirmed that did not recur. |
| • | Our fixed annuities business increased $4 million primarily related to a $3 million favorable adjustment associated with guarantee funds in 2012 compared to a $7 million accrual related to guarantee funds in 2011. The increase was also attributable to a $6 million favorable unlocking related to maintenance expense assumption changes and lower surrenders in 2012. These increases were partially offset by lower investment income in 2012 and a $7 million favorable reserve adjustment in 2011 that did not recur from terminating contracts related to deaths not previously reported. |
Revenues
Premiums
| • | Our life insurance business decreased $322 million primarily related to our term life insurance products from higher ceded reinsurance on certain term life insurance policies under new reinsurance treaty as part of a life block transaction in 2012 and from not offering these products until the fourth quarter of 2012. |
| • | Our long-term care insurance business increased $123 million mainly attributable to growth of our in-force block from new sales and in-force rate actions. |
| • | Our fixed annuities business increased $9 million primarily driven by higher sales of our life-contingent products in 2012. |
Net investment income
| • | Our life insurance business decreased $9 million primarily from lower reinvestment yields and lower gains of $4 million from limited partnerships accounted for under the equity method. |
| • | Our long-term care insurance business increased $101 million largely from an increase in average invested assets due to growth of our in-force block. Net investment income also included higher gains of $11 million from limited partnerships accounted for under the equity method in 2012. These |
144
| increases were offset by lower reinvestment yields and an unfavorable adjustment of $6 million included in 2011 related to the accounting for interest rate swaps that did not recur. |
| • | Our fixed annuities business decreased $36 million primarily attributable to lower reinvestment yields and lower investment income of $7 million from bond calls and prepayments in 2012. Net investment income also included higher gains of $10 million from limited partnerships accounted for under the equity method in 2012. |
Net investment gains (losses). For further discussion of the change in net investment gains (losses), see the comparison for this line item under “—Investments and Derivative Instruments.”
| • | Net investment losses in our life insurance business decreased $26 million primarily driven by net gains from the sale of investment securities in 2012 compared to net losses in 2011, partially offset by higher impairments in 2012. |
| • | Our long-term care insurance business had no net investment gains or losses in 2012 compared to net investment gains of $19 million in 2011. In 2012, derivative gains and net gains from the sale of investment securities were offset by impairments. Net investment gains in 2011 were mainly from net gains from the sale of investment securities and derivative gains, partially offset by impairments. |
| • | Net investment losses in our fixed annuities business decreased $58 million primarily driven by derivative gains in 2012 compared to derivative losses in 2011 and lower impairments. |
Insurance and investment product fees and other. The increase was attributable to our life insurance business from $76 million of higher gains from the repurchase of notes secured by our non-recourse funding obligations in 2012 and from growth of our term universal and universal life insurance products.
Benefits and expenses
Benefits and other changes in policy reserves
| • | Our life insurance business decreased $111 million principally related to higher ceded reinsurance in 2012. We initially ceded $209 million of certain term life insurance reserves under a new reinsurance treaty as part of a life block transaction in the first quarter of 2012. The decrease was also attributable to a $17 million unfavorable claims adjustment in 2011 that did not recur from the use of the U.S. Social Security Administration’s Death Master File to identify certain life insurance policies where the covered person may be deceased but a claim had not yet been reported. These decreases were partially offset by growth of our term universal and universal life insurance products, a $31 million unfavorable unlocking in our term universal and universal life insurance products primarily related to interest assumptions in 2012 and less favorable mortality in our term and term universal life insurance products in 2012 compared to 2011. |
| • | Our long-term care insurance business increased $250 million primarily from the aging and growth of our in-force block, an increase in severity and duration of claims associated with observed loss development and higher average reserve costs on new claims in 2012. Also included in the increase was a reclassification of loss adjustment expenses of $42 million from acquisition and operating expenses, net of deferrals, an $11 million increase in reserves associated with a methodology change related to pending claims in 2012, an $8 million unfavorable adjustment related to a change in interest rate assumptions on claim reserves in the fourth quarter of 2012 and a decrease in reserves in the fourth quarter of 2011 from terminating policies related to the processing of deaths that had not been previously confirmed that did not recur. These increases were partially offset by favorable reserve and actuarial adjustments of $60 million primarily related to the continuation of a multi-stage system conversion in 2012 compared to a $13 million favorable valuation adjustment in 2011. |
| • | Our fixed annuities business increased $22 million largely attributable to a $10 million favorable reserve adjustment in 2011 that did not recur from terminating contracts related to deaths that had not |
145
| been previously reported. The increase was also attributable to higher sales of our life-contingent products and unfavorable mortality in 2012 compared to 2011. |
Interest credited
| • | Our life insurance business increased $10 million primarily from growth of our universal life insurance products. |
| • | Our fixed annuities business decreased $26 million mainly from lower crediting rates in a low interest rate environment. |
Acquisition and operating expenses, net of deferrals
| • | Our life insurance business decreased $18 million primarily driven by lower expenses related to our term life insurance products as we did not offer these products until the fourth quarter of 2012 and from expense management, partially offset by a $13 million favorable cumulative impact from a change in premium taxes in Virginia in 2011 that did not recur. |
| • | Our long-term care insurance business decreased $33 million primarily as a result of a reclassification of loss adjustment expenses of $42 million to benefits and other changes in policy reserves in 2012, partially offset by growth of our in-force block. |
| • | Our fixed annuities business decreased $8 million primarily driven by a favorable adjustment of $4 million associated with guarantee funds in 2012 compared to a $10 million accrual related to guarantee funds in 2011, partially offset by higher sales in 2012. |
Amortization of deferred acquisition costs and intangibles
| • | Our life insurance business increased $161 million principally related to higher ceded reinsurance as we wrote off $142 million of DAC associated with certain term life insurance policies under a new reinsurance treaty as part of a life block transaction in the first quarter of 2012. Higher amortization of DAC of $39 million reflected loss recognition on certain term life insurance policies under a reinsurance treaty as part of a life block transaction in the third quarter of 2012. There was also a $12 million favorable impact related to an actuarial system conversion in 2011 that did not recur and a lower favorable unlocking of $6 million primarily related to interest assumptions in our term universal life insurance product in 2012. These increases were partially offset by a $17 million favorable unlocking related to interest assumptions in our universal life insurance products in 2012 compared to a $7 million unfavorable unlocking in 2011. |
| • | Our long-term care insurance business increased $2 million primarily from growth of our in-force block. |
| • | Our fixed annuities business increased $17 million primarily due to higher amortization of DAC attributable to higher net investment gains in 2012, partially offset by a $10 million favorable unlocking related to maintenance expense assumption changes and lower surrenders in 2012. |
Interest expense. Interest expense decreased primarily related to our life insurance business mostly from a $20 million favorable adjustment related to the Tax Matters Agreement with our former parent company and the repurchase and repayment of non-recourse funding obligations in 2012. These decreases were partially offset by the write-off of $8 million in deferred borrowing costs from the repurchase and repayment of non-recourse funding obligations associated with a life block transaction in 2012.
Provision for income taxes. The effective tax rate decreased to 34.3% for the year ended December 31, 2012 from 34.7% for the year ended December 31, 2011. The decrease in the effective tax rate was primarily attributable to changes in uncertain tax positions.
146
U.S. Life Insurance selected operating performance measures
Life insurance
The following table sets forth selected operating performance measures regarding our life insurance business as of or for the dates indicated:
| As of or for years ended December 31, |
Increase (decrease) and percentage change |
|||||||||||||||||||||||||||
| (Amounts in millions) |
2013 | 2012 | 2011 | 2013 vs. 2012 | 2012 vs. 2011 | |||||||||||||||||||||||
| Term and whole life insurance |
||||||||||||||||||||||||||||
| Net earned premiums |
$ | 684 | $ | 542 | $ | 864 | $ | 142 | 26 | % | $ | (322 | ) | (37 | )% | |||||||||||||
| Sales |
22 | 1 | 1 | 21 | NM | (1) | — | — | % | |||||||||||||||||||
| Life insurance in-force, net of reinsurance |
336,015 | 340,394 | 439,743 | (4,379 | ) | (1 | )% | (99,349 | ) | (23 | )% | |||||||||||||||||
| Life insurance in-force before reinsurance |
523,694 | 539,317 | 568,261 | (15,623 | ) | (3 | )% | (28,944 | ) | (5 | )% | |||||||||||||||||
| Term universal life insurance |
||||||||||||||||||||||||||||
| Net deposits |
$ | 280 | $ | 280 | $ | 185 | $ | — | — | % | $ | 95 | 51 | % | ||||||||||||||
| Sales |
1 | 93 | 129 | (92 | ) | (99 | )% | (36 | ) | (28 | )% | |||||||||||||||||
| Life insurance in-force, net of reinsurance |
132,293 | 137,359 | 99,753 | (5,066 | ) | (4 | )% | 37,606 | 38 | % | ||||||||||||||||||
| Life insurance in-force before reinsurance |
133,348 | 138,436 | 100,476 | (5,088 | ) | (4 | )% | 37,960 | 38 | % | ||||||||||||||||||
| Universal life insurance |
||||||||||||||||||||||||||||
| Net deposits |
$ | 528 | $ | 686 | $ | 614 | $ | (158 | ) | (23 | )% | $ | 72 | 12 | % | |||||||||||||
| Sales: |
||||||||||||||||||||||||||||
| Universal life insurance |
24 | 67 | 58 | (43 | ) | (64 | )% | 9 | 16 | % | ||||||||||||||||||
| Linked-benefits |
10 | 12 | 9 | (2 | ) | (17 | )% | 3 | 33 | % | ||||||||||||||||||
| Life insurance in-force, net of reinsurance |
43,150 | 44,129 | 42,363 | (979 | ) | (2 | )% | 1,766 | 4 | % | ||||||||||||||||||
| Life insurance in-force before reinsurance |
49,790 | 50,954 | 49,204 | (1,164 | ) | (2 | )% | 1,750 | 4 | % | ||||||||||||||||||
| Total life insurance |
||||||||||||||||||||||||||||
| Net earned premiums and deposits |
$ | 1,492 | $ | 1,508 | $ | 1,663 | $ | (16 | ) | (1 | )% | $ | (155 | ) | (9 | )% | ||||||||||||
| Sales: |
||||||||||||||||||||||||||||
| Term life insurance |
22 | 1 | 1 | 21 | NM | (1) | — | — | % | |||||||||||||||||||
| Term universal life insurance |
1 | 93 | 129 | (92 | ) | (99 | )% | (36 | ) | (28 | )% | |||||||||||||||||
| Universal life insurance |
24 | 67 | 58 | (43 | ) | (64 | )% | 9 | 16 | % | ||||||||||||||||||
| Linked-benefits |
10 | 12 | 9 | (2 | ) | (17 | )% | 3 | 33 | % | ||||||||||||||||||
| Life insurance in-force, net of reinsurance |
511,458 | 521,882 | 581,859 | (10,424 | ) | (2 | )% | (59,977 | ) | (10 | )% | |||||||||||||||||
| Life insurance in-force before reinsurance |
706,832 | 728,707 | 717,941 | (21,875 | ) | (3 | )% | 10,766 | 1 | % | ||||||||||||||||||
| (1) | We define “NM” as not meaningful for increases or decreases greater than 200%. |
147
2013 compared to 2012
Term and whole life insurance
Net earned premiums increased primarily from higher ceded reinsurance premiums on certain term life insurance policies as part of a life block transaction in 2012 that did not recur. This increase was partially offset by lapses and higher ceded reinsurance premiums of older term life insurance policies that outpaced sales of our new term life insurance products in 2013. Sales of our term life insurance products increased because we began offering these products in the fourth quarter of 2012. Our life insurance in-force decreased from the runoff of our term life insurance products issued prior to resuming sales in the fourth quarter of 2012 and the runoff of our whole life insurance products.
Term universal life insurance
Our life insurance in-force decreased as we discontinued sales of this product in the fourth quarter of 2012 which resulted in lower sales in 2013.
Universal life insurance
Net deposits and sales decreased from our modification and re-pricing of certain product offerings that we
announced in the fourth quarter of 2012 in response to regulatory changes. Our life insurance in-force decreased primarily from lower sales and deposits in 2013.
2012 compared to 2011
Term and whole life insurance
Net earned premiums and our life insurance in-force decreased mainly related to higher ceded reinsurance on certain term life insurance policies in 2012 and from not offering these products until the fourth quarter of 2012.
Term universal life insurance
Net deposits and our life insurance in-force increased due to growth of this product in 2012. Sales decreased as we suspended sales of our 15-year and 30-year products in March 2012 and June 2012, respectively. In the fourth quarter of 2012, as part of our announced changes to our life insurance portfolio designed to update and expand our product offerings, and further adjust pricing to reflect the low interest rate market environment and regulatory changes, we no longer solicit sales of our term universal life insurance products.
Universal life insurance
Net deposits and our life insurance in-force increased primarily attributable to growth of these products in 2012. Sales increased from the introduction of new products in 2011.
148
Long-term care insurance
The following table sets forth selected operating performance measures regarding our individual and group long-term care insurance products for the periods indicated:
| Years ended December 31, | Increase (decrease) and percentage change |
|||||||||||||||||||||||||||
| (Amounts in millions) |
2013 | 2012 | 2011 | 2013 vs. 2012 | 2012 vs. 2011 | |||||||||||||||||||||||
| Net earned premiums: |
||||||||||||||||||||||||||||
| Individual long-term care insurance |
$ | 2,115 | $ | 2,069 | $ | 1,961 | $ | 46 | 2 | % | $ | 108 | 6 | % | ||||||||||||||
| Group long-term care insurance |
94 | 74 | 59 | 20 | 27 | % | 15 | 25 | % | |||||||||||||||||||
|
|
|
|
|
|
|
|
|
|
|
|||||||||||||||||||
| Total |
$ | 2,209 | $ | 2,143 | $ | 2,020 | $ | 66 | 3 | % | $ | 123 | 6 | % | ||||||||||||||
|
|
|
|
|
|
|
|
|
|
|
|||||||||||||||||||
| Annualized first-year premiums and deposits: |
||||||||||||||||||||||||||||
| Individual long-term care insurance |
$ | 134 | $ | 221 | $ | 206 | $ | (87 | ) | (39 | )% | $ | 15 | 7 | % | |||||||||||||
| Group long-term care insurance |
15 | 20 | 13 | (5 | ) | (25 | )% | 7 | 54 | % | ||||||||||||||||||
|
|
|
|
|
|
|
|
|
|
|
|||||||||||||||||||
| Total |
$ | 149 | $ | 241 | $ | 219 | $ | (92 | ) | (38 | )% | $ | 22 | 10 | % | |||||||||||||
|
|
|
|
|
|
|
|
|
|
|
|||||||||||||||||||
| Loss ratio (1) |
66 | % | 68 | % | 65 | % | (2 | )% | 3 | % | ||||||||||||||||||
| (1) | In 2013, we revised our methodology for calculating tabular interest to a policy level calculation, which impacted the reported loss ratio. The change in the calculation for tabular interest had no impact on reserves, benefits or net operating income as it reflected a reclassification between components of the total change in policy reserves. Tabular interest is one of several components that make up the total change in policy reserves. The loss ratio for the prior periods has been adjusted lower by three points to approximate the new calculation for tabular interest to make prior periods more comparable with the current calculation. |
The loss ratio is the ratio of benefits and other changes in reserves less tabular interest on reserves less loss adjustment expenses to net earned premiums.
2013 compared to 2012
Net earned premiums increased mainly attributable to growth of our in-force block from new sales and $42 million of increased premiums from in-force rate actions, partially offset by $14 million of unfavorable adjustments in 2013.
Annualized first-year premiums and deposits decreased principally from changes in pricing and product options previously announced.
The loss ratio decreased largely from $118 million of increased premiums and reduced benefits from in-force rate actions and a $17 million favorable adjustment for the refinement of the methodology for calculating incurred but not reported reserves to more fully reflect product-specific incidence rates in 2013. These decreases were partially offset by $52 million of less favorable reserve and other adjustments and a $24 million correction that increased reserves to reflect a benefit for policyholders related to an accumulated benefit option in 2013.
2012 compared to 2011
Net earned premiums increased mainly attributable to growth of our in-force block from new sales and in-force rate actions.
Sales increased principally from the acceleration of sales prior to new pricing and product offerings.
The loss ratio increased largely from higher average reserve costs on new claims, partially offset by favorable reserve and actuarial adjustments of $60 million primarily from the continuation of a multi-stage system conversion in 2012 compared to a $13 million favorable valuation adjustment in 2011.
149
Fixed annuities
The following table sets forth selected operating performance measures regarding our fixed annuities as of or for the dates indicated:
| As of or for years
ended December 31, |
Increase (decrease) and percentage change |
|||||||||||||||||||||||||||
| (Amounts in millions) |
2013 | 2012 | 2011 | 2013 vs. 2012 | 2012 vs. 2011 | |||||||||||||||||||||||
| Single Premium Deferred Annuities |
||||||||||||||||||||||||||||
| Account value, beginning of period |
$ | 11,038 | $ | 10,831 | $ | 10,819 | $ | 207 | 2 | % | $ | 12 | — | % | ||||||||||||||
| Deposits |
1,634 | 1,161 | 1,140 | 473 | 41 | % | 21 | 2 | % | |||||||||||||||||||
| Surrenders, benefits and product charges |
(1,176 | ) | (1,285 | ) | (1,479 | ) | 109 | 8 | % | 194 | 13 | % | ||||||||||||||||
|
|
|
|
|
|
|
|
|
|
|
|||||||||||||||||||
| Net flows |
458 | (124 | ) | (339 | ) | 582 | NM | (1) | 215 | 63 | % | |||||||||||||||||
| Interest credited |
311 | 331 | 351 | (20 | ) | (6 | )% | (20 | ) | (6 | )% | |||||||||||||||||
|
|
|
|
|
|
|
|
|
|
|
|||||||||||||||||||
| Account value, end of period |
$ | 11,807 | $ | 11,038 | $ | 10,831 | $ | 769 | 7 | % | $ | 207 | 2 | % | ||||||||||||||
|
|
|
|
|
|
|
|
|
|
|
|||||||||||||||||||
| Single Premium Immediate Annuities |
||||||||||||||||||||||||||||
| Account value, beginning of period |
$ | 6,442 | $ | 6,433 | $ | 6,528 | $ | 9 | — | % | $ | (95 | ) | (1 | )% | |||||||||||||
| Premiums and deposits |
307 | 370 | 343 | (63 | ) | (17 | )% | 27 | 8 | % | ||||||||||||||||||
| Surrenders, benefits and product charges |
(898 | ) | (929 | ) | (1,004 | ) | 31 | 3 | % | 75 | 7 | % | ||||||||||||||||
|
|
|
|
|
|
|
|
|
|
|
|||||||||||||||||||
| Net flows |
(591 | ) | (559 | ) | (661 | ) | (32 | ) | (6 | )% | 102 | 15 | % | |||||||||||||||
| Interest credited |
285 | 305 | 324 | (20 | ) | (7 | )% | (19 | ) | (6 | )% | |||||||||||||||||
| Effect of accumulated net unrealized investment gains (losses) |
(299 | ) | 263 | 242 | (562 | ) | NM | (1) | 21 | 9 | % | |||||||||||||||||
|
|
|
|
|
|
|
|
|
|
|
|||||||||||||||||||
| Account value, end of period |
$ | 5,837 | $ | 6,442 | $ | 6,433 | $ | (605 | ) | (9 | )% | $ | 9 | — | % | |||||||||||||
|
|
|
|
|
|
|
|
|
|
|
|||||||||||||||||||
| Structured Settlements |
||||||||||||||||||||||||||||
| Account value, net of reinsurance, beginning of period |
$ | 1,101 | $ | 1,107 | $ | 1,113 | $ | (6 | ) | (1 | )% | $ | (6 | ) | (1 | )% | ||||||||||||
| Surrenders, benefits and product charges |
(66 | ) | (64 | ) | (64 | ) | (2 | ) | (3 | )% | — | — | % | |||||||||||||||
|
|
|
|
|
|
|
|
|
|
|
|||||||||||||||||||
| Net flows |
(66 | ) | (64 | ) | (64 | ) | (2 | ) | (3 | )% | — | — | % | |||||||||||||||
| Interest credited |
58 | 58 | 58 | — | — | % | — | — | % | |||||||||||||||||||
|
|
|
|
|
|
|
|
|
|
|
|||||||||||||||||||
| Account value, net of reinsurance, end of period |
$ | 1,093 | $ | 1,101 | $ | 1,107 | $ | (8 | ) | (1 | )% | $ | (6 | ) | (1 | )% | ||||||||||||
|
|
|
|
|
|
|
|
|
|
|
|||||||||||||||||||
| Total premiums from fixed annuities |
$ | 64 | $ | 104 | $ | 95 | $ | (40 | ) | (38 | )% | $ | 9 | 9 | % | |||||||||||||
|
|
|
|
|
|
|
|
|
|
|
|||||||||||||||||||
| Total deposits on fixed annuities |
$ | 1,877 | $ | 1,427 | $ | 1,388 | $ | 450 | 32 | % | $ | 39 | 3 | % | ||||||||||||||
|
|
|
|
|
|
|
|
|
|
|
|||||||||||||||||||
| (1) | We define “NM” as not meaningful for increases or decreases greater than 200%. |
2013 compared to 2012
Single Premium Deferred Annuities
Account value of our single premium deferred annuities increased as deposits and interest credited outpaced surrenders. Sales increased driven by competitive pricing while maintaining targeted returns and from a rise in interest rates in 2013.
Single Premium Immediate Annuities
Account value of our single premium immediate annuities decreased as benefits and net unrealized investment losses exceeded premiums and deposits and interest credited. Sales continued to be pressured under current market conditions and from the low interest rate environment in spite of the rise in interest rates in 2013.
150
Structured Settlements
We no longer solicit sales of structured settlements; however, we continue to service our existing block of business.
2012 compared to 2011
Single Premium Deferred Annuities
Account value of our single premium deferred annuities increased as deposits and interest credited outpaced surrenders. Sales increased in 2012 driven by a more competitive offering.
Single Premium Immediate Annuities
Account value of our single premium immediate annuities increased as premiums and deposits, interest credited and net unrealized investment gains exceeded surrenders. Sales were pressured in 2012 given the low interest rate environment and other market conditions.
Structured Settlements
We no longer solicit sales of structured settlements; however, we continue to service our existing block of business.
Valuation systems and processes
Our U.S. Life Insurance segment will continue to migrate to a new valuation and projection platform for certain lines of business, while we upgrade platforms for other lines of business. The migration and upgrades are part of our ongoing efforts to improve the infrastructure and capabilities of our information systems and our routine assessment and refinement of financial, actuarial, investment and risk management capabilities enterprise wide. These efforts will also provide our U.S. Life Insurance segment with platforms to support emerging accounting guidance and ongoing changes in capital regulations. Concurrently, valuation processes and methodologies will be reviewed. Any material changes in balances or income trends that may result from these activities will be disclosed accordingly.
151
Global Mortgage Insurance Division
Division results of operations
The following table sets forth the results of operations relating to our Global Mortgage Insurance Division. See below for a discussion by segment.
| Years ended December 31, | Increase (decrease)
and percentage change |
|||||||||||||||||||||||||||
| (Amounts in millions) |
2013 | 2012 | 2011 | 2013 vs. 2012 | 2012 vs. 2011 | |||||||||||||||||||||||
| Net operating income (loss): |
||||||||||||||||||||||||||||
| International Mortgage Insurance segment: |
||||||||||||||||||||||||||||
| Canada |
$ | 170 | $ | 234 | $ | 159 | $ | (64 | ) | (27 | )% | $ | 75 | 47 | % | |||||||||||||
| Australia |
228 | 142 | 196 | 86 | 61 | % | (54 | ) | (28 | )% | ||||||||||||||||||
| Other Countries |
(37 | ) | (34 | ) | (27 | ) | (3 | ) | (9 | )% | (7 | ) | (26 | )% | ||||||||||||||
|
|
|
|
|
|
|
|
|
|
|
|||||||||||||||||||
| Total International Mortgage Insurance segment |
361 | 342 | 328 | 19 | 6 | % | 14 | 4 | % | |||||||||||||||||||
|
|
|
|
|
|
|
|
|
|
|
|||||||||||||||||||
| U.S. Mortgage Insurance segment |
37 | (138 | ) | (524 | ) | 175 | 127 | % | 386 | 74 | % | |||||||||||||||||
|
|
|
|
|
|
|
|
|
|
|
|||||||||||||||||||
| Total net operating income (loss) |
398 | 204 | (196 | ) | 194 | 95 | % | 400 | NM | (1) | ||||||||||||||||||
| Adjustments to net operating income (loss): |
||||||||||||||||||||||||||||
| Net investment gains (losses), net of taxes and other adjustments |
12 | 31 | 55 | (19 | ) | (61 | )% | (24 | ) | (44 | )% | |||||||||||||||||
| Expenses related to restructuring, net of taxes |
(1 | ) | — | — | (1 | ) | NM | (1) | — | — | % | |||||||||||||||||
|
|
|
|
|
|
|
|
|
|
|
|||||||||||||||||||
| Net income (loss) available to Genworth Financial, Inc.’s common stockholders |
409 | 235 | (141 | ) | 174 | 74 | % | 376 | NM | (1) | ||||||||||||||||||
| Add: net income attributable to noncontrolling interests |
154 | 200 | 139 | (46 | ) | (23 | )% | 61 | 44 | % | ||||||||||||||||||
|
|
|
|
|
|
|
|
|
|
|
|||||||||||||||||||
| Net income (loss) |
$ | 563 | $ | 435 | $ | (2 | ) | $ | 128 | 29 | % | $ | 437 | NM | (1) | |||||||||||||
|
|
|
|
|
|
|
|
|
|
|
|||||||||||||||||||
| (1) | We define “NM” as not meaningful for increases or decreases greater than 200%. |
152
International Mortgage Insurance segment
Segment results of operations
The following table sets forth the results of operations relating to our International Mortgage Insurance segment for the periods indicated:
| Years ended December 31, | Increase (decrease)
and percentage change |
|||||||||||||||||||||||||||
| (Amounts in millions) |
2013 | 2012 | 2011 | 2013 vs. 2012 | 2012 vs. 2011 | |||||||||||||||||||||||
| Revenues: |
||||||||||||||||||||||||||||
| Premiums |
$ | 996 | $ | 1,016 | $ | 1,063 | $ | (20 | ) | (2 | )% | $ | (47 | ) | (4 | )% | ||||||||||||
| Net investment income |
333 | 375 | 393 | (42 | ) | (11 | )% | (18 | ) | (5 | )% | |||||||||||||||||
| Net investment gains (losses) |
32 | 16 | 42 | 16 | 100 | % | (26 | ) | (62 | )% | ||||||||||||||||||
| Insurance and investment product fees and other |
— | 1 | 9 | (1 | ) | (100 | )% | (8 | ) | (89 | )% | |||||||||||||||||
|
|
|
|
|
|
|
|
|
|
|
|||||||||||||||||||
| Total revenues |
1,361 | 1,408 | 1,507 | (47 | ) | (3 | )% | (99 | ) | (7 | )% | |||||||||||||||||
|
|
|
|
|
|
|
|
|
|
|
|||||||||||||||||||
| Benefits and expenses: |
||||||||||||||||||||||||||||
| Benefits and other changes in policy reserves |
317 | 516 | 458 | (199 | ) | (39 | )% | 58 | 13 | % | ||||||||||||||||||
| Acquisition and operating expenses, net of deferrals |
241 | 55 | 248 | 186 | NM | (1) | (193 | ) | (78 | )% | ||||||||||||||||||
| Amortization of deferred acquisition costs and intangibles |
60 | 64 | 66 | (4 | ) | (6 | )% | (2 | ) | (3 | )% | |||||||||||||||||
| Interest expense |
33 | 36 | 31 | (3 | ) | (8 | )% | 5 | 16 | % | ||||||||||||||||||
|
|
|
|
|
|
|
|
|
|
|
|||||||||||||||||||
| Total benefits and expenses |
651 | 671 | 803 | (20 | ) | (3 | )% | (132 | ) | (16 | )% | |||||||||||||||||
|
|
|
|
|
|
|
|
|
|
|
|||||||||||||||||||
| Income from continuing operations before income taxes |
710 | 737 | 704 | (27 | ) | (4 | )% | 33 | 5 | % | ||||||||||||||||||
| Provision for income taxes |
184 | 188 | 212 | (4 | ) | (2 | )% | (24 | ) | (11 | )% | |||||||||||||||||
|
|
|
|
|
|
|
|
|
|
|
|||||||||||||||||||
| Income from continuing operations |
526 | 549 | 492 | (23 | ) | (4 | )% | 57 | 12 | % | ||||||||||||||||||
| Less: net income attributable to noncontrolling interests |
154 | 200 | 139 | (46 | ) | (23 | )% | 61 | 44 | % | ||||||||||||||||||
|
|
|
|
|
|
|
|
|
|
|
|||||||||||||||||||
| Income from continuing operations available to Genworth Financial, Inc.’s common stockholders |
372 | 349 | 353 | 23 | 7 | % | (4 | ) | (1 | )% | ||||||||||||||||||
| Adjustments to income from continuing operations available to Genworth Financial, Inc.’s common stockholders: |
||||||||||||||||||||||||||||
| Net investment (gains) losses, net of taxes and other adjustments |
(12 | ) | (7 | ) | (25 | ) | (5 | ) | (71 | )% | 18 | 72 | % | |||||||||||||||
| Expenses related to restructuring, net of taxes |
1 | — | — | 1 | NM | (1) | — | — | % | |||||||||||||||||||
|
|
|
|
|
|
|
|
|
|
|
|||||||||||||||||||
| Net operating income |
$ | 361 | $ | 342 | $ | 328 | $ | 19 | 6 | % | $ | 14 | 4 | % | ||||||||||||||
|
|
|
|
|
|
|
|
|
|
|
|||||||||||||||||||
| (1) | We define “NM” as not meaningful for increases or decreases greater than 200%. |
153
The following table sets forth net operating income (loss) for the businesses included in our International Mortgage Insurance segment for the periods indicated:
| Years ended December 31, | Increase (decrease) and percentage change |
|||||||||||||||||||||||||||
| (Amounts in millions) |
2013 | 2012 | 2011 | 2013 vs. 2012 | 2012 vs. 2011 | |||||||||||||||||||||||
| Net operating income: |
||||||||||||||||||||||||||||
| Canada |
$ | 170 | $ | 234 | $ | 159 | $ | (64 | ) | (27 | )% | $ | 75 | 47 | % | |||||||||||||
| Australia |
228 | 142 | 196 | 86 | 61 | % | (54 | ) | (28 | )% | ||||||||||||||||||
| Other Countries |
(37 | ) | (34 | ) | (27 | ) | (3 | ) | (9 | )% | (7 | ) | (26 | )% | ||||||||||||||
|
|
|
|
|
|
|
|
|
|
|
|||||||||||||||||||
| Total net operating income |
$ | 361 | $ | 342 | $ | 328 | $ | 19 | 6 | % | $ | 14 | 4 | % | ||||||||||||||
|
|
|
|
|
|
|
|
|
|
|
|||||||||||||||||||
2013 compared to 2012
Net operating income
| • | Our Canadian mortgage insurance business decreased primarily from a favorable adjustment of $78 million associated with the finalization of the government guarantee framework in the fourth quarter of 2012 that did not recur, as well as lower premiums and net investment income, partially offset by lower losses in 2013. |
| • | Our Australian mortgage insurance business increased primarily from higher premiums and lower losses as 2012 included a reserve strengthening that did not recur, partially offset by lower net investment income and higher operating expenses in 2013. |
| • | Other Countries’ net operating loss increased primarily from lower premiums and net investment income, partially offset by lower losses in 2013. |
| • | The year ended December 31, 2013 also included a decrease of $20 million attributable to changes in foreign exchange rates primarily in Australia. |
Revenues
Premiums
| • | Our Canadian mortgage insurance business decreased $27 million, including a decrease of $12 million attributable to changes in foreign exchange rates, primarily from the seasoning of our larger 2007 and 2008 in-force blocks of business which are past their peak earning potential, partially offset by the elimination of the risk premium related to the Government Guarantee Agreement in 2013. |
| • | Our Australian mortgage insurance business increased $10 million, including a decrease of $22 million attributable to changes in foreign exchange rates, primarily as a result of a larger in-force portfolio and lower ceded reinsurance premiums, partially offset by lower premiums from policy cancellations in 2013. |
| • | Other Countries decreased $3 million, including an increase of $1 million attributable to changes in foreign exchange rates, primarily as a result of the seasoning of our in-force block of business and higher ceded reinsurance premiums, partially offset by higher premiums as result of lender settlements in Ireland in 2013. |
Net investment income. The decrease in net investment income was primarily driven by Australia and Canada from lower reinvestment yields and lower average invested assets in Australia. The year ended December 31, 2013 included a decrease of $12 million attributable to changes in foreign exchange rates.
154
Net investment gains (losses). For further discussion of the change in net investment gains (losses), see the comparison for this line item under “—Investments and Derivative Instruments.”
| • | Our Canadian mortgage insurance business increased $19 million from higher net investment gains from the sale of securities in 2013. |
| • | Other Countries decreased $3 million primarily from lower net investment gains from the sale of securities in 2013. |
Benefits and expenses
Benefits and other changes in policy reserves
| • | Our Canadian mortgage insurance business decreased $54 million, including a decrease of $2 million attributable to changes in foreign exchange rates, primarily driven by lower new delinquencies, net of cures, and lower paid claims due to a shift in regional mix, with fewer claims from Alberta where the severity on paid claims has been higher than other regions. Higher benefits from loss mitigation activities also contributed to the decrease in losses in 2013. |
| • | Our Australian mortgage insurance business decreased $140 million, including a decrease of $6 million attributable to changes in foreign exchange rates, primarily driven by a reserve strengthening in 2012 that did not recur and lower new delinquencies in 2013. In the first quarter of 2012, we strengthened reserves by $82 million due to higher than anticipated frequency and severity of claims paid from later stage delinquencies from prior years, particularly in coastal tourism areas of Queensland as a result of regional economic pressures as well as our 2007 and 2008 books of business which have a higher concentration of self-employed borrowers. In 2013, paid claims were lower as a result of a decrease in both the number of claims and the average claim payment. |
| • | Other Countries decreased $5 million, including an increase of $1 million attributable to changes in foreign exchange rates, primarily from lower new delinquencies, net of cures, particularly in Ireland, and benefits from ongoing loss mitigation activities in 2013. |
Acquisition and operating expenses, net of deferrals
| • | Our Canadian mortgage insurance business increased $173 million, including a decrease of $2 million attributable to changes in foreign exchange rates, primarily from a favorable adjustment of $186 million from the reversal of the accrued liability for exit fees related to the modification of the Government Guarantee Agreement in the fourth quarter of 2012 that did not recur and higher stock-based compensation expense in 2013. |
| • | Our Australian mortgage insurance business increased $11 million, including a decrease of $6 million attributable to changes in foreign exchange rates, primarily from higher operating expenses, including a $6 million charge related to a customer contract in the fourth quarter of 2013, and higher employee compensation and benefit expenses in 2013. |
| • | Other Countries increased $2 million primarily from higher employee compensation and benefit expenses, including a $1 million restructuring charge in 2013. |
Provision for income taxes. The effective tax rate increased to 25.9% for the year ended December 31, 2013 from 25.5% for the year ended December 31, 2012. The increase in the effective tax rate was primarily attributable to decreased tax benefits from lower taxed foreign income, partially offset by changes in uncertain tax positions in Australia. The year ended December 31, 2013 included a decrease of $4 million attributable to changes in foreign exchange rates.
155
Net income attributable to noncontrolling interests. The decrease was primarily from a favorable adjustment of $58 million from the reversal of the accrued liability for exit fees related to the modification of the Government Guarantee Agreement in the fourth quarter of 2012 that did not recur, partially offset by lower losses in 2013.
2012 compared to 2011
Net operating income
| • | Our Canadian mortgage insurance business increased primarily from a favorable adjustment of $78 million associated with the finalization of the new government guarantee framework in the fourth quarter of 2012 and lower losses, partially offset by lower premiums and net investment income in 2012. |
| • | Our Australian mortgage insurance business decreased primarily driven by a reserve strengthening, lower premiums and higher interest expense in 2012, partially offset by higher taxes in 2011. |
| • | Other Countries’ net operating loss increased primarily from the continued aging of existing delinquencies, particularly in Ireland and Italy, as a result of a prolonged economic downturn and lower premiums and net investment income. These were partially offset by lower operating expenses and lower taxes in 2012. |
| • | The year ended December 31, 2012 included a decrease of $1 million attributable to changes in foreign exchange rates. |
Revenues
Premiums
| • | Our Canadian mortgage insurance business decreased $32 million, including a decrease of $9 million attributable to changes in foreign exchange rates, principally from the seasoning of our larger in-force block of business. |
| • | Our Australian mortgage insurance business decreased $4 million primarily driven by lower policy cancellations in 2012 and higher ceded reinsurance premiums, partially offset by increased premiums from an actuarial update to premium recognition factors related to policy cancellation experience in 2012. |
| • | Other Countries decreased $11 million, including a decrease of $3 million attributable to changes in foreign exchange rates, primarily as a result of the seasoning of our in-force block of business and lower premium volume from existing lenders in Europe. |
Net investment income
| • | Our Canadian mortgage insurance business decreased $9 million, including a decrease of $3 million attributable to changes in foreign exchange rates, mainly due to lower reinvestment yields and average invested assets. |
| • | Our Australian mortgage insurance business decreased $3 million, including an increase of $1 million attributable to changes in foreign exchange rates, primarily due to lower reinvestment yields, partially offset by higher average invested assets. |
| • | Other Countries decreased $6 million, including a decrease of $1 million attributable to changes in foreign exchange rates, primarily from lower investment yields as a result of holding higher cash balances in 2012. |
156
Net investment gains (losses). The decrease in net investment gains was largely driven by our Australian mortgage insurance business primarily related to net realized losses from the sale of securities in 2012 compared to net realized gains in 2011, partially offset by higher net realized gains from the sale of securities in Canada and Other Countries.
Insurance and investment product fees and other. The decrease was primarily attributable to Other Countries from currency transactions related to a foreign branch closure in 2011.
Benefits and expenses
Benefits and other changes in policy reserves
| • | Our Canadian mortgage insurance business decreased $35 million, including a decrease of $3 million attributable to changes in foreign exchange rates, primarily driven by lower new delinquencies, net of cures, and higher benefits from loss mitigation activities. Claims paid also decreased due to a shift in regional mix, with fewer claims from Alberta. These decreases were partially offset by a higher average reserve per delinquency. |
| • | Our Australian mortgage insurance business increased $91 million, including an increase of $5 million attributable to changes in foreign exchange rates, primarily driven by reserve strengthening of $82 million in the first quarter of 2012. The reserve strengthening was the result of higher than anticipated frequency and severity of claims paid from later stage delinquencies from prior years, particularly in coastal tourism areas of Queensland as a result of regional economic pressures as well as our 2007 and 2008 vintages which have a higher concentration of self-employed borrowers. Claims paid also increased in 2012 as a result of an increase in both the number of claims and the average claim payment. These increases were partially offset by lower new delinquencies, net of cures, in 2012. |
| • | Other Countries increased $2 million, including a decrease of $4 million attributable to changes in foreign exchange rates, primarily from the continued aging of existing delinquencies, particularly in Ireland and Italy, and a higher average reserve per delinquency. These increases were partially offset by benefits from ongoing loss mitigation activities. |
Acquisition and operating expenses, net of deferrals
| • | Our Canadian mortgage insurance business decreased $191 million, including a decrease of $7 million attributable to changes in foreign exchange rates, largely from a favorable adjustment of $186 million from the reversal of the accrued liability for exit fees related to the modification of the Government Guarantee Agreement in the fourth quarter of 2012. |
| • | Our Australian mortgage insurance business increased $6 million, including an increase of $1 million attributable to changes in foreign exchange rates, primarily attributable to higher employee compensation expenses in 2012. |
| • | Other Countries decreased $8 million, including a decrease of $1 million attributable to changes in foreign exchange rates, primarily as a result of lower operating expenses from cost-saving initiatives in 2012. |
Interest expense. Interest expense increased mainly related to our Australian mortgage insurance business from the issuance of debt by our wholly-owned subsidiary in June 2011.
Provision for income taxes. The effective tax rate decreased to 25.5% for the year ended December 31, 2012 from 30.1% for the year ended December 31, 2011. The decrease in the effective tax rate was primarily attributable to lower taxed foreign income, as well as 2011 changes in uncertain Australian tax positions and a
157
Canadian legislative change. The year ended December 31, 2012 included a decrease of $4 million attributable to changes in foreign exchange rates.
Net income attributable to noncontrolling interests. The increase was primarily from a favorable adjustment of $58 million from the reversal of the accrued liability for exit fees related to the modification of the Government Guarantee Agreement in the fourth quarter of 2012.
International Mortgage Insurance selected operating performance measures
The following table sets forth selected operating performance measures regarding our International Mortgage Insurance segment as of or for the dates indicated:
| As of or for the years
ended December 31, |
Increase (decrease)
and percentage change |
|||||||||||||||||||||||||||
| (Amounts in millions) |
2013 | 2012 | 2011 | 2013 vs. 2012 | 2012 vs. 2011 | |||||||||||||||||||||||
| Primary insurance in-force: |
||||||||||||||||||||||||||||
| Canada |
$ | 298,000 | $ | 303,400 | $ | 261,300 | $ | (5,400 | ) | (2 | )% | $ | 42,100 | 16 | % | |||||||||||||
| Australia |
267,900 | 295,600 | 281,500 | (27,700 | ) | (9 | )% | 14,100 | 5 | % | ||||||||||||||||||
| Other Countries |
26,300 | 32,200 | 32,600 | (5,900 | ) | (18 | )% | (400 | ) | (1 | )% | |||||||||||||||||
|
|
|
|
|
|
|
|
|
|
|
|||||||||||||||||||
| Total |
$ | 592,200 | $ | 631,200 | $ | 575,400 | $ | (39,000 | ) | (6 | )% | $ | 55,800 | 10 | % | |||||||||||||
|
|
|
|
|
|
|
|
|
|
|
|||||||||||||||||||
| Risk in-force: |
||||||||||||||||||||||||||||
| Canada |
$ | 104,300 | $ | 106,200 | $ | 91,500 | $ | (1,900 | ) | (2 | )% | $ | 14,700 | 16 | % | |||||||||||||
| Australia |
93,800 | 103,500 | 98,500 | (9,700 | ) | (9 | )% | 5,000 | 5 | % | ||||||||||||||||||
| Other Countries (1) |
3,600 | 4,300 | 4,500 | (700 | ) | (16 | )% | (200 | ) | (4 | )% | |||||||||||||||||
|
|
|
|
|
|
|
|
|
|
|
|||||||||||||||||||
| Total |
$ | 201,700 | $ | 214,000 | $ | 194,500 | $ | (12,300 | ) | (6 | )% | $ | 19,500 | 10 | % | |||||||||||||
|
|
|
|
|
|
|
|
|
|
|
|||||||||||||||||||
| New insurance written: |
||||||||||||||||||||||||||||
| Canada |
$ | 34,100 | $ | 41,100 | $ | 27,000 | $ | (7,000 | ) | (17 | )% | $ | 14,100 | 52 | % | |||||||||||||
| Australia |
34,600 | 34,900 | 31,700 | (300 | ) | (1 | )% | 3,200 | 10 | % | ||||||||||||||||||
| Other Countries |
2,400 | 1,700 | 3,100 | 700 | 41 | % | (1,400 | ) | (45 | )% | ||||||||||||||||||
|
|
|
|
|
|
|
|
|
|
|
|||||||||||||||||||
| Total |
$ | 71,100 | $ | 77,700 | $ | 61,800 | $ | (6,600 | ) | (8 | )% | $ | 15,900 | 26 | % | |||||||||||||
|
|
|
|
|
|
|
|
|
|
|
|||||||||||||||||||
| Net premiums written: |
||||||||||||||||||||||||||||
| Canada |
$ | 499 | $ | 548 | $ | 542 | $ | (49 | ) | (9 | )% | $ | 6 | 1 | % | |||||||||||||
| Australia |
519 | 493 | 347 | 26 | 5 | % | 146 | 42 | % | |||||||||||||||||||
| Other Countries |
24 | 20 | 34 | 4 | 20 | % | (14 | ) | (41 | )% | ||||||||||||||||||
|
|
|
|
|
|
|
|
|
|
|
|||||||||||||||||||
| Total |
$ | 1,042 | $ | 1,061 | $ | 923 | $ | (19 | ) | (2 | )% | $ | 138 | 15 | % | |||||||||||||
|
|
|
|
|
|
|
|
|
|
|
|||||||||||||||||||
| (1) | As of December 31, 2013 and 2012, risk in-force excluded $316 million and $213 million, respectively, of risk in-force in Europe ceded under quota share reinsurance agreements. |
2013 compared to 2012
Primary insurance in-force and risk in-force
Our businesses in Australia and Canada currently provide 100% coverage on the majority of the loans we insure in those markets. For the purpose of representing our risk in-force, we have computed an “effective” risk in-force amount, which recognizes that the loss on any particular loan will be reduced by the net proceeds received upon sale of the property. Effective risk in-force has been calculated by applying to insurance in-force a factor that represents our highest expected average per-claim payment for any one underwriting year over the life of our businesses in Australia and Canada. For the years ended December 31, 2013 and 2012, this factor was 35%.
158
In Canada, primary insurance in-force and risk in-force included decreases of $20.8 billion and $7.2 billion, respectively, attributable to changes in foreign exchange rates. Excluding the effects of foreign exchange, primary insurance in-force and risk in-force increased primarily as a result of flow new insurance written and bulk transactions in 2013.
In Australia, primary insurance in-force and risk in-force included decreases of $43.9 billion and $15.4 billion, respectively, attributable to changes in foreign exchange rates. Excluding the effects of foreign exchange, the increase in Australia was mainly attributable to flow new insurance written driven by improved housing affordability as interest rates remained low in 2013.
In Other Countries, primary insurance in-force and risk in-force included increases of $900 million and $100 million attributable to changes in foreign exchange rates, respectively. The decrease in Other Countries was mainly attributable to lender settlements in Ireland.
New insurance written
New insurance written in Canada decreased primarily as a result of lower bulk transactions in 2013. Flow new insurance written in Canada also declined mainly attributable to a smaller mortgage originations market, particularly for high loan-to-value refinance transactions, as a result of the changes to mortgage insurance eligibility rules under the government guarantee which took effect in July 2012. The year ended December 31, 2013 included a decrease of $800 million attributable to changes in foreign exchange rates in Canada.
New insurance written in Australia decreased driven by changes in foreign exchange rates. The year ended December 31, 2013 included a decrease of $1.9 billion attributable to changes in foreign exchange rates in Australia. Excluding the effects of foreign exchange, new insurance written in Australia increased mainly attributable to improved housing affordability as interest rates have remained low in 2013.
New insurance written in Other Countries increased primary as a result of a bulk transaction in 2013. Flow new insurance written increased slightly but remained at low levels as the mortgage originations market in Europe continued to be pressured by high unemployment rates and a weak economic environment.
Net premiums written
Most of our international mortgage insurance policies provide for single premiums at the time that loan proceeds are advanced. We initially record the single premiums to unearned premium reserves and recognize the premiums earned over time in accordance with the expected pattern of risk emergence. As of December 31, 2013, our unearned premium reserves were $2,815 million, including a decrease of $300 million attributable to changes in foreign exchange rates, compared to $3,051 million as of December 31, 2012. Excluding the effects of foreign exchange, unearned premium reserves were slightly higher as a result of premiums from new business volume.
Net premiums written in Australia increased primarily from higher flow volume and premium rates. The year ended December 31, 2013 included a decrease of $30 million attributable to changes in foreign exchange rates in Australia.
In Canada, net premiums written decreased primarily from lower flow volume attributable to a smaller mortgage originations market and lower bulk transactions in 2013. The year ended December 31, 2013 included a decrease of $12 million attributable to changes in foreign exchange rates in Canada.
In Other Countries, net premiums written increased primarily from lower ceded reinsurance premiums and a bulk transaction in 2013. The year ended December 31, 2013 included an increase of $1 million attributable to changes in foreign exchange rates in Other Countries.
159
2012 compared to 2011
Primary insurance in-force and risk in-force
Our businesses in Australia and Canada currently provide 100% coverage on the majority of the loans we insure in those markets. For the purpose of representing our risk in-force, we have computed an “effective” risk in-force amount, which recognizes that the loss on any particular loan will be reduced by the net proceeds received upon sale of the property. Effective risk in-force has been calculated by applying to insurance in-force a factor that represents our highest expected average per-claim payment for any one underwriting year over the life of our businesses in Australia and Canada. For the years ended December 31, 2012 and 2011, this factor was 35%.
Primary insurance in-force and risk in-force increased in Canada primarily as a result of several large bulk transactions in 2012. In Australia, primary insurance in-force and risk in-force also increased primarily as a result of flow new insurance written in a larger high loan-to-value mortgage originations market driven by increased refinance activity and improved affordability from recent interest rate declines, partially offset by lower bulk new insurance written. In Other Countries, the decrease was mainly attributable to ongoing loss mitigation activities in Europe and lower volume from existing lenders in Europe. Primary insurance in-force and risk in-force included increases of $12.4 billion and $4.1 billion, respectively, attributable to changes in foreign exchange rates as of December 31, 2012.
New insurance written
New insurance written in Canada increased primarily as a result of several large bulk transactions in 2012. Flow new insurance written in Canada decreased primarily due to lower new insurance written on high loan-to-value refinance transactions as a result of the government guarantee product changes in July 2012. In Australia, the increase in flow new insurance was mainly attributable to increased refinance activity and improved affordability from recent interest rate declines, partially offset by fewer bulk transactions in 2012. In Other Countries, new insurance written declined primarily due to lower volume from existing lenders in Europe. New insurance written included a decrease of $1.1 billion attributable to changes in foreign exchange rates for the year ended December 31, 2012.
Net premiums written
Most of our international mortgage insurance policies provide for single premiums at the time that loan proceeds are advanced. We initially record the single premiums to unearned premium reserves and recognize the premiums earned over time in accordance with the expected pattern of risk emergence. As of December 31, 2012, our unearned premium reserves were $3.1 billion, including an increase of $63 million attributable to changes in foreign exchange rates, compared to $2.9 billion as of December 31, 2011. This increase was primarily attributable to Australia from increased volume driven by improved affordability from recent interest rate declines.
Net premiums written in Canada increased primarily from several large bulk transactions in 2012, partially offset by lower flow net premiums written. Net premiums written from flow transactions decreased as a result of a smaller mortgage originations market, particularly for high loan-to-value refinance transactions due to recent government guarantee product changes in July 2012 and lower premium rates from the shorter amortization loans, partially offset by a shift in mix with purchases comprising a higher proportion of new mortgage originations. Net premiums written in Australia increased primarily from higher flow volume and higher flow premium rates, partially offset by higher ceded reinsurance premiums and lower bulk transactions in 2012. In Other Countries, net premiums written decreased attributable to lower flow new insurance written in Europe, particularly in Italy, in 2012. Net premiums written included a decrease of $13 million attributable to changes in foreign exchange rates for the year ended December 31, 2012.
160
Loss and expense ratios
The following table sets forth the loss and expense ratios for our International Mortgage Insurance segment for the dates indicated:
| Years ended December 31, | Increase (decrease) | |||||||||||||||||||
| 2013 | 2012 | 2011 | 2013 vs. 2012 | 2012 vs. 2011 | ||||||||||||||||
| Loss ratio: |
||||||||||||||||||||
| Canada |
25 | % | 33 | % | 37 | % | (8 | )% | (4 | )% | ||||||||||
| Australia |
34 | % | 70 | % | 47 | % | (36 | )% | 23 | % | ||||||||||
| Other Countries |
115 | % | 122 | % | 91 | % | (7 | )% | 31 | % | ||||||||||
| Total |
32 | % | 51 | % | 43 | % | (19 | )% | 8 | % | ||||||||||
| Expense ratio: |
||||||||||||||||||||
| Canada |
26 | % | (7 | )% | 28 | % | 33 | % | (35 | )% | ||||||||||
| Australia |
25 | % | 25 | % | 34 | % | — | % | (9 | )% | ||||||||||
| Other Countries |
158 | % | 185 | % | 129 | % | (27 | )% | 56 | % | ||||||||||
| Total |
29 | % | 11 | % | 34 | % | 18 | % | (23 | )% | ||||||||||
The loss ratio is the ratio of incurred losses and loss adjustment expenses to net earned premiums. The expense ratio is the ratio of general expenses to net premiums written. In our international mortgage insurance business, general expenses consist of acquisition and operating expenses, net of deferrals, and amortization of DAC and intangibles.
2013 compared to 2012
The loss ratio in Australia decreased primarily attributable to a reserve strengthening in 2012 that did not recur and lower new delinquencies in 2013. In the first quarter of 2012, we strengthened reserves by $82 million due to higher than anticipated frequency and severity of claims paid from later stage delinquencies from prior years, particularly in coastal tourism areas of Queensland as a result of regional economic pressures as well as our 2007 and 2008 books of business which have a higher concentration of self-employed borrowers. The loss ratio in Canada decreased primarily due to lower new delinquencies, net of cures, and lower paid claims due to a shift in regional mix, with fewer claims from Alberta. Higher benefits from loss mitigation activities also contributed to the decrease in the loss ratio. In Other Countries, the loss ratio decreased from lower new delinquencies, net of cures, particularly in Ireland, and benefits from ongoing loss mitigation activities in 2013.
The increase in the overall expense ratio primarily resulted from an increase in Canada. In Canada, the expense ratio increased primarily from a favorable adjustment of $186 million from the reversal of the accrued liability for exit fees related to the modification of the Government Guarantee Agreement in the fourth quarter of 2012 that did not recur and lower net premiums written. Excluding the favorable adjustment, the expense ratio for Canada and the International Mortgage Insurance segment was 27% and 29%, respectively, for the year ended December 31, 2012. The expense ratio in Australia was flat as the increase in net premiums written was offset by higher operating expenses, including a $6 million charge related to a customer contract in the fourth quarter of 2013. In Other Countries, the expense ratio decreased primarily as the increase in net premiums written was higher than the increase in employee compensation and benefit expenses, including a $1 million restructuring charge in the second quarter of 2013.
2012 compared to 2011
The increase in the loss ratio for the year ended December 31, 2012 was primarily attributable to a reserve strengthening in Australia in 2012 and higher losses and lower earned premiums in Europe. In Australia, we strengthened reserves by $82 million in the first quarter of 2012 due to higher than anticipated frequency and severity of claims paid from later stage delinquencies from prior years, particularly in coastal tourism areas of Queensland as a result of regional economic pressures as well as our 2007 and 2008 vintages which have a higher concentration of self-employed borrowers. In Other Countries, the loss ratio increased as a result of increased
161
losses from the continued aging of existing delinquencies, particularly in Ireland and Italy, and lower net earned premiums. In Canada, the loss ratio decreased as a result of lower losses, partially offset by lower net earned premiums.
The decrease in the expense ratio in Canada was largely driven by the reversal of accrued liability for exit fees related to the modification of the Government Guarantee Agreement which resulted in a favorable adjustment of $186 million in the fourth quarter of 2012. Excluding the favorable adjustment, the expense ratio for Canada and the International Mortgage Insurance segment was 27% and 29%, respectively, for the year ended December 31, 2012. In Australia, the expense ratio decreased primarily attributable to higher net premiums written, partially offset by higher employee compensation expenses. The increase in the expense ratio in Other Countries was primarily attributable to lower net premiums written, partially offset by lower operating expenses which benefited from cost-saving initiatives.
International mortgage insurance loan portfolio
The following table sets forth selected financial information regarding the loan-to-value ratio of effective risk in-force of our international mortgage insurance loan portfolio as of December 31:
| (Amounts in millions) |
2013 | 2012 | 2011 | |||||||||
| Canada: |
||||||||||||
| 95.01% and above |
$ | 37,366 | $ | 36,229 | $ | 32,098 | ||||||
| 90.01% to 95.00% |
25,591 | 25,868 | 24,059 | |||||||||
| 80.01% to 90.00% |
19,443 | 19,226 | 16,730 | |||||||||
| 80.00% and below |
21,896 | 24,856 | 18,571 | |||||||||
|
|
|
|
|
|
|
|||||||
| Total |
$ | 104,296 | $ | 106,179 | $ | 91,458 | ||||||
|
|
|
|
|
|
|
|||||||
| Australia: |
||||||||||||
| 95.01% and above |
$ | 17,901 | $ | 18,930 | $ | 16,653 | ||||||
| 90.01% to 95.00% |
22,139 | 23,348 | 20,853 | |||||||||
| 80.01% to 90.00% |
24,290 | 26,651 | 25,111 | |||||||||
| 80.00% and below |
29,425 | 34,520 | 35,901 | |||||||||
|
|
|
|
|
|
|
|||||||
| Total |
$ | 93,755 | $ | 103,449 | $ | 98,518 | ||||||
|
|
|
|
|
|
|
|||||||
| Other Countries: |
||||||||||||
| 95.01% and above |
$ | 593 | $ | 737 | $ | 793 | ||||||
| 90.01% to 95.00% |
1,770 | 2,063 | 2,051 | |||||||||
| 80.01% to 90.00% |
1,047 | 1,284 | 1,360 | |||||||||
| 80.00% and below |
228 | 250 | 285 | |||||||||
|
|
|
|
|
|
|
|||||||
| Total |
$ | 3,638 | $ | 4,334 | $ | 4,489 | ||||||
|
|
|
|
|
|
|
|||||||
| Total: |
||||||||||||
| 95.01% and above |
$ | 55,860 | $ | 55,896 | $ | 49,544 | ||||||
| 90.01% to 95.00% |
49,500 | 51,279 | 46,963 | |||||||||
| 80.01% to 90.00% |
44,780 | 47,161 | 43,201 | |||||||||
| 80.00% and below |
51,549 | 59,626 | 54,757 | |||||||||
|
|
|
|
|
|
|
|||||||
| Total |
$ | 201,689 | $ | 213,962 | $ | 194,465 | ||||||
|
|
|
|
|
|
|
|||||||
In Canada, risk in-force in the 95.01% and above category increased primarily as a result of flow new insurance written. In Canada, risk in-force in the 80.00% and below category decreased primarily as a result of lower bulk transactions in 2013. In Australia, overall risk in-force in all loan-to-value categories decreased primarily as a result of changes in foreign exchange rates in 2013. Excluding the effects of foreign exchange, risk in-force increased in Australia primarily as a result of flow new insurance written. In Other Countries, overall
162
risk in-force in all loan-to-value categories decreased primarily as a result of lender settlements in Ireland in 2013, partially offset by new business volume. Risk in-force included a decrease of $22.5 billion attributable to changes in foreign exchange rates as of December 31, 2013.
The following table sets forth selected financial information regarding the risk in-force of our international mortgage insurance loan portfolio as of December 31:
| (Amounts in millions) |
2013 | 2012 | 2011 | |||||||||
| Loan type: (1) |
||||||||||||
| Fixed rate mortgage |
$ | 4,580 | $ | 4,487 | $ | 3,555 | ||||||
| Adjustable rate mortgage |
197,109 | 209,475 | 190,910 | |||||||||
|
|
|
|
|
|
|
|||||||
| Total |
$ | 201,689 | $ | 213,962 | $ | 194,465 | ||||||
|
|
|
|
|
|
|
|||||||
| Mortgage term: |
||||||||||||
| 15 years and under |
$ | 106,039 | $ | 108,336 | $ | 93,774 | ||||||
| More than 15 years |
95,650 | 105,626 | 100,691 | |||||||||
|
|
|
|
|
|
|
|||||||
| Total |
$ | 201,689 | $ | 213,962 | $ | 194,465 | ||||||
|
|
|
|
|
|
|
|||||||
| (1) | For loan type in this table, any loan with an interest rate that is fixed for an initial term of five years or less is categorized as an adjustable rate mortgage. |
163
Delinquent loans and claims
Our delinquency management process begins with notification by the loan servicer of a delinquency on an insured loan. “Delinquency” is defined in our master policies as the borrower’s failure to pay when due an amount equal to the scheduled monthly mortgage payment under the terms of the mortgage. Generally, the master policies require an insured to notify us of a delinquency no later than 30 days after the borrower has been in default by three monthly payments. We generally consider a loan to be delinquent and establish required reserves if the borrower has failed to make a scheduled mortgage payment. Borrowers default for a variety of reasons, including a reduction of income, unemployment, divorce, illness, inability to manage credit and interest rate levels. Borrowers may cure delinquencies by making all of the delinquent loan payments, agreeing to a loan modification, or by selling the property in full satisfaction of all amounts due under the mortgage. In most cases, delinquencies that are not cured result in a claim under our policy. The following table sets forth the number of loans insured, the number of delinquent loans and the delinquency rate for our international mortgage insurance portfolio as of December 31:
| 2013 | 2012 | 2011 | ||||||||||
| Canada: |
||||||||||||
| Primary insured loans in-force |
1,527,554 | 1,502,858 | 1,362,092 | |||||||||
| Delinquent loans |
1,830 | 2,153 | 2,752 | |||||||||
| Percentage of delinquent loans (delinquency rate) |
0.12 | % | 0.14 | % | 0.20 | % | ||||||
| Flow loan in-force |
1,187,753 | 1,126,468 | 1,064,942 | |||||||||
| Flow delinquent loans |
1,591 | 1,924 | 2,477 | |||||||||
| Percentage of flow delinquent loans (delinquency rate) |
0.13 | % | 0.17 | % | 0.23 | % | ||||||
| Bulk loans in-force |
339,801 | 376,390 | 297,150 | |||||||||
| Bulk delinquent loans (1) |
239 | 229 | 275 | |||||||||
| Percentage of bulk delinquent loans (delinquency rate) |
0.07 | % | 0.06 | % | 0.09 | % | ||||||
| Australia: |
||||||||||||
| Primary insured loans in-force |
1,474,181 | 1,440,719 | 1,437,380 | |||||||||
| Delinquent loans |
4,980 | 5,851 | 7,874 | |||||||||
| Percentage of delinquent loans (delinquency rate) |
0.34 | % | 0.41 | % | 0.55 | % | ||||||
| Flow loan in-force |
1,350,571 | 1,311,052 | 1,289,200 | |||||||||
| Flow delinquent loans |
4,760 | 5,567 | 7,626 | |||||||||
| Percentage of flow delinquent loans (delinquency rate) |
0.35 | % | 0.42 | % | 0.59 | % | ||||||
| Bulk loans in-force |
123,610 | 129,667 | 148,180 | |||||||||
| Bulk delinquent loans (1) |
220 | 284 | 248 | |||||||||
| Percentage of bulk delinquent loans (delinquency rate) |
0.18 | % | 0.22 | % | 0.17 | % | ||||||
| Other Countries: |
||||||||||||
| Primary insured loans in-force |
193,647 | 199,914 | 217,141 | |||||||||
| Delinquent loans |
10,049 | 12,443 | 12,258 | |||||||||
| Percentage of delinquent loans (delinquency rate) |
5.19 | % | 6.22 | % | 5.65 | % | ||||||
| Flow loan in-force |
113,616 | 141,589 | 149,036 | |||||||||
| Flow delinquent loans |
6,442 | 8,537 | 8,919 | |||||||||
| Percentage of flow delinquent loans (delinquency rate) |
5.67 | % | 6.03 | % | 5.98 | % | ||||||
| Bulk loans in-force |
80,031 | 58,325 | 68,105 | |||||||||
| Bulk delinquent loans (1) |
3,607 | 3,906 | 3,339 | |||||||||
| Percentage of bulk delinquent loans (delinquency rate) |
4.51 | % | 6.70 | % | 4.90 | % | ||||||
| Total: |
||||||||||||
| Primary insured loans in-force |
3,195,382 | 3,143,491 | 3,016,613 | |||||||||
| Delinquent loans |
16,859 | 20,447 | 22,884 | |||||||||
| Percentage of delinquent loans (delinquency rate) |
0.53 | % | 0.65 | % | 0.76 | % | ||||||
| Flow loan in-force |
2,651,940 | 2,579,109 | 2,503,178 | |||||||||
| Flow delinquent loans |
12,793 | 16,028 | 19,022 | |||||||||
| Percentage of flow delinquent loans (delinquency rate) |
0.48 | % | 0.62 | % | 0.76 | % | ||||||
| Bulk loans in-force |
543,442 | 564,382 | 513,435 | |||||||||
| Bulk delinquent loans (1) |
4,066 | 4,419 | 3,862 | |||||||||
| Percentage of bulk delinquent loans (delinquency rate) |
0.75 | % | 0.78 | % | 0.75 | % | ||||||
| (1) | Included loans where we were in a secondary loss position for which no reserve was established due to an existing deductible. Excluding these loans, bulk delinquent loans were 4,030, 4,395 and 3,840 as of December 31, 2013, 2012 and 2011, respectively. |
164
In Canada, flow loans in-force increased primarily from new policies written and flow delinquent loans decreased primarily as a result of lower new delinquencies, net of cures. Bulk loans in-force decreased primarily from the expiration of several large bulk transactions in 2013.
In Australia, flow loans in-force increased from new policies written, partially offset by policy cancellations in 2013. Flow delinquent loans decreased as paid claims and cures more than offset new delinquencies.
In Other Countries, flow loans in-force and flow delinquent loans decreased mainly from lender settlements in Ireland in 2013.
U.S. Mortgage Insurance segment
Segment results of operations
The following table sets forth the results of operations relating to our U.S. Mortgage Insurance segment for the periods indicated:
| Years ended December 31, | Increase (decrease) and percentage change |
|||||||||||||||||||||||||||
| (Amounts in millions) |
2013 | 2012 | 2011 | 2013 vs. 2012 | 2012 vs. 2011 | |||||||||||||||||||||||
| Revenues: |
||||||||||||||||||||||||||||
| Premiums |
$ | 554 | $ | 549 | $ | 547 | $ | 5 | 1 | % | $ | 2 | — | % | ||||||||||||||
| Net investment income |
60 | 68 | 104 | (8 | ) | (12 | )% | (36 | ) | (35 | )% | |||||||||||||||||
| Net investment gains (losses) |
— | 36 | 46 | (36 | ) | (100 | )% | (10 | ) | (22 | )% | |||||||||||||||||
| Insurance and investment product fees and other |
2 | 23 | 5 | (21 | ) | (91 | )% | 18 | NM | (1) | ||||||||||||||||||
|
|
|
|
|
|
|
|
|
|
|
|||||||||||||||||||
| Total revenues |
616 | 676 | 702 | (60 | ) | (9 | )% | (26 | ) | (4 | )% | |||||||||||||||||
|
|
|
|
|
|
|
|
|
|
|
|||||||||||||||||||
| Benefits and expenses: |
||||||||||||||||||||||||||||
| Benefits and other changes in policy reserves |
412 | 725 | 1,325 | (313 | ) | (43 | )% | (600 | ) | (45 | )% | |||||||||||||||||
| Acquisition and operating expenses, net of deferrals |
144 | 143 | 156 | 1 | 1 | % | (13 | ) | (8 | )% | ||||||||||||||||||
| Amortization of deferred acquisition costs and intangibles |
6 | 5 | 5 | 1 | 20 | % | — | — | % | |||||||||||||||||||
|
|
|
|
|
|
|
|
|
|
|
|||||||||||||||||||
| Total benefits and expenses |
562 | 873 | 1,486 | (311 | ) | (36 | )% | (613 | ) | (41 | )% | |||||||||||||||||
|
|
|
|
|
|
|
|
|
|
|
|||||||||||||||||||
| Income (loss) from continuing operations before income taxes |
54 | (197 | ) | (784 | ) | 251 | 127 | % | 587 | 75 | % | |||||||||||||||||
| Provision (benefit) for income taxes |
17 | (83 | ) | (290 | ) | 100 | 120 | % | 207 | 71 | % | |||||||||||||||||
|
|
|
|
|
|
|
|
|
|
|
|||||||||||||||||||
| Income (loss) from continuing operations available to Genworth Financial, Inc.’s common stockholders |
37 | (114 | ) | (494 | ) | 151 | 132 | % | 380 | 77 | % | |||||||||||||||||
| Adjustment to income (loss) from continuing operations available to Genworth Financial, Inc.’s common stockholders: |
||||||||||||||||||||||||||||
| Net investment (gains) losses, net of taxes and other adjustments |
— | (24 | ) | (30 | ) | 24 | 100 | % | 6 | 20 | % | |||||||||||||||||
|
|
|
|
|
|
|
|
|
|
|
|||||||||||||||||||
| Net operating income (loss) |
$ | 37 | $ | (138 | ) | $ | (524 | ) | $ | 175 | 127 | % | $ | 386 | 74 | % | ||||||||||||
|
|
|
|
|
|
|
|
|
|
|
|||||||||||||||||||
| (1) | We define “NM” as not meaningful for increases or decreases greater than 200%. |
165
2013 compared to 2012
Net operating income (loss)
We had net operating income of $37 million in 2013 compared to a net operating loss of $138 million in 2012 mainly attributable to the decline in new delinquencies and improvements in net cures and aging on existing delinquencies in 2013.
Revenues
Premiums increased driven by lower ceded reinsurance premiums related to our captive arrangements and a lower accrual for premium refunds on delinquent loans in 2013. These increases were partially offset by lower premiums assumed from an affiliate under an intercompany reinsurance agreement that was terminated effective July 1, 2012.
Net investment income decreased primarily from lower average invested assets in 2013.
The decrease in net investment gains was primarily driven by higher gains on the sale of investment securities in 2012.
Insurance and investment product fees and other income decreased primarily from a gain related to the termination of an external reinsurance arrangement in 2012.
Benefits and expenses
Benefits and other changes in policy reserves decreased due to lower net paid claims of $201 million and a change in reserves of $112 million. The decrease was primarily driven by a decline in new delinquencies and improvements in net cures and aging on existing delinquencies in 2013. Overall delinquencies continued to decline from factors such as increased cure rates resulting from improvements in the overall housing market, fewer new delinquencies and ongoing loss mitigation efforts. Reserves for prior year delinquencies benefited $63 million during 2013 from improvements in net cures and aging.
Acquisition and operating expenses, net of deferrals, increased slightly primarily from a settlement of $4 million with the CFPB to end its review of industry captive reinsurance arrangements that was largely offset by lower operating expenses in 2013.
Provision (benefit) for income taxes. The effective tax rate decreased to 31.5% for the year ended December 31, 2013 from 42.1% for the year ended December 31, 2012. The decrease in the effective tax rate was primarily attributable to the effect of tax favored investment benefits on pre-tax income in 2013 compared to the effect of tax favored investment benefits on a pre-tax loss in 2012 and state income taxes.
2012 compared to 2011
Net operating loss
The decrease in the net operating loss was mainly related to a reserve strengthening in the second quarter of 2011 that did not recur. The decrease was also attributable to a decline in delinquencies from loss mitigation efforts and lower new delinquencies, partially offset by continued aging of existing delinquencies in 2012.
Revenues
Premiums decreased driven primarily by lower insurance in-force and lower premiums assumed from an affiliate under an intercompany reinsurance agreement which was terminated effective July 1, 2012. These
166
decreases were partially offset by lower ceded reinsurance premiums related to our captive reinsurance arrangements.
Net investment income decreased from lower reinvestment yields and lower average invested assets principally driven by the sale of investments from portfolio repositioning activities during 2012.
The decrease in net investment gains was primarily driven by lower gains on the sale of investments from portfolio repositioning activities in 2012.
Insurance and investment product fees and other income increased largely from a gain related to the termination of an external reinsurance arrangement in 2012.
Benefits and expenses
Benefits and other changes in policy reserves decreased due to a decrease in reserves of $759 million, partially offset by an increase in net paid claims of $159 million. The decrease in reserves was primarily driven by lower new delinquencies in 2012 and a reserve strengthening in 2011 that did not recur. In the second quarter of 2011, we strengthened reserves by $299 million primarily related to a decline in cure rates during the second quarter of 2011 for delinquent loans and continued aging of existing delinquencies. Of the reserve strengthening, approximately $102 million was associated with worsening trends in recent experience. These trends were associated with a range of factors, including reduced opportunities to mitigate losses through loan modification actions due to a higher percentage of early stage delinquencies shifting to a more aged delinquency status. Specifically, reduced cure rates were driven by lower levels of borrower self-cures and lender loan modifications outside of government-sponsored modification programs. In addition, our expectations at that time included further deterioration in cure rates and an ongoing weakness in the U.S. residential real estate market. Accordingly, these expectations resulted in an additional reserve strengthening of approximately $197 million in the second quarter of 2011. The increase in net paid claims was attributable to continued aging of the delinquency inventory volume and a significant reduction in ceded claims under our captive reinsurance arrangements.
Acquisition and operating expenses, net of deferrals, decreased primarily from lower operating expenses as a result of a cost-saving initiative in 2011.
Provision (benefit) for income taxes. The effective tax rate increased to 42.1% for the year ended December 31, 2012 from 37.0% for the year ended December 31, 2011. The increase in the effective tax rate was primarily attributable to state income taxes and the increase in tax favored investment benefits in relation to pre-tax results.
U.S. Mortgage Insurance selected operating performance measures
The following table sets forth selected operating performance measures regarding our U.S. Mortgage Insurance segment as of or for the dates indicated:
| As of or for the years ended December 31, |
Increase (decrease) and percentage change |
|||||||||||||||||||||||||||
| (Amounts in millions) |
2013 | 2012 | 2011 | 2013 vs. 2012 | 2012 vs. 2011 | |||||||||||||||||||||||
| Primary insurance in-force |
$ | 109,300 | $ | 110,000 | $ | 116,500 | $ | (700 | ) | (1 | )% | $ | (6,500 | ) | (6 | )% | ||||||||||||
| Risk in-force |
27,000 | 26,400 | 27,400 | 600 | 2 | % | (1,000 | ) | (4 | )% | ||||||||||||||||||
| New insurance written |
22,300 | 16,400 | 10,200 | 5,900 | 36 | % | 6,200 | 61 | % | |||||||||||||||||||
| Net premiums written |
567 | 554 | 556 | 13 | 2 | % | (2 | ) | — | % | ||||||||||||||||||
167
2013 compared to 2012
Primary insurance in-force and risk in-force
Primary insurance in-force decreased as the result of cancellation and lapses in bulk insurance in-force, which decreased from $7.6 billion as of December 31, 2012 to $4.5 billion as of December 31, 2013. This decrease was partially offset by the increase in flow insurance in-force, which increased from $102.4 billion as of December 31, 2012 to $104.8 billion as of December 31, 2013 as a result of new insurance written. In addition, risk in-force increased primarily as a result of higher flow new insurance written, partially offset by the decline in bulk risk in-force. Flow persistency was 81% for the years ended December 31, 2013 and 2012.
New insurance written
New insurance written increased primarily driven by increased penetration in the mortgage insurance origination market in 2013.
Net premiums written
Net premiums written increased due to lower ceded reinsurance premiums related to our captive arrangements in 2013, partially offset by lower premiums assumed from an affiliate under an intercompany reinsurance agreement that was terminated effective July 1, 2012.
2012 compared to 2011
Primary insurance in-force and risk in-force
Primary insurance in-force decreased primarily as a result of lapses driven by an increase in the mortgage refinance market. Our mortgage insurance market share decreased slightly compared to the year ended December 31, 2011 due to tighter mortgage insurance guidelines and our pricing structure, partially offset by an increase in flow new insurance written from an increase in the mortgage insurance origination market. In addition, risk in-force decreased due to tighter mortgage insurance guidelines as well as a continued weak housing market and reduced mortgage credit liquidity. Flow persistency was 81% and 85% for the years ended December 31, 2012 and 2011, respectively.
New insurance written
New insurance written increased primarily driven by an increase in the mortgage refinance originations and increased penetration in the mortgage insurance origination market.
Net premiums written
Net premiums written decreased due to lapses and lower assumed reinsurance premiums, partially offset by higher new insurance written.
Loss and expense ratios
The following table sets forth the loss and expense ratios for our U.S. Mortgage Insurance segment for the dates indicated:
| Years ended December 31, | Increase (decrease) | |||||||||||||||||||
| 2013 | 2012 | 2011 | 2013 vs. 2012 | 2012 vs. 2011 | ||||||||||||||||
| Loss ratio |
74 | % | 132 | % | 241 | % | (58 | )% | (109 | )% | ||||||||||
| Expense ratio |
27 | % | 27 | % | 27 | % | — | % | — | % | ||||||||||
168
The loss ratio is the ratio of incurred losses and loss adjustment expenses to net earned premiums. The expense ratio is the ratio of general expenses to net premiums written. In our U.S. mortgage insurance business, general expenses consist of acquisition and operating expenses, net of deferrals, and amortization of DAC and intangibles.
2013 compared to 2012
The decrease in loss ratio was primarily driven by a decline in new delinquencies and improvements in net cures and aging on existing delinquencies in 2013. Overall delinquencies continued to decline from factors such as increased cure rates resulting from improvements in the overall housing market, fewer new delinquencies and ongoing loss mitigation efforts. Reserves for prior year delinquencies benefited $63 million during 2013 from improvements in net cures and aging levels.
The expense ratio was flat as the settlement of $4 million with the CFPB to end its review of industry captive reinsurance arrangements was offset by lower operating expenses and higher net premiums written in 2013.
2012 compared to 2011
The decrease in the loss ratio was primarily attributable to a decrease in reserves, partially offset by an increase in net paid claims. The decrease in reserves was primarily driven by lower new delinquencies in 2012 and a reserve strengthening in 2011 that did not recur. In 2011, we strengthened reserves by $299 million primarily related to a decline in cure rates during the second quarter of 2011 for delinquent loans and continued aging of existing delinquencies. Of the reserve strengthening, approximately $102 million was associated with worsening trends in recent experience. These trends were associated with a range of factors, including reduced opportunities to mitigate losses through loan modification actions due to a higher percentage of early stage delinquencies shifting to a more aged delinquency status. Specifically, reduced cure rates were driven by lower levels of borrower self-cures and lender loan modifications outside of government-sponsored modification programs. In addition, our expectations at that time included further deterioration in cure rates and an ongoing weakness in the U.S. residential real estate market. Accordingly, these expectations resulted in an additional reserve strengthening of approximately $197 million in the second quarter of 2011. The increase in net paid claims was attributable to continued aging of the delinquency inventory volume and a significant reduction in ceded claims under captive arrangements.
The expense ratio was flat as lower operating expenses as a result of a cost-saving initiative in 2011 were offset by lower written premiums in 2012.
169
U.S. mortgage insurance loan portfolio
The following table sets forth selected financial information regarding our U.S. primary mortgage insurance loan portfolio as of December 31:
| (Amounts in millions) |
2013 | 2012 | 2011 | |||||||||
| Primary risk in-force lender concentration (by original applicant) |
$ | 26,775 | $ | 26,207 | $ | 27,180 | ||||||
| Top 10 lenders |
12,603 | 12,835 | 13,355 | |||||||||
| Top 20 lenders |
14,447 | 14,521 | 15,306 | |||||||||
| Loan-to-value ratio: |
||||||||||||
| 95.01% and above |
$ | 7,377 | $ | 7,238 | $ | 6,848 | ||||||
| 90.01% to 95.00% |
9,966 | 9,297 | 9,563 | |||||||||
| 80.01% to 90.00% |
9,032 | 9,242 | 10,311 | |||||||||
| 80.00% and below |
400 | 430 | 458 | |||||||||
|
|
|
|
|
|
|
|||||||
| Total |
$ | 26,775 | $ | 26,207 | $ | 27,180 | ||||||
|
|
|
|
|
|
|
|||||||
| Loan grade: |
||||||||||||
| Prime |
$ | 25,320 | $ | 24,527 | $ | 25,219 | ||||||
| A minus and sub-prime |
1,455 | 1,680 | 1,961 | |||||||||
|
|
|
|
|
|
|
|||||||
| Total |
$ | 26,775 | $ | 26,207 | $ | 27,180 | ||||||
|
|
|
|
|
|
|
|||||||
| Loan type: (1) |
||||||||||||
| Fixed rate mortgage: |
||||||||||||
| Flow |
$ | 25,996 | $ | 25,293 | $ | 26,133 | ||||||
| Bulk |
432 | 473 | 500 | |||||||||
| Adjustable rate mortgage: |
||||||||||||
| Flow |
331 | 423 | 527 | |||||||||
| Bulk |
16 | 18 | 20 | |||||||||
|
|
|
|
|
|
|
|||||||
| Total |
$ | 26,775 | $ | 26,207 | $ | 27,180 | ||||||
|
|
|
|
|
|
|
|||||||
| Type of documentation: |
||||||||||||
| Alt-A: (2) |
||||||||||||
| Flow |
$ | 475 | $ | 593 | $ | 747 | ||||||
| Bulk |
30 | 35 | 38 | |||||||||
| Standard: (3) |
||||||||||||
| Flow |
25,852 | 25,123 | 25,913 | |||||||||
| Bulk |
418 | 456 | 482 | |||||||||
|
|
|
|
|
|
|
|||||||
| Total |
$ | 26,775 | $ | 26,207 | $ | 27,180 | ||||||
|
|
|
|
|
|
|
|||||||
| Mortgage term: |
||||||||||||
| 15 years and under |
$ | 1,111 | $ | 816 | $ | 534 | ||||||
| More than 15 years |
25,664 | 25,391 | 26,646 | |||||||||
|
|
|
|
|
|
|
|||||||
| Total |
$ | 26,775 | $ | 26,207 | $ | 27,180 | ||||||
|
|
|
|
|
|
|
|||||||
| (1) | For loan type in this table, any loan with an interest rate that is fixed for an initial term of five years or more is categorized as a fixed rate mortgage. |
| (2) | Alt-A loans are originated under programs in which there is a reduced level of verification or disclosure of the borrower’s income or assets and a higher historical and expected delinquency rate than standard documentation loans. |
| (3) | Standard also includes loans with reduced or different documentation requirements that meet specifications of GSE approved underwriting systems with historical and expected delinquency rates consistent with our standard portfolio. |
170
Delinquent loans and claims
The claim process in our U.S. Mortgage Insurance segment is similar to the process we follow in our international mortgage insurance business except that in the United States, the master policies generally require an insured to notify us of a delinquency no later than 10 days after the borrower has been in default by three monthly payments. See “—International Mortgage Insurance—Delinquent loans and claims.” The following table sets forth the number of loans insured, the number of delinquent loans and the delinquency rate for our U.S. mortgage insurance portfolio as of December 31:
| 2013 | 2012 | 2011 | ||||||||||
| Primary insurance: |
||||||||||||
| Insured loans in-force |
624,236 | 658,527 | 714,467 | |||||||||
| Delinquent loans |
51,459 | 69,239 | 87,007 | |||||||||
| Percentage of delinquent loans (delinquency rate) |
8.24 | % | 10.51 | % | 12.18 | % | ||||||
| Flow loan in-force |
586,546 | 595,348 | 633,246 | |||||||||
| Flow delinquent loans |
49,255 | 66,340 | 83,931 | |||||||||
| Percentage of flow delinquent loans (delinquency rate) |
8.40 | % | 11.14 | % | 13.25 | % | ||||||
| Bulk loans in-force |
37,690 | 63,179 | 81,221 | |||||||||
| Bulk delinquent loans (1) |
2,204 | 2,899 | 3,076 | |||||||||
| Percentage of bulk delinquent loans (delinquency rate) |
5.85 | % | 4.59 | % | 3.79 | % | ||||||
| A minus and sub-prime loans in-force |
39,307 | 46,631 | 54,713 | |||||||||
| A minus and sub-prime loans delinquent loans |
10,023 | 12,817 | 16,038 | |||||||||
| Percentage of A minus and sub-prime delinquent loans (delinquency rate) |
25.50 | % | 27.49 | % | 29.31 | % | ||||||
| Pool insurance: |
||||||||||||
| Insured loans in-force |
11,354 | 12,949 | 14,418 | |||||||||
| Delinquent loans |
628 | 721 | 778 | |||||||||
| Percentage of delinquent loans (delinquency rate) |
5.53 | % | 5.57 | % | 5.40 | % | ||||||
| (1) | Included loans where we were in a secondary loss position for which no reserve was established due to an existing deductible. Excluding these loans, bulk delinquent loans were 1,491, 1,415 and 1,592 as of December 31, 2013, 2012 and 2011, respectively. |
Delinquency and foreclosure levels that developed principally in our 2005 through 2008 book years have declined as the United States experienced improvement in its residential real estate market. We also have seen a decline in new delinquencies and lower foreclosure starts in 2013.
171
The following tables set forth flow delinquencies, direct case reserves and risk in-force by aged missed payment status in our U.S. mortgage insurance portfolio as of December 31:
| 2013 | ||||||||||||||||
| (Dollar amounts in millions) |
Delinquencies | Direct case reserves (1) |
Risk in-force |
Reserves as % of risk in-force |
||||||||||||
| Payments in default: |
||||||||||||||||
| 3 payments or less |
13,436 | $ | 121 | $ | 523 | 23 | % | |||||||||
| 4 - 11 payments |
11,854 | 305 | 486 | 63 | % | |||||||||||
| 12 payments or more |
23,965 | 851 | 1,178 | 72 | % | |||||||||||
|
|
|
|
|
|
|
|||||||||||
| Total |
49,255 | $ | 1,277 | $ | 2,187 | 58 | % | |||||||||
|
|
|
|
|
|
|
|||||||||||
| (1) | Direct flow case reserves exclude loss adjustment expenses, incurred but not reported and reinsurance reserves. |
| 2012 | ||||||||||||||||
| (Dollar amounts in millions) |
Delinquencies | Direct case reserves (1) |
Risk in-force |
Reserves as % of risk in-force |
||||||||||||
| Payments in default: |
||||||||||||||||
| 3 payments or less |
16,977 | $ | 150 | $ | 668 | 22 | % | |||||||||
| 4 - 11 payments |
17,398 | 441 | 749 | 59 | % | |||||||||||
| 12 payments or more |
31,965 | 1,137 | 1,562 | 73 | % | |||||||||||
|
|
|
|
|
|
|
|||||||||||
| Total |
66,340 | $ | 1,728 | $ | 2,979 | 58 | % | |||||||||
|
|
|
|
|
|
|
|||||||||||
| (1) | Direct flow case reserves exclude loss adjustment expenses, incurred but not reported and reinsurance reserves. |
172
Primary insurance delinquency rates differ from region to region in the United States at any one time depending upon economic conditions and cyclical growth patterns. The tables below set forth our primary delinquency rates for the various regions of the United States and the 10 largest states by our risk in-force as of the dates indicated. Delinquency rates are shown by region based upon the location of the underlying property, rather than the location of the lender.
| Percent of primary risk in-force as of December 31, 2013 |
Percent of total reserves as of December 31, 2013 (1) |
Delinquency rate as of December 31, | ||||||||||||||||||
| 2013 | 2012 | 2011 | ||||||||||||||||||
| By Region: |
||||||||||||||||||||
| Southeast (2) |
20 | % | 32 | % | 11.02 | % | 14.69 | % | 17.10 | % | ||||||||||
| South Central (3) |
16 | 8 | 5.85 | % | 7.71 | % | 10.15 | % | ||||||||||||
| Northeast (4) |
15 | 20 | 12.30 | % | 13.32 | % | 12.80 | % | ||||||||||||
| Pacific (5) |
12 | 11 | 6.47 | % | 9.72 | % | 12.52 | % | ||||||||||||
| North Central (6) |
11 | 11 | 7.39 | % | 9.81 | % | 11.89 | % | ||||||||||||
| Great Lakes (7) |
10 | 6 | 6.03 | % | 7.78 | % | 9.00 | % | ||||||||||||
| New England (8) |
6 | 4 | 7.74 | % | 9.63 | % | 10.59 | % | ||||||||||||
| Mid-Atlantic (9) |
5 | 5 | 8.18 | % | 9.87 | % | 10.73 | % | ||||||||||||
| Plains (10) |
5 | 3 | 5.46 | % | 6.62 | % | 7.87 | % | ||||||||||||
|
|
|
|
|
|||||||||||||||||
| Total |
100 | % | 100 | % | 8.24 | % | 10.51 | % | 12.18 | % | ||||||||||
|
|
|
|
|
|||||||||||||||||
| (1) | Total reserves were $1,482 million as of December 31, 2013. |
| (2) | Alabama, Arkansas, Florida, Georgia, Mississippi, North Carolina, South Carolina and Tennessee. |
| (3) | Arizona, Colorado, Louisiana, New Mexico, Oklahoma, Texas and Utah. |
| (4) | New Jersey, New York and Pennsylvania. |
| (5) | Alaska, California, Hawaii, Nevada, Oregon and Washington. |
| (6) | Illinois, Minnesota, Missouri and Wisconsin. |
| (7) | Indiana, Kentucky, Michigan and Ohio. |
| (8) | Connecticut, Maine, Massachusetts, New Hampshire, Rhode Island and Vermont. |
| (9) | Delaware, Maryland, Virginia, Washington D.C. and West Virginia. |
| (10) | Idaho, Iowa, Kansas, Montana, Nebraska, North Dakota, South Dakota and Wyoming. |
| Percent of primary risk in-force as of December 31, 2013 |
Percent of total reserves as of December 31, 2013 (1) |
Delinquency rate as of December 31, | ||||||||||||||||||
| 2013 | 2012 | 2011 | ||||||||||||||||||
| By State: |
||||||||||||||||||||
| California |
7 | % | 4 | % | 4.27 | % | 7.25 | % | 10.86 | % | ||||||||||
| Texas |
7 | % | 3 | % | 5.68 | % | 6.86 | % | 8.34 | % | ||||||||||
| New York |
7 | % | 9 | % | 11.90 | % | 11.85 | % | 10.66 | % | ||||||||||
| Florida |
6 | % | 22 | % | 19.50 | % | 26.24 | % | 29.30 | % | ||||||||||
| Illinois |
5 | % | 7 | % | 9.67 | % | 14.29 | % | 16.70 | % | ||||||||||
| New Jersey |
4 | % | 8 | % | 16.76 | % | 19.44 | % | 19.07 | % | ||||||||||
| Pennsylvania |
4 | % | 3 | % | 9.73 | % | 11.23 | % | 11.85 | % | ||||||||||
| Georgia |
4 | % | 3 | % | 8.48 | % | 11.88 | % | 14.79 | % | ||||||||||
| North Carolina |
4 | % | 2 | % | 7.43 | % | 9.99 | % | 11.89 | % | ||||||||||
| Ohio |
4 | % | 2 | % | 6.69 | % | 8.03 | % | 8.73 | % | ||||||||||
| (1) | Total reserves were $1,482 million as of December 31, 2013. |
The frequency of delinquencies may not correlate directly with the number of claims received because the rate at which delinquencies are cured is influenced by borrowers’ financial resources and circumstances and regional economic differences. Whether an uncured delinquency leads to a claim principally depends upon the borrower’s equity at the time of delinquency and the borrower’s or the insured’s ability to sell the home for an amount sufficient to satisfy all amounts due under the mortgage loan. When we receive notice of a delinquency,
173
we use a proprietary model to determine whether a delinquent loan is a candidate for workout. When the model identifies such a candidate, our loan workout specialists prioritize cases for loss mitigation based upon the likelihood that the loan will result in a claim. Loss mitigation actions include loan modification, extension of credit to bring a loan current, foreclosure forbearance, pre-foreclosure sale and deed-in-lieu. These loss mitigation efforts often are an effective way to reduce our claim exposure and ultimate payouts.
The following table sets forth the dispersion of our total reserves and primary insurance in-force and risk in-force by year of policy origination and average annual mortgage interest rate as of December 31, 2013:
| (Amounts in millions) |
Average rate |
Percent of total reserves (1) |
Primary insurance in-force |
Percent of total |
Primary risk in-force |
Percent of total |
||||||||||||||||||
| Policy Year |
||||||||||||||||||||||||
| 2002 and prior |
7.33 | % | 3.4 | % | $ | 1,937 | 1.8 | % | $ | 512 | 1.9 | % | ||||||||||||
| 2003 |
5.68 | % | 3.7 | 2,989 | 2.7 | 628 | 2.4 | |||||||||||||||||
| 2004 |
5.76 | % | 4.8 | 2,997 | 2.7 | 711 | 2.7 | |||||||||||||||||
| 2005 |
5.74 | % | 12.5 | 5,765 | 5.3 | 1,527 | 5.7 | |||||||||||||||||
| 2006 |
6.02 | % | 18.2 | 8,475 | 7.7 | 2,143 | 8.0 | |||||||||||||||||
| 2007 |
5.96 | % | 37.7 | 19,867 | 18.2 | 4,959 | 18.5 | |||||||||||||||||
| 2008 |
5.48 | % | 18.0 | 17,734 | 16.2 | 4,464 | 16.7 | |||||||||||||||||
| 2009 |
4.99 | % | 0.6 | 3,404 | 3.1 | 747 | 2.8 | |||||||||||||||||
| 2010 |
4.69 | % | 0.5 | 4,450 | 4.1 | 1,026 | 3.8 | |||||||||||||||||
| 2011 |
4.47 | % | 0.4 | 5,975 | 5.5 | 1,451 | 5.4 | |||||||||||||||||
| 2012 |
3.76 | % | 0.2 | 13,996 | 12.8 | 3,380 | 12.6 | |||||||||||||||||
| 2013 |
3.94 | % | — | 21,716 | 19.9 | 5,227 | 19.5 | |||||||||||||||||
|
|
|
|
|
|
|
|
|
|
|
|||||||||||||||
| Total portfolio |
5.18 | % | 100.0 | % | $ | 109,305 | 100.0 | % | $ | 26,775 | 100.0 | % | ||||||||||||
|
|
|
|
|
|
|
|
|
|
|
|||||||||||||||
| (1) | Total reserves were $1,482 million as of December 31, 2013. |
Typically, claim activity is not spread evenly throughout the coverage period of a primary insurance book of business. Based upon our experience, the majority of claims on primary U.S. mortgage insurance loans occur in the third through seventh years after loan origination. Historically, few claims were paid during the first two years after loan origination. However, the pattern of claims frequency can be affected by factors such as deteriorating economic conditions that can result in increasing claims which was the case with our 2007 and 2006 books, but we expect the pattern of claims frequency within our 2009 book to return to that of a more traditional claim trend level. Primary insurance written for the period from January 1, 2006 through December 31, 2010 represented 49% of our primary insurance in-force as of December 31, 2013. Historically, traditional primary loans reach their expected peak claim level within a three- to seven-year period. Therefore, the primary loans written during the five-year period ended December 31, 2010, are now within or past their peak claim period. Our A minus and sub-prime loans continue to have earlier incidences of default than our prime loans. Based upon FICO at loan closing, A minus and sub-prime loans represented 5% and 7% of our primary risk in-force as of December 31, 2013 and 2012, respectively.
Primary mortgage insurance claims paid, including loss adjustment expenses, for the year ended December 31, 2013 were $899 million, compared to $1,098 million and $942 million for the years ended December 31, 2012 and 2011, respectively. Pool insurance claims paid for the year ended December 31, 2013 were $5 million, compared to $7 million or less for the years ended December 31, 2012 and 2011.
The ratio of the claim paid to the current risk in-force for a loan is referred to as “claim severity.” The current risk in-force is equal to the unpaid principal amount multiplied by the coverage percentage. The main determinants of claim severity are the age of the mortgage loan, the value of the underlying property, accrued interest on the loan, expenses advanced by the insured and foreclosure expenses. These amounts depend partly
174
upon the time required to complete foreclosure, which varies depending upon state laws. Pre-foreclosure sales, acquisitions and other early workout and claim administration actions help to reduce overall claim severity. Our average primary flow mortgage insurance claim severity was 102%, 95% and 104% for the years ended December 31, 2013, 2012 and 2011, respectively.
Corporate and Other Division
Division results of operations
The following table sets forth the results of operations relating to our Corporate and Other Division. See below for a discussion by segment and Corporate and Other activities.
| Years ended December 31, | Increase (decrease) and percentage change |
|||||||||||||||||||||||||||
| (Amounts in millions) |
2013 | 2012 | 2011 | 2013 vs. 2012 | 2012 vs. 2011 | |||||||||||||||||||||||
| Net operating income (loss): |
||||||||||||||||||||||||||||
| International Protection segment |
$ | 24 | $ | 24 | $ | 91 | $ | — | — | % | $ | (67 | ) | (74 | )% | |||||||||||||
| Runoff segment |
66 | 46 | 27 | 20 | 43 | % | 19 | 70 | % | |||||||||||||||||||
| Corporate and Other activities |
(266 | ) | (205 | ) | (225 | ) | (61 | ) | (30 | )% | 20 | 9 | % | |||||||||||||||
|
|
|
|
|
|
|
|
|
|
|
|||||||||||||||||||
| Total net operating loss |
(176 | ) | (135 | ) | (107 | ) | (41 | ) | (30 | )% | (28 | ) | (26 | )% | ||||||||||||||
| Adjustments to net operating loss: |
||||||||||||||||||||||||||||
| Net investment gains (losses), net of taxes and other adjustments |
(22 | ) | (16 | ) | (123 | ) | (6 | ) | (38 | )% | 107 | 87 | % | |||||||||||||||
| Goodwill impairment, net of taxes |
— | (86 | ) | (19 | ) | 86 | 100 | % | (67 | ) | NM | (1) | ||||||||||||||||
| Gain on sale of business, net of taxes |
— | — | 36 | — | — | % | (36 | ) | (100 | )% | ||||||||||||||||||
| Expenses related to restructuring, net of taxes |
(3 | ) | — | — | (3 | ) | NM | (1) | — | — | % | |||||||||||||||||
| Gains (losses) on early extinguishment of debt, net of taxes |
(20 | ) | (4 | ) | — | (16 | ) | NM | (1) | (4 | ) | NM | (1) | |||||||||||||||
| Income (loss) from discontinued operations, net of taxes |
(12 | ) | 57 | 36 | (69 | ) | (121 | )% | 21 | 58 | % | |||||||||||||||||
|
|
|
|
|
|
|
|
|
|
|
|||||||||||||||||||
| Net loss available to Genworth Financial, Inc.’s common stockholders |
$ | (233 | ) | $ | (184 | ) | $ | (177 | ) | $ | (49 | ) | (27 | )% | $ | (7 | ) | (4 | )% | |||||||||
|
|
|
|
|
|
|
|
|
|
|
|||||||||||||||||||
| (1) | We define “NM” as not meaningful for increases or decreases greater than 200%. |
175
International Protection segment
Segment results of operations
The following table sets forth the results of operations relating to our International Protection segment for the periods indicated:
| Years ended December 31, | Increase (decrease)
and percentage change |
|||||||||||||||||||||||||||
| (Amounts in millions) |
2013 | 2012 | 2011 | 2013 vs. 2012 | 2012 vs. 2011 | |||||||||||||||||||||||
| Revenues: |
||||||||||||||||||||||||||||
| Premiums |
$ | 636 | $ | 682 | $ | 839 | $ | (46 | ) | (7 | )% | $ | (157 | ) | (19 | )% | ||||||||||||
| Net investment income |
119 | 131 | 173 | (12 | ) | (9 | )% | (42 | ) | (24 | )% | |||||||||||||||||
| Net investment gains (losses) |
27 | 6 | (1 | ) | 21 | NM | (1) | 7 | NM | (1) | ||||||||||||||||||
| Insurance and investment product fees and other |
4 | 3 | 11 | 1 | 33 | % | (8 | ) | (73 | )% | ||||||||||||||||||
|
|
|
|
|
|
|
|
|
|
|
|||||||||||||||||||
| Total revenues |
786 | 822 | 1,022 | (36 | ) | (4 | )% | (200 | ) | (20 | )% | |||||||||||||||||
|
|
|
|
|
|
|
|
|
|
|
|||||||||||||||||||
| Benefits and expenses: |
||||||||||||||||||||||||||||
| Benefits and other changes in policy reserves |
159 | 150 | 135 | 9 | 6 | % | 15 | 11 | % | |||||||||||||||||||
| Acquisition and operating expenses, net of deferrals |
433 | 483 | 590 | (50 | ) | (10 | )% | (107 | ) | (18 | )% | |||||||||||||||||
| Amortization of deferred acquisition costs and intangibles |
106 | 113 | 143 | (7 | ) | (6 | )% | (30 | ) | (21 | )% | |||||||||||||||||
| Goodwill impairment |
— | 89 | — | (89 | ) | (100 | )% | 89 | NM | (1) | ||||||||||||||||||
| Interest expense |
42 | 45 | 38 | (3 | ) | (7 | )% | 7 | 18 | % | ||||||||||||||||||
|
|
|
|
|
|
|
|
|
|
|
|||||||||||||||||||
| Total benefits and expenses |
740 | 880 | 906 | (140 | ) | (16 | )% | (26 | ) | (3 | )% | |||||||||||||||||
|
|
|
|
|
|
|
|
|
|
|
|||||||||||||||||||
| Income (loss) from continuing operations before income taxes |
46 | (58 | ) | 116 | 104 | 179 | % | (174 | ) | (150 | )% | |||||||||||||||||
| Provision for income taxes |
7 | 1 | 26 | 6 | NM | (1) | (25 | ) | (96 | )% | ||||||||||||||||||
|
|
|
|
|
|
|
|
|
|
|
|||||||||||||||||||
| Income (loss) from continuing operations available to Genworth Financial, Inc’s common stockholders |
39 | (59 | ) | 90 | 98 | 166 | % | (149 | ) | (166 | )% | |||||||||||||||||
| Adjustments to income (loss) from continuing operations available to Genworth Financial, Inc.’s common stockholders: |
||||||||||||||||||||||||||||
| Net investment (gains) losses, net of taxes and other adjustments |
(18 | ) | (3 | ) | 1 | (15 | ) | NM | (1) | (4 | ) | NM | (1) | |||||||||||||||
| Goodwill impairment, net of taxes |
— | 86 | — | (86 | ) | (100 | )% | 86 | NM | (1) | ||||||||||||||||||
| Expenses related to restructuring, net of taxes |
3 | — | — | 3 | NM | (1) | — | — | % | |||||||||||||||||||
|
|
|
|
|
|
|
|
|
|
|
|||||||||||||||||||
| Net operating income |
$ | 24 | $ | 24 | $ | 91 | $ | — | — | % | $ | (67 | ) | (74 | )% | |||||||||||||
|
|
|
|
|
|
|
|
|
|
|
|||||||||||||||||||
| (1) | We define “NM” as not meaningful for increases or decreases greater than 200%. |
2013 compared to 2012
Net operating income
Net operating income was flat as lower premiums and net investment income were offset by lower operating expenses in 2013. The year ended December 31, 2013 included an increase of $3 million attributable to changes in foreign exchange rates.
176
Revenues
Premiums decreased primarily due to lower premiums from our runoff clients and lower premium volume driven by continued reduced levels of consumer lending in Europe in 2013. The year ended December 31, 2013 included an increase of $16 million attributable to changes in foreign exchange rates.
Net investment income decreased principally attributable to lower reinvestment yields and lower average invested assets, partially offset by reinsurance arrangements accounted for under the deposit method as certain of these arrangements were in a higher gain position in 2013. The year ended December 31, 2013 included an increase of $3 million attributable to changes in foreign exchange rates.
Net investment gains increased mainly due to higher gains from the sale of investment securities in 2013.
Benefits and expenses
Benefits and other changes in policy reserves increased primarily driven by lower favorable claim reserve adjustments, partially offset by lower paid claims from a decrease in new claim registrations in 2013. The year ended December 31, 2013 included an increase of $4 million attributable to changes in foreign exchange rates.
Acquisition and operating expenses, net of deferrals, decreased largely from lower profit commissions, lower paid commissions related to a decline in new business and lower operating expenses as a result of an ongoing cost-saving initiative. The decrease was also attributable to $3 million of reduced benefit costs driven by the closure of the U.K. pension plan in 2013. These decreases were partially offset by a restructuring charge of $3 million in 2013. The year ended December 31, 2013 included an increase of $9 million attributable to changes in foreign exchange rates.
Amortization of DAC and intangibles decreased primarily as a result of lower premium volume in 2013. The year ended December 31, 2013 included an increase of $2 million attributable to changes in foreign exchange rates.
The goodwill impairment charge recorded during the third quarter of 2012 wrote off the entire goodwill balance for our lifestyle protection insurance business.
Interest expense decreased mainly due to reinsurance arrangements accounted for under the deposit method of accounting as certain of these arrangements were in a lower loss position in 2013. The year ended December 31, 2013 included an increase of $1 million attributable to changes in foreign exchange rates.
Provision for income taxes. The effective tax rate increased to 15.2% for the year ended December 31, 2013 from (1.7)% for the year ended December 31, 2012. This increase in the effective tax rate was primarily attributable to a goodwill impairment in 2012, partially offset by changes in lower taxed foreign income.
2012 compared to 2011
Net operating income
Net operating income decreased as a result of lower premiums and an increase in reserves, partially offset by lower operating expenses. The year ended December 31, 2012 included a decrease of $8 million attributable to changes in foreign exchange rates.
Revenues
Premiums decreased primarily due to lower premium volume driven by reduced levels of consumer lending and lower premiums from the exit of certain client bank relationships. The year ended December 31, 2012 included a decrease of $50 million attributable to changes in foreign exchange rates.
177
Net investment income decreased principally attributable to reinsurance arrangements accounted for under the deposit method as certain of these arrangements were in a lower gain position, lower average invested assets and lower reinvestment yields. The year ended December 31, 2012 included a decrease of $11 million attributable to changes in foreign exchange rates.
We had net investment gains in 2012 from portfolio repositioning activities compared to net investment losses in 2011.
Insurance and investment product fees and other decreased mainly attributable to lower third-party administration fees in 2012 and non-functional currency transactions as a result of changes in foreign exchange rates.
Benefits and expenses
Benefits and other changes in policy reserves increased primarily driven by lower favorable claim reserve adjustments which were partially offset by lower paid claims from a decrease in new claim registrations in 2012. In addition, we reclassified loss adjustment expenses of $12 million from acquisition and operating expenses, net of deferrals, in 2012. The year ended December 31, 2012 included a decrease of $10 million attributable to changes in foreign exchange rates.
Acquisition and operating expenses, net of deferrals, decreased largely from a decrease in paid commissions related to a decline in new business in 2012 and lower operating expenses as a result of a cost-saving initiative in 2011 and 2012. In addition, we reclassified loss adjustment expenses of $12 million to benefits and other changes in policy reserves in 2012. The year ended December 31, 2012 included a decrease of $31 million attributable to changes in foreign exchange rates.
Amortization of DAC and intangibles decreased primarily as a result of lower premium volume in 2012. The year ended December 31, 2012 included a decrease of $8 million attributable to changes in foreign exchange rates.
The goodwill impairment charge was recorded in the third quarter of 2012. See “Critical Accounting Estimates” for additional information. The year ended December 31, 2012 included a decrease of $8 million attributable to changes in foreign exchange rates.
Interest expense increased due to reinsurance arrangements accounted for under the deposit method of accounting as certain of these arrangements were in a higher loss position in 2012. The year ended December 31, 2012 included a decrease of $4 million attributable to changes in foreign exchange rates.
Provision for income taxes. The effective tax rate decreased to (1.7)% for the year ended December 31, 2012 from 22.4% for the year ended December 31, 2011. This decrease in the effective tax rate was primarily attributable to a goodwill impairment in 2012 and changes in lower taxed foreign income in 2012 compared to 2011.
178
International Protection selected operating performance measures
The following table sets forth selected operating performance measures regarding our International Protection segment for the periods indicated:
| Years ended December 31, | Increase (decrease)
and percentage change |
|||||||||||||||||||||||||||
| (Amounts in millions) |
2013 | 2012 | 2011 | 2013 vs. 2012 | 2012 vs. 2011 | |||||||||||||||||||||||
| Net Premiums Written: |
||||||||||||||||||||||||||||
| Northern Europe |
$ | 429 | $ | 429 | $ | 484 | $ | — | — | % | $ | (55 | ) | (11 | )% | |||||||||||||
| Southern Europe |
295 | 316 | 430 | (21 | ) | (7 | )% | (114 | ) | (27 | )% | |||||||||||||||||
| Structured Deals |
151 | 122 | (9 | ) | 29 | 24 | % | 131 | NM | (1) | ||||||||||||||||||
| New Markets |
53 | 31 | 13 | 22 | 71 | % | 18 | 138 | % | |||||||||||||||||||
|
|
|
|
|
|
|
|
|
|
|
|||||||||||||||||||
| Pre-deposit accounting basis |
928 | 898 | 918 | 30 | 3 | % | (20 | ) | (2 | )% | ||||||||||||||||||
|
|
|
|
|
|
|
|
|
|
|
|||||||||||||||||||
| Deposit accounting adjustments |
320 | 279 | 183 | 41 | 15 | % | 96 | 52 | % | |||||||||||||||||||
|
|
|
|
|
|
|
|
|
|
|
|||||||||||||||||||
| Total |
$ | 608 | $ | 619 | $ | 735 | $ | (11 | ) | (2 | )% | $ | (116 | ) | (16 | )% | ||||||||||||
|
|
|
|
|
|
|
|
|
|
|
|||||||||||||||||||
| Loss ratio |
25 | % | 22 | % | 16 | % | 3 | % | 6 | % | ||||||||||||||||||
| (1) | We define “NM” as not meaningful for increases or decreases greater than 200%. |
The loss ratio is the ratio of incurred losses and loss adjustment expenses to net earned premiums.
2013 compared to 2012
Net premiums written declined primarily due to lower premiums from our runoff clients and from reduced levels of consumer lending as a result of deteriorating economic conditions in certain regions, partially offset by sales growth in Germany, Italy, Sweden and Norway in 2013. The year ended December 31, 2013 included an increase of $15 million attributable to changes in foreign exchange rates.
The loss ratio increased mainly driven by a decrease in premiums from our runoff clients and lower premium volume driven by reduced levels of consumer lending in Europe in 2013.
2012 compared to 2011
Net premiums written declined primarily due to lower premiums from our runoff clients and from reduced levels of consumer lending as a result of deteriorating economic conditions in certain regions, partially offset by sales growth in Norway, Sweden, Finland and Germany in 2012. The year ended December 31, 2012 included a decrease of $45 million attributable to changes in foreign exchange rates.
The loss ratio increased mainly driven by lower favorable claim reserve adjustments in 2012 and a decrease in premiums from lower volumes driven by reduced levels of consumer lending and lower premiums from the exit of certain client bank relationships. These increases were partially offset by lower claims paid from a decrease in new claim registrations in 2012.
179
Runoff segment
Segment results of operations
The following table sets forth the results of operations relating to our Runoff segment for the periods indicated:
| Years ended December 31, | Increase (decrease)
and percentage change |
|||||||||||||||||||||||||||
| (Amounts in millions) |
2013 | 2012 | 2011 | 2013 vs. 2012 | 2012 vs. 2011 | |||||||||||||||||||||||
| Revenues: |
||||||||||||||||||||||||||||
| Premiums |
$ | 5 | $ | 5 | $ | 260 | $ | — | — | % | $ | (255 | ) | (98 | )% | |||||||||||||
| Net investment income |
139 | 145 | 140 | (6 | ) | (4 | )% | 5 | 4 | % | ||||||||||||||||||
| Net investment gains (losses) |
(58 | ) | 24 | (174 | ) | (82 | ) | NM | (1) | 198 | 114 | % | ||||||||||||||||
| Insurance and investment product fees and other |
216 | 207 | 299 | 9 | 4 | % | (92 | ) | (31 | )% | ||||||||||||||||||
|
|
|
|
|
|
|
|
|
|
|
|||||||||||||||||||
| Total revenues |
302 | 381 | 525 | (79 | ) | (21 | )% | (144 | ) | (27 | )% | |||||||||||||||||
|
|
|
|
|
|
|
|
|
|
|
|||||||||||||||||||
| Benefits and expenses: |
||||||||||||||||||||||||||||
| Benefits and other changes in policy reserves |
32 | 37 | 234 | (5 | ) | (14 | )% | (197 | ) | (84 | )% | |||||||||||||||||
| Interest credited |
119 | 132 | 135 | (13 | ) | (10 | )% | (3 | ) | (2 | )% | |||||||||||||||||
| Acquisition and operating expenses, net of deferrals |
81 | 79 | 142 | 2 | 3 | % | (63 | ) | (44 | )% | ||||||||||||||||||
| Amortization of deferred acquisition costs and intangibles |
6 | 51 | 70 | (45 | ) | (88 | )% | (19 | ) | (27 | )% | |||||||||||||||||
| Interest expense |
2 | 1 | 2 | 1 | 100 | % | (1 | ) | (50 | )% | ||||||||||||||||||
|
|
|
|
|
|
|
|
|
|
|
|||||||||||||||||||
| Total benefits and expenses |
240 | 300 | 583 | (60 | ) | (20 | )% | (283 | ) | (49 | )% | |||||||||||||||||
|
|
|
|
|
|
|
|
|
|
|
|||||||||||||||||||
| Income (loss) from continuing operations before income taxes |
62 | 81 | (58 | ) | (19 | ) | (23 | )% | 139 | NM | (1) | |||||||||||||||||
| Provision (benefit) for income taxes |
13 | 23 | (21 | ) | (10 | ) | (43 | )% | 44 | NM | (1) | |||||||||||||||||
|
|
|
|
|
|
|
|
|
|
|
|||||||||||||||||||
| Income (loss) from continuing operations available to Genworth Financial, Inc.’s common stockholders |
49 | 58 | (37 | ) | (9 | ) | (16 | )% | 95 | NM | (1) | |||||||||||||||||
| Adjustments to income (loss) from continuing operations available to Genworth Financial, Inc.’s common stockholders: |
||||||||||||||||||||||||||||
| Net investment (gains) losses, net of taxes and other adjustments |
17 | (12 | ) | 100 | 29 | NM | (1) | (112 | ) | (112 | )% | |||||||||||||||||
| Gain on sale of business, net of taxes |
— | — | (36 | ) | — | — | % | 36 | 100 | % | ||||||||||||||||||
|
|
|
|
|
|
|
|
|
|
|
|||||||||||||||||||
| Net operating income |
$ | 66 | $ | 46 | $ | 27 | $ | 20 | 43 | % | $ | 19 | 70 | % | ||||||||||||||
|
|
|
|
|
|
|
|
|
|
|
|||||||||||||||||||
| (1) | We define “NM” as not meaningful for increases or decreases greater than 200%. |
2013 compared to 2012
Net operating income
Net operating income increased by $20 million primarily related to our variable annuity products from favorable equity market performance in 2013. The increase was also attributable to favorable tax benefits and lower interest credited related to our institutional products in 2013.
180
Revenues
Net investment income decreased primarily from lower average invested assets in 2013.
Net investment losses in 2013 were principally from derivative losses and net losses from the sale of investment securities, partially offset by gains on embedded derivatives associated with our variable annuity products with GMWBs. Net investment gains in 2012 were largely related to gains on embedded derivatives associated with our variable annuity products with GMWBs, partially offset by derivative losses, net losses from the sale of investment securities and impairments.
Insurance and investment product fees and other increased mainly attributable to the recapture of a reinsurance agreement related to our corporate-owned life insurance products in 2013, partially offset by lower average account values from outflows of our variable annuity products in 2013.
Benefits and expenses
Benefits and other changes in policy reserves decreased predominately from lower GMDB reserves in our variable annuity products due to favorable equity market performance in 2013.
Interest credited decreased largely related to our institutional products as a result of lower interest paid on our floating rate policyholder liabilities due to a decrease in outstanding liabilities of $1.3 billion in 2013, partially offset by our corporate-owned life insurance products primarily from higher account values in 2013.
Amortization of DAC and intangibles decreased related to our variable annuity products largely from favorable equity market performance in 2013 and $3 million less of unfavorable unlockings in 2013. These decreases were partially offset by higher net investment gains on embedded derivatives associated with our variable annuity products with GMWBs in 2013.
Provision for income taxes. The effective tax rate decreased to 21.0% for the year ended December 31, 2013 from 28.4% for the year ended December 31, 2012. The decrease in the effective tax rate was primarily related to tax favored investment benefits, partially offset by changes in uncertain tax positions and a valuation allowance on foreign tax credit carryforwards.
2012 compared to 2011
Net operating income
Net operating income increased primarily related to our variable annuity products largely from favorable equity market performance in 2012 and a $7 million charge from the discontinuance of our variable annuity offerings in 2011 that did not recur. Net operating income in 2011 included income from our Medicare supplement insurance business that was sold in the fourth quarter of 2011.
Revenues
Premiums decreased driven by the sale of our Medicare supplement insurance business in the fourth quarter of 2011.
Net investment income increased primarily from higher policy loan income in 2012 and an increase in average invested assets in our variable annuity products, partially offset by the sale of our Medicare supplement insurance business in the fourth quarter of 2011 and lower gains of $3 million from limited partnerships accounted for under the equity method in 2012.
181
Net investment gains in 2012 were principally from gains on embedded derivatives associated with our variable annuity products with GMWBs, partially offset by derivative losses, net losses from the sale of investment securities and impairments. Net investment losses in 2011 were largely related to losses on embedded derivatives associated with our variable annuity products with GMWBs and impairments, partially offset by derivative gains and net gains from the sale of investment securities.
Insurance and investment product fees and other decreased mainly attributable to a $79 million gain recognized on the sale of our Medicare supplement insurance business in 2011 that did not recur and lower average account values of our variable annuity products in 2012.
Benefits and expenses
Benefits and other changes in policy reserves decreased primarily attributable to the sale of our Medicare supplement insurance business in the fourth quarter of 2011 and from a decrease in our GMDB reserves in our variable annuity products due to favorable equity market performance in 2012.
Interest credited decreased principally related to our institutional products as a result of lower interest paid on our floating rate policyholder liabilities due to a decrease in average outstanding liabilities.
Acquisition and operating expenses, net of deferrals, decreased principally from the sale of our Medicare supplement insurance business in the fourth quarter of 2011, a $9 million charge from the discontinuance of our variable annuity offerings in 2011 that did not recur and lower production of our variable annuity products in 2012 due to block runoff.
Amortization of DAC and intangibles decreased largely related to the sale of our Medicare supplement insurance business in the fourth quarter of 2011. Our variable annuity products were flat as favorable equity market impacts in 2012 and a $9 million favorable unlocking driven by lower surrenders were offset by higher net investment gains on embedded derivatives associated with our variable annuity products with GMWBs and a $13 million unfavorable unlocking related to our annual review of assumptions.
Provision (benefit) for income taxes. The effective tax rate decreased to 28.4% for the year ended December 31, 2012 from 36.2% for the year ended December 31, 2011. The decrease in the effective tax rate was primarily attributable to the sale of a subsidiary in 2011 that did not recur and changes in tax favored investments.
182
Runoff selected operating performance measures
Variable annuity products
The following table sets forth selected operating performance measures regarding our variable annuity products as of or for the dates indicated:
| As of or for the years ended December 31, |
Increase (decrease) and percentage change |
|||||||||||||||||||||||||||
| (Amounts in millions) |
2013 | 2012 | 2011 | 2013 vs. 2012 | 2012 vs. 2011 | |||||||||||||||||||||||
| Variable Annuities - Income Distribution Series (1) |
||||||||||||||||||||||||||||
| Account value, beginning of period |
$ | 6,141 | $ | 6,265 | $ | 6,590 | $ | (124 | ) | (2 | )% | $ | (325 | ) | (5 | )% | ||||||||||||
| Deposits |
76 | 85 | 203 | (9 | ) | (11 | )% | (118 | ) | (58 | )% | |||||||||||||||||
| Surrenders, benefits and product charges |
(754 | ) | (710 | ) | (686 | ) | (44 | ) | (6 | )% | (24 | ) | (3 | )% | ||||||||||||||
|
|
|
|
|
|
|
|
|
|
|
|||||||||||||||||||
| Net flows |
(678 | ) | (625 | ) | (483 | ) | (53 | ) | (8 | )% | (142 | ) | (29 | )% | ||||||||||||||
| Interest credited and investment performance |
598 | 501 | 158 | 97 | 19 | % | 343 | NM | (2) | |||||||||||||||||||
|
|
|
|
|
|
|
|
|
|
|
|||||||||||||||||||
| Account value, end of period |
$ | 6,061 | $ | 6,141 | $ | 6,265 | $ | (80 | ) | (1 | )% | $ | (124 | ) | (2 | )% | ||||||||||||
|
|
|
|
|
|
|
|
|
|
|
|||||||||||||||||||
| Traditional Variable Annuities |
||||||||||||||||||||||||||||
| Account value, net of reinsurance, beginning of period |
$ | 1,662 | $ | 1,766 | $ | 2,078 | $ | (104 | ) | (6 | )% | $ | (312 | ) | (15 | )% | ||||||||||||
| Deposits |
13 | 13 | 27 | — | — | % | (14 | ) | (52 | )% | ||||||||||||||||||
| Surrenders, benefits and product charges |
(299 | ) | (326 | ) | (343 | ) | 27 | 8 | % | 17 | 5 | % | ||||||||||||||||
|
|
|
|
|
|
|
|
|
|
|
|||||||||||||||||||
| Net flows |
(286 | ) | (313 | ) | (316 | ) | 27 | 9 | % | 3 | 1 | % | ||||||||||||||||
| Interest credited and investment performance |
267 | 209 | 4 | 58 | 28 | % | 205 | NM | (2) | |||||||||||||||||||
|
|
|
|
|
|
|
|
|
|
|
|||||||||||||||||||
| Account value, net of reinsurance, end of period |
$ | 1,643 | $ | 1,662 | $ | 1,766 | $ | (19 | ) | (1 | )% | $ | (104 | ) | (6 | )% | ||||||||||||
|
|
|
|
|
|
|
|
|
|
|
|||||||||||||||||||
| Variable Life Insurance |
||||||||||||||||||||||||||||
| Account value, beginning of period |
$ | 292 | $ | 284 | $ | 313 | $ | 8 | 3 | % | $ | (29 | ) | (9 | )% | |||||||||||||
| Deposits |
9 | 9 | 11 | — | — | % | (2 | ) | (18 | )% | ||||||||||||||||||
| Surrenders, benefits and product charges |
(39 | ) | (39 | ) | (42 | ) | — | — | % | 3 | 7 | % | ||||||||||||||||
|
|
|
|
|
|
|
|
|
|
|
|||||||||||||||||||
| Net flows |
(30 | ) | (30 | ) | (31 | ) | — | — | % | 1 | 3 | % | ||||||||||||||||
| Interest credited and investment performance |
54 | 38 | 2 | 16 | 42 | % | 36 | NM | (2) | |||||||||||||||||||
|
|
|
|
|
|
|
|
|
|
|
|||||||||||||||||||
| Account value, end of period |
$ | 316 | $ | 292 | $ | 284 | $ | 24 | 8 | % | $ | 8 | 3 | % | ||||||||||||||
|
|
|
|
|
|
|
|
|
|
|
|||||||||||||||||||
| (1) | The income distribution series products are comprised of our deferred and immediate variable annuity products, including those variable annuity products with rider options that provide guaranteed income benefits, including GMWBs and certain types of guaranteed annuitization benefits. These products do not include fixed single premium immediate annuities or deferred annuities, which may also serve income distribution needs. |
| (2) | We define “NM” as not meaningful for increases or decreases greater than 200%. |
183
2013 compared to 2012
Variable Annuities - Income Distribution Series
Account value related to our income distribution series products decreased mainly attributable to surrenders outpacing favorable equity market performance, interest credited and deposits during 2013. We no longer solicit sales of our variable annuities; however, we continue to service our existing block of business and accept additional deposits on existing contracts.
Traditional Variable Annuities
In our traditional variable annuities, the decrease in account value was primarily the result of surrenders outpacing favorable equity market performance and interest credited. We no longer solicit sales of our variable annuities; however, we continue to service our existing block of business and accept additional deposits on existing contracts.
Variable Life Insurance
Account value related to our variable life insurance products increased primarily from favorable equity market performance in 2013. We no longer solicit sales of variable life insurance; however, we continue to service our existing block of business.
2012 compared to 2011
Variable Annuities - Income Distribution Series
Account value decreased primarily driven by surrenders outpacing deposits, partially offset by favorable market performance during 2012. We no longer solicit sales of our variable annuities; however, we continue to service our existing block of business and accept additional deposits on existing contracts.
Traditional Variable Annuities
In our traditional variable annuities, account value decreased primarily driven by surrenders outpacing deposits, partially offset by favorable market performance during 2012. We no longer solicit sales of our variable annuities; however, we continue to service our existing block of business and accept additional deposits on existing contracts.
Variable Life Insurance
We no longer solicit sales of variable life insurance; however, we continue to service our existing block of business.
184
Institutional products
The following table sets forth selected operating performance measures regarding our institutional products as of or for the dates indicated:
| As of or for the years ended December 31, |
Increase (decrease) and percentage change |
|||||||||||||||||||||||||||
| (Amounts in millions) |
2013 | 2012 | 2011 | 2013 vs. 2012 | 2012 vs. 2011 | |||||||||||||||||||||||
| GICs, FABNs and Funding Agreements |
||||||||||||||||||||||||||||
| Account value, beginning of period |
$ | 2,153 | $ | 2,623 | $ | 3,717 | $ | (470 | ) | (18 | )% | $ | (1,094 | ) | (29 | )% | ||||||||||||
| Deposits |
— | 84 | — | (84 | ) | (100 | )% | 84 | NM | (1) | ||||||||||||||||||
| Surrenders and benefits |
(1,252 | ) | (630 | ) | (1,199 | ) | (622 | ) | (99 | )% | 569 | 47 | % | |||||||||||||||
|
|
|
|
|
|
|
|
|
|
|
|||||||||||||||||||
| Net flows |
(1,252 | ) | (546 | ) | (1,199 | ) | (706 | ) | (129 | )% | 653 | 54 | % | |||||||||||||||
| Interest credited |
26 | 73 | 106 | (47 | ) | (64 | )% | (33 | ) | (31 | )% | |||||||||||||||||
| Foreign currency translation |
(31 | ) | 3 | (1 | ) | (34 | ) | NM | (1) | 4 | NM | (1) | ||||||||||||||||
|
|
|
|
|
|
|
|
|
|
|
|||||||||||||||||||
| Account value, end of period |
$ | 896 | $ | 2,153 | $ | 2,623 | $ | (1,257 | ) | (58 | )% | $ | (470 | ) | (18 | )% | ||||||||||||
|
|
|
|
|
|
|
|
|
|
|
|||||||||||||||||||
| (1) | We define “NM” as not meaningful for increases or decreases greater than 200%. |
2013 compared to 2012
Account value related to our institutional products decreased mainly attributable to scheduled maturities of these products. Interest credited declined due to a decrease in average outstanding liabilities. Deposits in 2012 related to our participation in the Federal Home Loan Bank program. We explore periodic issuance of our institutional contracts for asset-liability management purposes.
2012 compared to 2011
Account value related to our institutional products decreased from 2011 mainly attributable to scheduled maturities of these products. Interest credited declined due to a decrease in average outstanding liabilities. Deposits in 2012 increased related to our Federal Home Loan Bank membership.
185
Corporate and Other Activities
Results of operations
The following table sets forth the results of operations relating to Corporate and Other activities for the periods indicated:
| Years ended December 31, | Increase (decrease)
and percentage change |
|||||||||||||||||||||||||||
| (Amounts in millions) |
2013 | 2012 | 2011 | 2013 vs. 2012 | 2012 vs. 2011 | |||||||||||||||||||||||
| Revenues: |
||||||||||||||||||||||||||||
| Net investment income |
$ | (1 | ) | $ | 30 | $ | 32 | $ | (31 | ) | (103 | )% | $ | (2 | ) | (6 | )% | |||||||||||
| Net investment gains (losses) |
(35 | ) | (47 | ) | (35 | ) | 12 | 26 | % | (12 | ) | (34 | )% | |||||||||||||||
| Insurance and investment product fees and other |
44 | 120 | 40 | (76 | ) | (63 | )% | 80 | 200 | % | ||||||||||||||||||
|
|
|
|
|
|
|
|
|
|
|
|||||||||||||||||||
| Total revenues |
8 | 103 | 37 | (95 | ) | (92 | )% | 66 | 178 | % | ||||||||||||||||||
|
|
|
|
|
|
|
|
|
|
|
|||||||||||||||||||
| Benefits and expenses: |
||||||||||||||||||||||||||||
| Acquisition and operating expenses, net of deferrals |
102 | 157 | 58 | (55 | ) | (35 | )% | 99 | 171 | % | ||||||||||||||||||
| Amortization of deferred acquisition costs and intangibles |
7 | 12 | 12 | (5 | ) | (42 | )% | — | — | % | ||||||||||||||||||
| Goodwill impairment |
— | — | 29 | — | — | % | (29 | ) | (100 | )% | ||||||||||||||||||
| Interest expense |
318 | 308 | 331 | 10 | 3 | % | (23 | ) | (7 | )% | ||||||||||||||||||
|
|
|
|
|
|
|
|
|
|
|
|||||||||||||||||||
| Total benefits and expenses |
427 | 477 | 430 | (50 | ) | (10 | )% | 47 | 11 | % | ||||||||||||||||||
|
|
|
|
|
|
|
|
|
|
|
|||||||||||||||||||
| Loss from continuing operations before income taxes |
(419 | ) | (374 | ) | (393 | ) | (45 | ) | (12 | )% | 19 | 5 | % | |||||||||||||||
| Benefit for income taxes |
(110 | ) | (134 | ) | (127 | ) | 24 | 18 | % | (7 | ) | (6 | )% | |||||||||||||||
|
|
|
|
|
|
|
|
|
|
|
|||||||||||||||||||
| Loss from continuing operations available to Genworth Financial, Inc.’s common stockholders |
(309 | ) | (240 | ) | (266 | ) | (69 | ) | (29 | )% | 26 | 10 | % | |||||||||||||||
| Adjustments to loss from continuing operations available to Genworth Financial, Inc.’s common stockholders: |
||||||||||||||||||||||||||||
| Net investment (gains) losses, net of taxes and other adjustments |
23 | 31 | 22 | (8 | ) | (26 | )% | 9 | 41 | % | ||||||||||||||||||
| (Gains) losses on early extinguishment of debt, net of taxes |
20 | 4 | — | 16 | NM | (1) | 4 | NM | (1) | |||||||||||||||||||
| Goodwill impairment, net of taxes |
— | — | 19 | — | — | % | (19 | ) | (100 | )% | ||||||||||||||||||
|
|
|
|
|
|
|
|
|
|
|
|||||||||||||||||||
| Net operating loss |
$ | (266 | ) | $ | (205 | ) | $ | (225 | ) | $ | (61 | ) | (30 | )% | $ | 20 | 9 | % | ||||||||||
|
|
|
|
|
|
|
|
|
|
|
|||||||||||||||||||
| (1) | We define “NM” as not meaningful for increases or decreases greater than 200%. |
2013 compared to 2012
Net operating loss
We reported a higher net operating loss in 2013 of $266 million primarily attributable to lower investment income and tax benefits mainly from a correction of non-deductible stock compensation expense in 2013. Higher interest expense also contributed to the higher net operating loss in 2013.
Revenues
Net investment income decreased primarily from the sale of our reverse mortgage business on April 1, 2013, as well as from lower average invested assets and lower gains of $4 million related to limited partnerships in 2013.
186
Net investment losses decreased primarily related to derivative gains in 2013 compared to derivative losses in 2012 and lower impairments in 2013. These increases were partially offset by higher net losses from the sale of investment securities in 2013.
Insurance and investment product fees and other decreased mainly attributable to our reverse mortgage business, which was sold on April 1, 2013.
Benefits and expenses
Acquisition and operating expenses, net of deferrals, decreased primarily attributable to a decrease of $87 million as a result of the sale of our reverse mortgage business on April 1, 2013. This decrease was partially offset by a $30 million make-whole payment related to the debt redemption in 2013.
Amortization of deferred acquisition costs and intangibles decreased from lower software amortization in 2013.
Interest expense increased largely attributable to a favorable adjustment of $20 million in 2012 related to the Tax Matters Agreement with our former parent company that did not recur and from debt issuances in August and December of 2013. These increases were partially offset by the maturity of Genworth Holdings’ senior notes in June 2012 and repurchases of Genworth Holdings’ senior notes that mature in June 2014 of $100 million in the fourth quarter of 2012 and $15 million during June and August of 2013. Genworth Holdings also redeemed $350 million of its senior notes that were due in 2015.
The decrease in the income tax benefit was mainly attributable to an adjustment in 2013 of $25 million, including $13 million from a correction of prior years, related to non-deductible stock compensation expense resulting from cancellations.
2012 compared to 2011
Net operating loss
We reported a lower net operating loss in 2012 compared to 2011 primarily as a result of higher tax benefits and lower interest expense, partially offset by higher operating expenses in 2012.
Revenues
Net investment losses increased primarily related to an increase in derivative losses and higher losses from the sale of securities related to portfolio repositioning in 2012, partially offset by lower impairments in 2012.
Insurance and investment product fees and other increased mainly attributable to higher income related to our reverse mortgage business in 2012.
Benefits and expenses
Acquisition and operating expenses, net of deferrals, increased as a result of $78 million associated with our reverse mortgage business primarily related to broker commissions on loans and higher unallocated expenses to our operating segments in 2012.
The goodwill impairment related to our reverse mortgage business and was recorded in the fourth quarter of 2011.
Interest expense decreased mainly attributable to a $20 million favorable adjustment in 2012 related to the Tax Matters Agreement with our former parent company.
187
The increase in the income tax benefit was primarily related to changes in state income taxes and uncertain tax positions.
Investments and Derivative Instruments
Investment results
The following table sets forth information about our investment income, excluding net investment gains (losses), for each component of our investment portfolio for the periods indicated:
| Years ended December 31, | Increase (decrease) | |||||||||||||||||||||||||||||||||||||||
| 2013 | 2012 | 2011 | 2013 vs. 2012 | 2012 vs. 2011 | ||||||||||||||||||||||||||||||||||||
| (Amounts in millions) |
Yield | Amount | Yield | Amount | Yield | Amount | Yield | Amount | Yield | Amount | ||||||||||||||||||||||||||||||
| Fixed maturity securities—taxable |
4.8 | % | $ | 2,642 | 4.8 | % | $ | 2,666 | 5.0 | % | $ | 2,697 | — | % | $ | (24 | ) | (0.2 | )% | $ | (31 | ) | ||||||||||||||||||
| Fixed maturity securities—non-taxable |
3.1 | % | 9 | 2.9 | % | 11 | 4.0 | % | 35 | 0.2 | % | (2 | ) | (1.1 | )% | (24 | ) | |||||||||||||||||||||||
| Commercial mortgage loans |
5.7 | % | 335 | 5.7 | % | 340 | 5.7 | % | 365 | — | % | (5 | ) | — | % | (25 | ) | |||||||||||||||||||||||
| Restricted commercial mortgage loans related to securitization entities (1) |
7.6 | % | 23 | 8.5 | % | 32 | 8.8 | % | 40 | (0.9 | )% | (9 | ) | (0.3 | )% | (8 | ) | |||||||||||||||||||||||
| Equity securities |
4.2 | % | 17 | 4.4 | % | 19 | 5.4 | % | 19 | (0.2 | )% | (2 | ) | (1.0 | )% | — | ||||||||||||||||||||||||
| Other invested assets (2) |
24.5 | % | 185 | 15.9 | % | 206 | 12.1 | % | 162 | 8.6 | % | (21 | ) | 3.8 | % | 44 | ||||||||||||||||||||||||
| Restricted other invested assets related to securitization entities (1) |
1.1 | % | 4 | 0.3 | % | 1 | — | % | — | 0.8 | % | 3 | 0.3 | % | 1 | |||||||||||||||||||||||||
| Policy loans |
8.1 | % | 129 | 7.7 | % | 123 | 7.9 | % | 120 | 0.4 | % | 6 | (0.2 | )% | 3 | |||||||||||||||||||||||||
| Cash, cash equivalents and short-term investments |
0.5 | % | 20 | 0.8 | % | 35 | 1.0 | % | 37 | (0.3 | )% | (15 | ) | (0.2 | )% | (2 | ) | |||||||||||||||||||||||
|
|
|
|
|
|
|
|
|
|
|
|||||||||||||||||||||||||||||||
| Gross investment income before expenses and fees |
4.8 | % | 3,364 | 4.9 | % | 3,433 | 5.0 | % | 3,475 | (0.1 | )% | (69 | ) | (0.1 | )% | (42 | ) | |||||||||||||||||||||||
| Expenses and fees |
(0.1 | )% | (93 | ) | (0.1 | )% | (90 | ) | (0.1 | )% | (95 | ) | — | % | (3 | ) | — | % | 5 | |||||||||||||||||||||
|
|
|
|
|
|
|
|
|
|
|
|||||||||||||||||||||||||||||||
| Net investment income |
4.7 | % | $ | 3,271 | 4.8 | % | $ | 3,343 | 4.9 | % | $ | 3,380 | (0.1 | )% | $ | (72 | ) | (0.1 | )% | $ | (37 | ) | ||||||||||||||||||
|
|
|
|
|
|
|
|
|
|
|
|||||||||||||||||||||||||||||||
| Average invested assets and cash |
$ | 69,145 | $ | 69,720 | $ | 68,943 | $ | (575 | ) | $ | 777 | |||||||||||||||||||||||||||||
|
|
|
|
|
|
|
|
|
|
|
|||||||||||||||||||||||||||||||
| (1) | See note 18 to our consolidated financial statements under “Item 8—Financial Statements and Supplementary Data” for additional information related to consolidated securitization entities. |
| (2) | Included in other invested assets was $80 million, $83 million and $107 million of net investment income related to reinsurance arrangements accounted for under the deposit method in 2013, 2012 and 2011, respectively. |
Yields are based on net investment income as reported under U.S. GAAP and are consistent with how we measure our investment performance for management purposes. Yields are annualized, for interim periods, and are calculated as net investment income as a percentage of average quarterly asset carrying values except for fixed maturity and equity securities, derivatives and derivative counterparty collateral, which exclude unrealized fair value adjustments and securities lending activity, which is included in other invested assets and is calculated net of the corresponding securities lending liability.
The decrease in overall weighted-average investment yields in 2013 was primarily attributable to lower reinvestment yields and $4 million of lower gains related to limited partnerships, partially offset by higher average invested assets in longer duration products. Net investment income in 2013 also included $11 million of higher bond calls and mortgage loan prepayments compared to 2012.
188
The decrease in overall weighted-average investment yields in 2012 was primarily attributable to lower reinvestment yields and lower income attributable to reinsurance arrangements accounted for under the deposit method of accounting as certain of these arrangements were in a lower gain position in 2012, partially offset by higher average invested assets in longer duration products and $17 million of higher gains related to limited partnerships compared to 2011. Net investment income in 2012 also included $6 million of lower bond calls and prepayments compared to 2011.
The following table sets forth net investment gains (losses) for the years ended December 31:
| (Amounts in millions) |
2013 | 2012 | 2011 | |||||||||
| Available-for-sale securities: |
||||||||||||
| Realized gains |
$ | 176 | $ | 172 | $ | 210 | ||||||
| Realized losses |
(184 | ) | (143 | ) | (160 | ) | ||||||
|
|
|
|
|
|
|
|||||||
| Net realized gains (losses) on available-for-sale securities |
(8 | ) | 29 | 50 | ||||||||
|
|
|
|
|
|
|
|||||||
| Impairments: |
||||||||||||
| Total other-than-temporary impairments |
(16 | ) | (62 | ) | (118 | ) | ||||||
| Portion of other-than-temporary impairments included in other comprehensive income (loss) |
(9 | ) | (44 | ) | (14 | ) | ||||||
|
|
|
|
|
|
|
|||||||
| Net other-than-temporary impairments |
(25 | ) | (106 | ) | (132 | ) | ||||||
|
|
|
|
|
|
|
|||||||
| Trading securities |
(23 | ) | 21 | 27 | ||||||||
| Commercial mortgage loans |
4 | 4 | 6 | |||||||||
| Net gains (losses) related to securitization entities (1) |
69 | 81 | (47 | ) | ||||||||
| Derivative instruments |
(49 | ) | 4 | (99 | ) | |||||||
| Contingent consideration adjustment |
— | (6 | ) | — | ||||||||
| Other |
(5 | ) | — | — | ||||||||
|
|
|
|
|
|
|
|||||||
| Net investment gains (losses) |
$ | (37 | ) | $ | 27 | $ | (195 | ) | ||||
|
|
|
|
|
|
|
|||||||
| (1) | See note 18 to our consolidated financial statements under “Item 8—Financial Statements and Supplementary Data” for additional information related to consolidated securitization entities. |
2013 compared to 2012
| • | We recorded $25 million of net other-than-temporary impairments in 2013 as compared to $106 million in 2012. Of total impairments in 2013 and 2012, $15 million and $80 million, respectively, related to structured securities, including $6 million and $50 million, respectively, related to sub-prime and Alt-A residential mortgage-backed and asset-backed securities. Impairments related to corporate fixed maturity securities which were a result of bankruptcies, receivership or concerns about the issuer’s ability to continue to make contractual payments or intent to sell were $6 million in 2013. Impairments related to corporate securities were $20 million in 2012 predominately attributable to a financial hybrid security related to a bank in the United Kingdom that was downgraded to below investment grade. |
| • | Net investment losses related to derivatives of $49 million in 2013 were primarily associated with derivatives used to protect statutory surplus from equity market fluctuation on embedded derivatives related to variable annuity products with GMWB riders. We also had net losses on the change in derivatives and GMWB embedded derivatives as a result of adjustments to the GMWB embedded derivative related to updating our lapse and mortality assumptions and policyholder funds underperforming as compared to market indices. In addition, there were losses related to hedge ineffectiveness from our cash flow hedge programs for our long-term care insurance business due to an increase in long-term interest rates and losses related to derivatives used to hedge foreign currency risk associated with assets held and derivatives used to hedge macroeconomic conditions in foreign markets. These losses were partially offset by gains driven by |
189
| tightening credit spreads on credit default swaps where we sold protection to improve diversification and portfolio yield, gains related to a non-qualified derivative strategy to mitigate interest rate risk associated with our statutory capital positions and gains related to derivatives used to hedge foreign currency risk associated with near-term expected dividend payments from certain subsidiaries. Net investment gains related to derivatives of $4 million in 2012 were primarily due to gains from the narrowing of credit spreads associated with credit default swaps where we sold protection to improve diversification and portfolio yield. These gains were partially offset by losses related to derivatives used to hedge foreign currency risk associated with near-term expected dividend payments from certain subsidiaries and to mitigate foreign subsidiary macroeconomic risk. Additionally, there were losses on embedded derivatives related to variable annuity products with GMWB riders primarily due to the policyholder funds underperformance of underlying variable annuity funds as compared to market indices and market losses resulting from volatility. |
| • | Net losses related to the sale of available-for-sale securities were $8 million in 2013 compared to net gains of $29 million in 2012. During 2013, we recorded $23 million of losses related to trading securities compared to $21 million of gains in 2012 due to higher unrealized losses offsetting gains on sales of securities. We recorded $12 million of lower net gains related to securitization entities during 2013 compared to 2012 primarily due to losses on trading securities in 2013 compared to gains in 2012. In 2013, we recorded $4 million of net losses related to limited partnerships. We also recorded $6 million of contingent consideration adjustments in 2012. |
| • | The aggregate fair value of securities sold at a loss during the years ended December 31, 2013 and 2012 was $1,794 million from the sale of 395 securities and $1,491 million from the sale of 286 securities, respectively, which was approximately 91% and 92%, respectively, of book value. The loss on sales of securities in 2013 was primarily driven by widening credit spreads. Generally, securities that are sold at a loss represent either small dollar amounts or percentage losses upon disposition. The securities sold at a loss during 2013 included three mortgage-backed securities sold for a total loss of $19 million, one asset-backed security sold for a total loss of $3 million and one corporate security sold for a total loss of $3 million in the first quarter of 2013, three asset-backed securities that were sold for a total loss of $10 million and one mortgage-backed security that was sold for a total loss of $4 million in the second quarter of 2013, one mortgage-backed security that was sold for a total loss of $7 million in the third quarter of 2013 and one corporate security that was sold for a total loss of $3 million in the fourth quarter of 2013 related to portfolio repositioning activities. The securities sold at a loss during 2012 included one U.S. corporate security sold for a total loss of $8 million and one municipal bond sold for a total loss of $4 million in the first quarter of 2012, three foreign bonds sold for a total loss of $5 million in the second quarter of 2012, one foreign corporate security that was sold for a total loss of $2 million in the third quarter of 2012 and five asset-backed securities that were sold for a total loss of $17 million and three U.S. corporate securities that were sold for a total loss of $11 million in the fourth quarter of 2012 related to portfolio repositioning activities. |
2012 compared to 2011
| • | We recorded $106 million of net other-than-temporary impairments in 2012 as compared to $132 million in 2011. Of total impairments, $80 million and $66 million, respectively, related to structured securities, including $50 million and $37 million, respectively, related to sub-prime and Alt-A residential mortgage-backed and asset-backed securities in 2012 and 2011. Impairments related to corporate securities were $20 million in 2012 predominately attributable to a financial hybrid security related to a bank in the United Kingdom that was downgraded to below investment grade. Impairments related to corporate fixed maturity securities which were a result of bankruptcies, receivership or concerns about the issuer’s ability to continue to make contractual payments or intent to sell were $56 million in 2011. In 2012 and 2011, we recorded $1 million and $2 million, respectively, of impairments related to limited partnership investments. In 2011, we also recorded $3 million of impairments related to real estate held-for-investment. |
190
| • | Net investment gains related to derivatives of $4 million in 2012 were primarily due to gains from the narrowing of credit spreads associated with credit default swaps where we sold protection to improve diversification and portfolio yield. These gains were partially offset by losses related to derivatives used to hedge foreign currency risk associated with near-term expected dividend payments from certain subsidiaries and to mitigate foreign subsidiary macroeconomic risk. Additionally, there were losses on embedded derivatives related to variable annuity products with GMWB riders primarily due to the policyholder funds underperformance of underlying variable annuity funds as compared to market indices and market losses resulting from volatility. Net investment losses related to derivatives of $99 million in 2011 were primarily associated with embedded derivatives related to variable annuity products with GMWB riders and credit default swaps. The GMWB losses were primarily attributable to underperformance of the underlying variable annuity funds as compared to market indices and market losses resulting from increased volatility. Additionally, there were losses from the change in market value of our credit default swaps due to widening credit spreads. These losses were partially offset by ineffectiveness gains from our cash flow hedge programs related to our long-term care insurance business attributable to significant long-term interest rate declines. |
| • | Net gains related to the sale of available-for-sale securities were $29 million in 2012 compared to $50 million in 2011. We recorded $81 million of net gains related to securitization entities during 2012 compared to $47 million of net losses during 2011 primarily associated with derivatives. During 2012, we recorded $6 million of contingent consideration adjustments. During 2012, we also recorded $6 million of lower gains related to trading securities compared to 2011. |
| • | The aggregate fair value of securities sold at a loss during the years ended December 31, 2012 and 2011 was $1,491 million from the sale of 286 securities and $1,884 million from the sale of 326 securities, respectively, which was approximately 92% and 93%, respectively, of book value. The loss on sales of securities in 2012 was primarily driven by widening credit spreads. Generally, securities that are sold at a loss represent either small dollar amounts or percentage losses upon disposition. The securities sold at a loss during 2012 included one U.S. corporate security sold for a total loss of $8 million and one municipal bond sold for a total loss of $4 million in the first quarter of 2012, three foreign bonds sold for a total loss of $5 million in the second quarter of 2012, one foreign corporate security that was sold for a total loss of $2 million in the third quarter of 2012 and five asset-backed securities that were sold for a total loss of $17 million and three U.S. corporate securities that were sold for a total loss of $11 million in the fourth quarter of 2012 related to portfolio repositioning activities. The securities sold at a loss during 2011 included two U.S. corporate securities that were sold for a total loss of $11 million in the first quarter of 2011, one foreign corporate security that was sold for a total loss of $11 million in the second quarter of 2011, one U.S. corporate security that was sold for a total loss of $4 million in the third quarter of 2011 and one commercial mortgage obligation that was sold for a total loss of $10 million, one U.S. corporate security that was sold for a total loss of $10 million, one equity security that was sold for a total loss of $7 million and one foreign bond that was sold for a total loss of $4 million in the fourth quarter of 2011 related to portfolio repositioning activities. |
191
Investment portfolio
The following table sets forth our cash, cash equivalents and invested assets as of December 31:
| 2013 | 2012 | |||||||||||||||
| (Amounts in millions) |
Carrying value | % of total | Carrying value | % of total | ||||||||||||
| Fixed maturity securities, available-for-sale: |
||||||||||||||||
| Public |
$ | 44,375 | 61 | % | $ | 47,763 | 61 | % | ||||||||
| Private |
14,254 | 20 | 14,398 | 18 | ||||||||||||
| Commercial mortgage loans |
5,899 | 8 | 5,872 | 8 | ||||||||||||
| Other invested assets |
1,686 | 2 | 3,493 | 4 | ||||||||||||
| Policy loans |
1,434 | 2 | 1,601 | 2 | ||||||||||||
| Restricted other invested assets related to securitization entities (1) |
391 | 1 | 393 | 1 | ||||||||||||
| Equity securities, available-for-sale |
341 | — | 518 | 1 | ||||||||||||
| Restricted commercial mortgage loans related to securitization entities (1) |
233 | — | 341 | — | ||||||||||||
| Cash and cash equivalents |
4,214 | 6 | 3,632 | 5 | ||||||||||||
|
|
|
|
|
|
|
|
|
|||||||||
| Total cash, cash equivalents and invested assets |
$ | 72,827 | 100 | % | $ | 78,011 | 100 | % | ||||||||
|
|
|
|
|
|
|
|
|
|||||||||
| (1) | See note 18 to our consolidated financial statements under “Item 8—Financial Statements and Supplementary Data” for additional information related to consolidated securitization entities. |
For a discussion of the change in cash, cash equivalents and invested assets, see the comparison for this line item under “—Consolidated Balance Sheets.” See note 4 to our consolidated financial statements under “Item 8—Financial Statements and Supplementary Data” for additional information related to our investment portfolio.
We hold fixed maturity, equity and trading securities, derivatives, embedded derivatives, securities held as collateral and certain other financial instruments, which are carried at fair value. Fair value is the price that would be received to sell an asset in an orderly transaction between market participants at the measurement date. As of December 31, 2013, approximately 10% of our investment holdings recorded at fair value was based on significant inputs that were not market observable and were classified as Level 3 measurements. See note 17 in our consolidated financial statements under “Item 8—Financial Statements and Supplementary Data” for additional information related to fair value.
192
Fixed maturity and equity securities
As of December 31, 2013, the amortized cost or cost, gross unrealized gains (losses) and fair value of our fixed maturity and equity securities classified as available-for-sale were as follows:
| Gross unrealized gains | Gross unrealized losses | |||||||||||||||||||||||
| (Amounts in millions) |
Amortized cost or cost |
Not other-than- temporarily impaired |
Other-than- temporarily impaired |
Not other-than- temporarily impaired |
Other-than- temporarily impaired |
Fair value |
||||||||||||||||||
| Fixed maturity securities: |
||||||||||||||||||||||||
| U.S. government, agencies and government-sponsored enterprises |
$ | 4,710 | $ | 331 | $ | — | $ | (231 | ) | $ | — | $ | 4,810 | |||||||||||
| Tax-exempt (1) |
324 | 7 | — | (36 | ) | — | 295 | |||||||||||||||||
| Government—non-U.S. (2) |
2,057 | 104 | — | (15 | ) | — | 2,146 | |||||||||||||||||
| U.S. corporate (2), (3) |
23,614 | 1,761 | 19 | (359 | ) | — | 25,035 | |||||||||||||||||
| Corporate—non-U.S. (2) |
14,489 | 738 | — | (156 | ) | — | 15,071 | |||||||||||||||||
| Residential mortgage-backed (4) |
5,058 | 232 | 9 | (70 | ) | (4 | ) | 5,225 | ||||||||||||||||
| Commercial mortgage-backed |
2,886 | 75 | 2 | (62 | ) | (3 | ) | 2,898 | ||||||||||||||||
| Other asset-backed (4) |
3,171 | 35 | — | (57 | ) | — | 3,149 | |||||||||||||||||
|
|
|
|
|
|
|
|
|
|
|
|
|
|||||||||||||
| Total fixed maturity securities |
56,309 | 3,283 | 30 | (986 | ) | (7 | ) | 58,629 | ||||||||||||||||
| Equity securities |
318 | 36 | — | (13 | ) | — | 341 | |||||||||||||||||
|
|
|
|
|
|
|
|
|
|
|
|
|
|||||||||||||
| Total available-for- sale securities |
$ | 56,627 | $ | 3,319 | $ | 30 | $ | (999 | ) | $ | (7 | ) | $ | 58,970 | ||||||||||
|
|
|
|
|
|
|
|
|
|
|
|
|
|||||||||||||
| (1) | Fair value included municipal bonds of $218 million related to special revenue bonds, $72 million related to general obligation bonds and $5 million related to other municipal bonds. |
| (2) | Fair value included $591 million of European periphery exposure. |
| (3) | Fair value included municipal bonds of $1,089 million related to special revenue bonds and $476 million related to general obligation bonds. |
| (4) | Fair value included $69 million collateralized by sub-prime residential mortgage loans and $98 million collateralized by Alt-A residential mortgage loans. |
193
As of December 31, 2012, the amortized cost or cost, gross unrealized gains (losses) and fair value of our fixed maturity and equity securities classified as available-for-sale were as follows:
| Gross unrealized gains | Gross unrealized losses | |||||||||||||||||||||||
| (Amounts in millions) |
Amortized cost or cost |
Not other-than- temporarily impaired |
Other-than- temporarily impaired |
Not other-than- temporarily impaired |
Other-than- temporarily impaired |
Fair value |
||||||||||||||||||
| Fixed maturity securities: |
||||||||||||||||||||||||
| U.S. government, agencies and government-sponsored enterprises |
$ | 4,484 | $ | 1,025 | $ | — | $ | (18 | ) | $ | — | $ | 5,491 | |||||||||||
| Tax-exempt (1) |
308 | 16 | — | (30 | ) | — | 294 | |||||||||||||||||
| Government—non-U.S. (2) |
2,173 | 250 | — | (1 | ) | — | 2,422 | |||||||||||||||||
| U.S. corporate (2), (3) |
22,873 | 3,317 | 19 | (104 | ) | — | 26,105 | |||||||||||||||||
| Corporate—non-U.S. (2) |
14,577 | 1,262 | — | (47 | ) | — | 15,792 | |||||||||||||||||
| Residential mortgage-backed (4) |
5,744 | 549 | 13 | (124 | ) | (101 | ) | 6,081 | ||||||||||||||||
| Commercial mortgage-backed |
3,253 | 178 | 5 | (82 | ) | (21 | ) | 3,333 | ||||||||||||||||
| Other asset-backed (4) |
2,660 | 50 | — | (65 | ) | (2 | ) | 2,643 | ||||||||||||||||
|
|
|
|
|
|
|
|
|
|
|
|
|
|||||||||||||
| Total fixed maturity securities |
56,072 | 6,647 | 37 | (471 | ) | (124 | ) | 62,161 | ||||||||||||||||
| Equity securities |
483 | 41 | — | (6 | ) | — | 518 | |||||||||||||||||
|
|
|
|
|
|
|
|
|
|
|
|
|
|||||||||||||
| Total available-for- sale securities |
$ | 56,555 | $ | 6,688 | $ | 37 | $ | (477 | ) | $ | (124 | ) | $ | 62,679 | ||||||||||
|
|
|
|
|
|
|
|
|
|
|
|
|
|||||||||||||
| (1) | Fair value included municipal bonds of $206 million related to special revenue bonds, $82 million related to general obligation bonds and $6 million related to other municipal bonds. |
| (2) | Fair value included $612 million of European periphery exposure. |
| (3) | Fair value included municipal bonds of $1,085 million related to special revenue bonds and $440 million related to general obligation bonds. |
| (4) | Fair value included $301 million collateralized by sub-prime residential mortgage loans and $242 million collateralized by Alt-A residential mortgage loans. |
Fixed maturity securities decreased $3.5 billion principally from lower net unrealized gains attributable to the change in interest rates in 2013. Amortized cost increased slightly as purchases exceeded sales and maturities, partially offset by the weakening of foreign currencies, particularly in Australia and Canada, against the U.S. dollar in 2013.
The majority of our unrealized losses were related to securities held in our U.S. Life Insurance segment. Our U.S. Mortgage Insurance segment had gross unrealized losses of $44 million and $31 million as of December 31, 2013 and 2012, respectively.
194
Our exposure in peripheral European countries consists of fixed maturity securities and trading bonds in Greece, Portugal, Ireland, Italy and Spain. Investments in these countries are primarily made to support our international businesses and to diversify our U.S. corporate fixed maturity securities with European bonds denominated in U.S. dollars. The following table sets forth the fair value of our exposure to these peripheral European countries as of December 31:
| Sovereign debt | Non-financial | Financial—hybrids | Financial—non-hybrids | Total | ||||||||||||||||||||||||||||||||||||
| (Amounts in millions) |
2013 | 2012 | 2013 | 2012 | 2013 | 2012 | 2013 | 2012 | 2013 | 2012 | ||||||||||||||||||||||||||||||
| Ireland |
$ | 1 | $ | 3 | $ | 180 | $ | 190 | $ | — | $ | — | $ | 29 | $ | 25 | $ | 210 | $ | 218 | ||||||||||||||||||||
| Spain |
— | — | 133 | 134 | 25 | 22 | 53 | 59 | 211 | 215 | ||||||||||||||||||||||||||||||
| Italy |
8 | 3 | 146 | 167 | — | — | 1 | 1 | 155 | 171 | ||||||||||||||||||||||||||||||
| Portugal |
— | — | 15 | 17 | — | — | — | — | 15 | 17 | ||||||||||||||||||||||||||||||
| Greece |
— | — | — | 1 | — | — | — | — | — | 1 | ||||||||||||||||||||||||||||||
|
|
|
|
|
|
|
|
|
|
|
|
|
|
|
|
|
|
|
|
|
|||||||||||||||||||||
| Total |
$ | 9 | $ | 6 | $ | 474 | $ | 509 | $ | 25 | $ | 22 | $ | 83 | $ | 85 | $ | 591 | $ | 622 | ||||||||||||||||||||
|
|
|
|
|
|
|
|
|
|
|
|
|
|
|
|
|
|
|
|
|
|||||||||||||||||||||
During 2013, we reduced our exposure to the peripheral European countries by $31 million to $591 million with unrealized gains of $18 million. As of December 31, 2013, our exposure was diversified with direct exposure to local economies of $240 million, indirect exposure through debt issued by subsidiaries outside of the European periphery of $79 million and exposure to multinational companies where the majority of revenues come from outside of the country of domicile of $272 million.
Commercial mortgage loans
The following tables set forth additional information regarding our commercial mortgage loans as of December 31:
| 2013 | ||||||||||||||||||||
| (Dollar amounts in millions) |
Total recorded investment |
Number of loans |
Loan-to-value (1) | Delinquent principal balance |
Number of delinquent loans |
|||||||||||||||
| Loan Year |
||||||||||||||||||||
| 2004 and prior |
$ | 941 | 486 | 41 | % | $ | — | — | ||||||||||||
| 2005 |
1,025 | 253 | 55 | % | — | — | ||||||||||||||
| 2006 |
964 | 242 | 62 | % | 32 | 6 | ||||||||||||||
| 2007 |
812 | 157 | 70 | % | 1 | 1 | ||||||||||||||
| 2008 |
237 | 51 | 68 | % | 6 | 1 | ||||||||||||||
| 2009 |
— | — | — | % | — | — | ||||||||||||||
| 2010 |
142 | 63 | 44 | % | — | — | ||||||||||||||
| 2011 |
273 | 54 | 58 | % | — | — | ||||||||||||||
| 2012 |
673 | 97 | 63 | % | — | — | ||||||||||||||
| 2013 |
865 | 138 | 67 | % | — | — | ||||||||||||||
|
|
|
|
|
|
|
|
|
|||||||||||||
| Total |
$ | 5,932 | 1,541 | 59 | % | $ | 39 | 8 | ||||||||||||
|
|
|
|
|
|
|
|
|
|||||||||||||
| (1) | Represents weighted-average loan-to-value as of December 31, 2013. |
195
| 2012 | ||||||||||||||||||||
| (Dollar amounts in millions) |
Total recorded investment |
Number of loans |
Loan-to-value (1) | Delinquent principal balance |
Number of delinquent loans |
|||||||||||||||
| Loan Year |
||||||||||||||||||||
| 2004 and prior |
$ | 1,285 | 614 | 47 | % | $ | 4 | 1 | ||||||||||||
| 2005 |
1,185 | 282 | 59 | % | 2 | 1 | ||||||||||||||
| 2006 |
1,129 | 261 | 67 | % | — | — | ||||||||||||||
| 2007 |
986 | 164 | 75 | % | 66 | 1 | ||||||||||||||
| 2008 |
260 | 56 | 71 | % | 3 | 1 | ||||||||||||||
| 2009 |
— | — | — | % | — | — | ||||||||||||||
| 2010 |
98 | 17 | 58 | % | — | — | ||||||||||||||
| 2011 |
281 | 54 | 63 | % | — | — | ||||||||||||||
| 2012 |
688 | 97 | 66 | % | — | — | ||||||||||||||
|
|
|
|
|
|
|
|
|
|||||||||||||
| Total |
$ | 5,912 | 1,545 | 62 | % | $ | 75 | 4 | ||||||||||||
|
|
|
|
|
|
|
|
|
|||||||||||||
| (1) | Represents weighted-average loan-to-value as of December 31, 2012. |
The following table sets forth the allowance for credit losses and recorded investment in commercial mortgage loans as of or for the years ended December 31:
| (Amounts in millions) |
2013 | 2012 | 2011 | |||||||||
| Allowance for credit losses: |
||||||||||||
| Beginning balance |
$ | 42 | $ | 51 | $ | 59 | ||||||
| Charge-offs |
(2 | ) | (2 | ) | (5 | ) | ||||||
| Recoveries |
— | — | — | |||||||||
| Provision |
(7 | ) | (7 | ) | (3 | ) | ||||||
|
|
|
|
|
|
|
|||||||
| Ending balance |
$ | 33 | $ | 42 | $ | 51 | ||||||
|
|
|
|
|
|
|
|||||||
| Ending allowance for individually impaired loans |
$ | — | $ | — | $ | — | ||||||
|
|
|
|
|
|
|
|||||||
| Ending allowance for loans not individually impaired that were evaluated collectively for impairment |
$ | 33 | $ | 42 | $ | 51 | ||||||
|
|
|
|
|
|
|
|||||||
| Recorded investment: |
||||||||||||
| Ending balance |
$ | 5,932 | $ | 5,912 | $ | 6,140 | ||||||
|
|
|
|
|
|
|
|||||||
| Ending balance of individually impaired loans |
$ | 2 | $ | — | $ | 10 | ||||||
|
|
|
|
|
|
|
|||||||
| Ending balance of loans not individually impaired that were evaluated collectively for impairment |
$ | 5,930 | $ | 5,912 | $ | 6,130 | ||||||
|
|
|
|
|
|
|
|||||||
The charge-offs during 2013, 2012 and 2011 were related to individually impaired commercial mortgage loans.
196
Restricted commercial mortgage loans related to securitization entities
See notes 4 and 18 to our consolidated financial statements under “Item 8—Financial Statements and Supplementary Data” for additional information related to restricted commercial mortgage loans related to securitization entities.
Other invested assets
The following table sets forth the carrying values of our other invested assets as of December 31:
| 2013 | 2012 | |||||||||||||||
| (Amounts in millions) |
Carrying value | % of total | Carrying value | % of total | ||||||||||||
| Derivatives |
$ | 471 | 28 | % | $ | 1,149 | 33 | % | ||||||||
| Limited partnerships |
282 | 17 | 339 | 10 | ||||||||||||
| Trading securities |
239 | 14 | 556 | 16 | ||||||||||||
| Short-term investments |
220 | 13 | 265 | 8 | ||||||||||||
| Derivatives counterparty collateral |
199 | 12 | 840 | 24 | ||||||||||||
| Securities lending collateral |
187 | 11 | 187 | 5 | ||||||||||||
| Other investments |
88 | 5 | 157 | 4 | ||||||||||||
|
|
|
|
|
|
|
|
|
|||||||||
| Total other invested assets |
$ | 1,686 | 100 | % | $ | 3,493 | 100 | % | ||||||||
|
|
|
|
|
|
|
|
|
|||||||||
Derivatives and derivatives counterparty collateral decreased primarily attributable to changes in the long-term interest rate environment in 2013. Trading securities decreased primarily attributable to sales in 2013.
197
Derivatives
The activity associated with derivative instruments can generally be measured by the change in notional value over the periods presented. However, for GMWB and fixed index annuity embedded derivatives, the change between periods is best illustrated by the number of policies. The following tables represent activity associated with derivative instruments as of the dates indicated:
| (Notional in millions) |
Measurement | December 31, 2012 |
Additions | Maturities/ terminations |
December 31, 2013 |
|||||||||||||||
| Derivatives designated as hedges |
||||||||||||||||||||
| Cash flow hedges: |
||||||||||||||||||||
| Interest rate swaps |
Notional | $ | 10,146 | $ | 9,645 | $ | (5,865 | ) | $ | 13,926 | ||||||||||
| Inflation indexed swaps |
Notional | 554 | 11 | (4 | ) | 561 | ||||||||||||||
| Foreign currency swaps |
Notional | 183 | 102 | (250 | ) | 35 | ||||||||||||||
| Forward bond purchase commitments |
Notional | 456 | — | (219 | ) | 237 | ||||||||||||||
|
|
|
|
|
|
|
|
|
|||||||||||||
| Total cash flow hedges |
11,339 | 9,758 | (6,338 | ) | 14,759 | |||||||||||||||
|
|
|
|
|
|
|
|
|
|||||||||||||
| Fair value hedges: |
||||||||||||||||||||
| Interest rate swaps |
Notional | 723 | — | (717 | ) | 6 | ||||||||||||||
| Foreign currency swaps |
Notional | 85 | — | (85 | ) | — | ||||||||||||||
|
|
|
|
|
|
|
|
|
|||||||||||||
| Total fair value hedges |
808 | — | (802 | ) | 6 | |||||||||||||||
|
|
|
|
|
|
|
|
|
|||||||||||||
| Total derivatives designated as hedges |
12,147 | 9,758 | (7,140 | ) | 14,765 | |||||||||||||||
|
|
|
|
|
|
|
|
|
|||||||||||||
| Derivatives not designated as hedges |
||||||||||||||||||||
| Interest rate swaps |
Notional | 6,331 | 961 | (2,470 | ) | 4,822 | ||||||||||||||
| Interest rate swaps related to securitization entities (1) |
Notional | 104 | — | (13 | ) | 91 | ||||||||||||||
| Credit default swaps |
Notional | 932 | 68 | (361 | ) | 639 | ||||||||||||||
| Credit default swaps related to securitization entities (1) |
Notional | 312 | — | — | 312 | |||||||||||||||
| Equity index options |
Notional | 936 | 1,568 | (1,727 | ) | 777 | ||||||||||||||
| Financial futures |
Notional | 1,692 | 5,138 | (5,570 | ) | 1,260 | ||||||||||||||
| Equity return swaps |
Notional | 186 | 138 | (214 | ) | 110 | ||||||||||||||
| Other foreign currency contracts |
Notional | — | 769 | (282 | ) | 487 | ||||||||||||||
|
|
|
|
|
|
|
|
|
|||||||||||||
| Total derivatives not designated as hedges |
10,493 | 8,642 | (10,637 | ) | 8,498 | |||||||||||||||
|
|
|
|
|
|
|
|
|
|||||||||||||
| Total derivatives |
$ | 22,640 | $ | 18,400 | $ | (17,777 | ) | $ | 23,263 | |||||||||||
|
|
|
|
|
|
|
|
|
|||||||||||||
| (1) | See note 18 to our consolidated financial statements under “Item 8—Financial Statements and Supplementary Data” for additional information related to consolidated securitization entities. |
| (Number of policies) |
Measurement | December 31, 2012 |
Additions | Maturities/ terminations |
December 31, 2013 |
|||||||||||||||
| Derivatives not designated as hedges |
||||||||||||||||||||
| GMWB embedded derivatives |
Policies | 45,027 | — | (2,982 | ) | 42,045 | ||||||||||||||
| Fixed index annuity embedded derivatives |
Policies | 2,013 | 5,766 | (74 | ) | 7,705 | ||||||||||||||
The increase in the notional value of derivatives was primarily attributable to a $3.5 billion notional increase in qualified interest rate swaps related to our interest rate hedging strategy associated with our long-term care insurance products. This increase was partially offset by a $1.5 billion notional decrease in interest rate swaps and financial futures associated with our institutional products, a $0.9 billion notional decrease related to a non-qualified derivative strategy to mitigate interest rate risk associated with our statutory capital positions and a $0.4 billion notional decrease related to hedges of the GMWB liability on our variable annuity products.
198
The number of policies related to our GMWB embedded derivatives decreased as variable annuity products are no longer being offered. The number of policies related to our fixed index annuity embedded derivatives increased as a result of product sales.
Consolidated Balance Sheets
Total assets. Total assets decreased $5.3 billion from $113.3 billion as of December 31, 2012 to $108.0 billion as of December 31, 2013.
| • | Cash, cash equivalents and invested assets decreased $5.2 billion primarily from a decrease of $5.8 billion in invested assets, partially offset by an increase in cash and cash equivalents of $0.6 billion. Our fixed maturity securities portfolio decreased $3.5 billion principally from lower net unrealized gains attributable to the change in interest rates in 2013. Amortized cost of our fixed maturity securities portfolio increased slightly as purchases exceeded sales and maturities, partially offset by the weakening of foreign currencies, particularly in Australia and Canada, against the U.S. dollar in 2013. Other invested assets decreased $1.8 billion primarily driven by a decrease in derivatives and derivatives counterparty collateral largely attributable to changes in the long-term interest rate environment, as well as trading securities from sales in 2013. |
Total liabilities. Total liabilities decreased $3.1 billion from $95.5 billion as of December 31, 2012 to $92.4 billion as of December 31, 2013.
| • | Our policyholder-related liabilities decreased $1.1 billion primarily as a result of scheduled maturities in our institutional products and higher benefit payments in our annuity products. Our U.S. mortgage insurance business decreased due to lower delinquencies and higher paid claims in 2013. Our international mortgage insurance business decreased mainly related to lower unearned premiums from changes in foreign exchange rates in 2013. These decreases were partially offset by an increase in our long-term care insurance business from growth of our in-force block and higher claims in 2013. |
| • | Other liabilities decreased $1.1 billion mainly related to a decrease in derivatives and derivative counterparty collateral largely attributable to changes in the long-term interest rate environment in 2013. |
| • | Deferred tax liability decreased $1.3 billion largely from a decline in net unrealized investment gains in 2013. |
| • | Long-term borrowings increased $385 million from two issuances of senior notes with principal of $400 million each during 2013. This increase was partially offset by the repayment of $365 million of senior notes during 2013 and unfavorable changes in foreign exchange on our Canadian and Australian debt. |
Total stockholders’ equity. Total stockholders’ equity decreased $2.2 billion from $17.8 billion as of December 31, 2012 to $15.6 billion as of December 31, 2013.
| • | We reported net income available to Genworth Financial, Inc.’s common stockholders of $560 million for the year ended December 31, 2013. |
| • | Accumulated other comprehensive income (loss) decreased $2.7 billion predominately attributable to lower net unrealized investment gains and derivatives qualifying as hedges mainly related to changes in the long-term interest rate environment. Foreign currency translation also decreased as the U.S. dollar strengthened during 2013. |
Liquidity and Capital Resources
Liquidity and capital resources represent our overall financial strength and our ability to generate cash flows from our businesses, borrow funds at competitive rates and raise new capital to meet our operating and growth needs.
199
Genworth and subsidiaries
The following table sets forth our condensed consolidated cash flows for the years ended December 31:
| (Amounts in millions) |
2013 | 2012 | 2011 | |||||||||
| Net cash from operating activities |
$ | 1,399 | $ | 962 | $ | 3,125 | ||||||
| Net cash from investing activities |
(580 | ) | (722 | ) | (59 | ) | ||||||
| Net cash from financing activities |
(149 | ) | (1,101 | ) | (1,641 | ) | ||||||
|
|
|
|
|
|
|
|||||||
| Net increase (decrease) in cash before foreign exchange effect |
$ | 670 | $ | (861 | ) | $ | 1,425 | |||||
|
|
|
|
|
|
|
|||||||
Our principal sources of cash include sales of our products and services, income from our investment portfolio and proceeds from sales of investments. As an insurance business, we typically generate positive cash flows from operating activities, as premiums collected from our insurance products and income received from our investments exceed policy acquisition costs, benefits paid, redemptions and operating expenses. These positive cash flows are then invested to support the obligations of our insurance and investment products and required capital supporting these products. Our cash flows from operating activities are affected by the timing of premiums, fees and investment income received and benefits and expenses paid. We had higher net cash inflows from operating activities during 2013 compared to 2012 primarily as a result of lower tax settlements in 2012.
In analyzing our cash flow, we focus on the change in the amount of cash available and used in investing activities. We had lower net cash outflows from investing activities during 2013 compared to 2012 from net cash received from the sale of our wealth management and reverse mortgage businesses in 2013 and higher proceeds from policy loan payoffs, partially offset by lower cash inflows from other invested assets in 2013 compared to 2012.
Changes in cash from financing activities primarily relate to the issuance of, and redemptions and benefit payments on, universal life insurance and investment contracts; the issuance and acquisition of debt and equity securities; the issuance and repayment or repurchase of borrowings and non-recourse funding obligations; and dividends to our stockholders and other capital transactions. We had lower net cash outflows from financing activities during 2013 primarily from lower redemptions of non-recourse funding obligations and higher net cash from long-term debt issuances in 2013, partially offset by higher redemptions of our investment contracts in 2013 compared to 2012. See “—Capital resources and financing activities” for further discussion of the uses of proceeds from our long-term debt issuances.
In the United States and Canada, we engage in certain securities lending transactions for the purpose of enhancing the yield on our investment securities portfolio. We maintain effective control over all loaned securities and, therefore, continue to report such securities as fixed maturity securities on the consolidated balance sheets. We are currently indemnified against counterparty credit risk by the intermediary. See note 2 in our consolidated financial statements under “Item 8—Financial Statements and Supplementary Data” for additional information related to our securities lending program.
We also have a repurchase program in which we sell an investment security at a specified price and agree to repurchase that security at another specified price at a later date. See note 2 in our consolidated financial statements under “Item 8—Financial Statements and Supplementary Data” for additional information related to our repurchase program.
Genworth—holding company
Genworth Financial and Genworth Holdings each acts as a holding company for their respective subsidiaries and do not have any significant operations of their own. Dividends from their respective subsidiaries, payments to them under tax sharing and expense reimbursement arrangements with their subsidiaries and proceeds from
200
borrowings or securities issuances are their principal sources of cash to meet their obligations. Insurance laws and regulations regulate the payment of dividends and other distributions to Genworth Financial and Genworth Holdings by their insurance subsidiaries. We expect dividends paid by the insurance subsidiaries will vary depending on strategic objectives, regulatory requirements and business performance.
The primary uses of funds at Genworth Financial and Genworth Holdings include payment of holding company general operating expenses (including taxes), payment of principal, interest and other expenses on current and any future borrowings, payments under current and any future guarantees (including guarantees of certain subsidiary obligations), payment of amounts owed to GE under the Tax Matters Agreement, payments to subsidiaries (and, in the case of Genworth Holdings, to Genworth Financial) under tax sharing agreements, contributions to subsidiaries, repurchases of debt and equity securities, potentially payments for acquisitions, payment of dividends on Genworth Financial common stock (to the extent declared by Genworth Financial’s Board of Directors) and, in the case of Genworth Holdings, loans, dividends or other distributions to Genworth Financial. We do not have any long-term debt maturities until June 2014, when $485 million of Genworth Holdings’ long-term notes mature. Net proceeds of approximately $360 million from the wealth management sale are being held at Genworth Holdings, and together with cash on hand, will be used to repay the 2014 debt at maturity or before. We may from time to time seek to repurchase or redeem outstanding notes (including the notes maturing in June 2014) for cash in open market purchases, tender offers, privately negotiated transactions or otherwise.
Our Board of Directors has suspended the payment of dividends on our common stock indefinitely. The declaration and payment of future dividends to holders of our common stock will be at the discretion of our Board of Directors and will be dependent on many factors including the receipt of dividends from our operating subsidiaries, our financial condition and operating results, the capital requirements of our subsidiaries, legal requirements, regulatory constraints, our credit and financial strength ratings and such other factors as the Board of Directors deems relevant. In addition, our Board of Directors has suspended repurchases of our common stock under our stock repurchase program indefinitely. The resumption of our stock repurchase program will be at the discretion of our Board of Directors.
Genworth Holdings had $1,219 million and $843 million of cash and cash equivalents as of December 31, 2013 and 2012, respectively. Included in the balance as of December 31, 2013 was approximately $360 million from the net proceeds of the wealth management sale, which together with cash on hand, will be used to pay off the 2014 debt at maturity or before. Genworth Holdings also held $150 million in U.S. government securities as of December 31, 2013 and 2012, respectively.
During the years ended December 31, 2013, 2012 and 2011, Genworth Holdings received cash dividends from its subsidiaries of $497 million, $545 million and $478 million, respectively. Genworth Holdings’ international subsidiaries paid dividends of $317 million, $240 million and $414 million during the years ended December 31, 2013, 2012 and 2011, respectively. Genworth Holdings’ domestic subsidiaries paid dividends of $180 million, $305 million and $64 million, respectively, during the years ended December 31, 2013, 2012 and 2011.
On April 1, 2013, immediately prior to the distribution of the U.S. mortgage insurance subsidiaries to Genworth Financial in connection with the holding company reorganization, Genworth Holdings also contributed $100 million in cash to the U.S. mortgage insurance subsidiaries as part of the Capital Plan for those subsidiaries. Genworth Holdings also contributed the shares of its European mortgage insurance subsidiaries with an estimated value of $230 million to the U.S. mortgage insurance subsidiaries to increase the statutory capital in those companies. During the year ended December 31, 2013, Genworth Holdings paid $414 million of dividends to Genworth Financial. During the year ended December 31, 2013, Genworth Financial made cash capital contributions to its subsidiaries of $410 million.
201
Genworth Holdings provided capital support to some of its insurance subsidiaries in the form of guarantees of certain obligations, in some cases subject to annual scheduled adjustments, totaling up to $1,265 million as of December 31, 2013. We believe Genworth Holdings’ insurance subsidiaries have adequate reserves to cover the underlying obligations. This capital support primarily included:
| • | A capital support agreement of up to $400 million with one of Genworth Holdings’ insurance subsidiaries domiciled in Bermuda relating to an intercompany reinsurance agreement; |
| • | A capital support agreement of up to $275 million with one of Genworth Holdings’ insurance subsidiaries domiciled in Bermuda relating to an excess of loss intercompany reinsurance agreement; |
| • | A capital support agreement of up to $260 million with one of Genworth Holdings’ insurance subsidiaries to fund claims to support its international mortgage insurance business in Mexico; |
| • | A capital support agreement of up to $100 million, as part of the Capital Plan for the U.S. mortgage insurance subsidiaries, to be provided to GEMICO in the future in the event that certain adverse events occur; and |
| • | A capital support agreement of up to $150 million, as part of the Capital Plan for the U.S. mortgage insurance subsidiaries, to guarantee the receipt by GEMICO of intercompany payments in the normal course from our subsidiaries by June 30, 2017. As of December 31, 2013, the amount outstanding under this guarantee was $104 million. |
Effective January 1, 2014, the capital support agreement of up to $275 million with one of Genworth Holdings’ insurance subsidiaries domiciled in Bermuda relating to an excess of loss intercompany reinsurance agreement was terminated as a result of the termination of such excess of loss reinsurance agreement.
Genworth Holdings provides a limited guarantee to Rivermont Insurance Company (“Rivermont I”), an indirect subsidiary, which is accounted for as a derivative carried at fair value and is eliminated in consolidation. As of December 31, 2013, the fair value of this derivative was zero. As of December 31, 2012, the fair value of this derivative was $1 million.
Genworth Holdings also provides an unlimited guarantee for the benefit of policyholders for the payment of valid claims by a mortgage insurance affiliate located in the United Kingdom. However, based on risk in-force as of December 31, 2013, we believe our mortgage insurance affiliate located in the United Kingdom has sufficient reserves and capital to cover its policyholder obligations.
Genworth Holdings has a Tax Matters Agreement with GE, our former parent company, which represents an obligation of Genworth Holdings to GE. The balance of this obligation was $245 million as of December 31, 2013.
On April 1, 2013, in connection with the reorganization: (a) Genworth Financial provided a full and unconditional guarantee to the trustee of Genworth Holdings’ outstanding senior notes and the holders of the senior notes, on an unsecured unsubordinated basis, of the full and punctual payment of the principal of, premium, if any and interest on, and all other amounts payable under, each outstanding series of senior notes, and the full and punctual payment of all other amounts payable by Genworth Holdings under the senior notes indenture in respect of such senior notes and (b) Genworth Financial provided a full and unconditional guarantee to the trustee of Genworth Holdings’ outstanding subordinated notes and the holders of the subordinated notes, on an unsecured subordinated basis, of the full and punctual payment of the principal of, premium, if any and interest on, and all other amounts payable under, the outstanding subordinated notes, and the full and punctual payment of all other amounts payable by Genworth Holdings under the subordinated notes indenture in respect of the subordinated notes. In connection with the reorganization on April 1, 2013, Genworth Financial also provided a full and unconditional guarantee of Genworth Holdings’ obligations associated with Rivermont I and the Tax Matters Agreement.
202
The obligations under Genworth Holdings’ credit agreement are unsecured and payment of Genworth Holdings’ obligations is fully and unconditionally guaranteed by Genworth Financial.
We also provided guarantees to third parties for the performance of certain obligations of our subsidiaries. We estimate that our potential obligations under such guarantees were $30 million as of December 31, 2013.
Regulated insurance subsidiaries
Insurance laws and regulations regulate the payment of dividends and other distributions to us by our insurance subsidiaries. In general, dividends in excess of prescribed limits are deemed “extraordinary” and require insurance regulatory approval. Based on estimated statutory results as of December 31, 2013, in accordance with applicable dividend restrictions, our subsidiaries could pay dividends of approximately $1.0 billion to us in 2014 without obtaining regulatory approval. However, we do not expect our insurance subsidiaries to pay dividends to us in 2014 at this level as they retain capital for growth and to meet capital requirements.
Our international insurance subsidiaries paid dividends of $317 million, $240 million and $414 million during the years ended December 31, 2013, 2012 and 2011, respectively. Our domestic insurance subsidiaries paid dividends of $418 million (none of which were deemed “extraordinary”), $374 million ($175 million of which were deemed “extraordinary”) and $12 million (none of which were deemed “extraordinary”), respectively, during the years ended December 31, 2013, 2012 and 2011.
The liquidity requirements of our regulated insurance subsidiaries principally relate to the liabilities associated with their various insurance and investment products, operating costs and expenses, the payment of dividends to us, contributions to their subsidiaries, payment of principal and interest on their outstanding debt obligations and income taxes. Liabilities arising from insurance and investment products include the payment of benefits, as well as cash payments in connection with policy surrenders and withdrawals, policy loans and obligations to redeem funding agreements.
Our insurance subsidiaries have used cash flows from operations and investment activities to fund their liquidity requirements. Our insurance subsidiaries’ principal cash inflows from operating activities are derived from premiums, annuity deposits and insurance and investment product fees and other income, including commissions, cost of insurance, mortality, expense and surrender charges, contract underwriting fees, investment management fees and dividends and distributions from their subsidiaries. The principal cash inflows from investment activities result from repayments of principal, investment income and, as necessary, sales of invested assets.
Our insurance subsidiaries maintain investment strategies intended to provide adequate funds to pay benefits without forced sales of investments. Products having liabilities with longer durations, such as certain life and long-term care insurance policies, are matched with investments having similar estimated lives such as long-term fixed maturity securities and commercial mortgage loans. Shorter-term liabilities are matched with fixed maturity securities that have short- and medium-term fixed maturities. In addition, our insurance subsidiaries hold highly liquid, high quality short-term investment securities and other liquid investment grade fixed maturity securities to fund anticipated operating expenses, surrenders and withdrawals. As of December 31, 2013, our total cash, cash equivalents and invested assets were $72.8 billion. Our investments in privately placed fixed maturity securities, commercial mortgage loans, policy loans, limited partnership investments and select mortgage-backed and asset-backed securities are relatively illiquid. These asset classes represented approximately 31% of the carrying value of our total cash, cash equivalents and invested assets as of December 31, 2013.
As of December 31, 2013, each of our life insurance subsidiaries exceeded the minimum required RBC levels. The consolidated RBC ratio of our U.S. domiciled life insurance subsidiaries was approximately 485% of the company action level as of December 31, 2013.
203
We have taken steps to improve the financial condition of our U.S. mortgage insurance business throughout 2013. In April 2013, we completed our Capital Plan that provided additional capital support and other benefits to our U.S. mortgage insurance business. The Capital Plan included a cash contribution of $100 million, the transfer of ownership of our European mortgage insurance subsidiaries to GEMICO, our primary U.S. mortgage insurance subsidiary, and our holding company reorganization. In addition, in December 2013, Genworth Holdings issued $400 million of senior notes in anticipation of increased capital requirements expected to be imposed by the GSEs in connection with their revised MI Eligibility Standards. As of December 31, 2013, Genworth Financial contributed $100 million of the proceeds to GEMICO with an additional $300 million contributed to a U.S. mortgage holding company. The $100 million contribution in December 2013 to GEMICO, coupled with other performance-related actions, lowered GEMICO’s risk-to-capital ratio to approximately 19.3:1 as of December 31, 2013. We expect the $300 million contributed into our U.S. mortgage holding company will be further contributed to GEMICO, to the extent needed, for the benefit of its capital position after the changes to the asset and capital requirements in the revised GSE MI Eligibility Standards are finalized. In connection with this additional $300 million contribution to GEMICO, we will also evaluate the overall performance of our U.S. mortgage insurance business and conditions existing in the U.S. mortgage insurance industry at the time we decide to make the contribution.
On January 31, 2013, our European mortgage insurance subsidiaries received a $21 million cash capital contribution. We then subsequently contributed the shares of our European mortgage insurance subsidiaries with an estimated value of $230 million to our U.S. mortgage insurance subsidiaries to increase the statutory capital in those companies as part of the Capital Plan for our U.S. mortgage insurance subsidiaries.
During 2013, Genworth Canada repurchased 3.9 million shares for CAD$105 million through a Normal Course Issuer Bid (“NCIB”) authorized by its board for up to 4.9 million shares. We participated in the NCIB in order to maintain our overall ownership percentage at its current level and received $58 million. Purchases of Genworth Canada’s common shares may continue until the earlier of May 2, 2014 and the date on which Genworth Canada has purchased the maximum number of authorized shares under the NCIB.
As of December 31, 2013, one of our wholly-owned life insurance subsidiaries provides security in an aggregate amount of $583 million for the benefit of certain of its wholly-owned life insurance subsidiaries that have issued non-recourse funding obligations to collateralize the obligation to make future payments on their behalf under certain tax sharing agreements.
Capital resources and financing activities
In the second quarter of 2013, we terminated our $1.0 billion commercial paper program. There was no amount outstanding under the commercial paper program when terminated and none outstanding since February 2009.
On September 26, 2013, Genworth Holdings entered into a $300 million multicurrency revolving credit facility, which matures in September 2016, with a $100 million sublimit for letters of credit. The proceeds of the loans may be used for working capital and general corporate purposes. As of December 31, 2013, there were no amounts outstanding under the credit facility. The obligations under the credit agreement are unsecured and payment of Genworth Holdings’ obligations is fully and unconditionally guaranteed by Genworth Financial.
In December 2013, Genworth Holdings issued $400 million aggregate principal amount of senior notes, with an interest rate of 4.80% per year payable semi-annually, and maturing in 2024 (“2024 Notes”). The 2024 Notes are Genworth Holdings’ direct, unsecured obligations and rank equally in right of payment with all of its existing and future unsecured and unsubordinated obligations. The 2024 Notes are fully and unconditionally guaranteed on an unsecured and unsubordinated basis by Genworth Financial. With the net proceeds from the issuance of the 2024 Notes of $397 million and cash on hand, Genworth Financial contributed $100 million of the proceeds to GEMICO with an additional $300 million contributed to a U.S. mortgage holding company to be
204
used to satisfy all or part of the higher capital requirements expected to be imposed by the GSEs as part of the anticipated revisions to the MI Eligibility Standards. We expect the $300 million contributed into our U.S. mortgage holding company will be further contributed to GEMICO, to the extent needed, for the benefit of its capital position after the changes to the asset and capital requirements in the revised GSE MI Eligibility Standards are finalized. In connection with this additional $300 million contribution to GEMICO, we will also evaluate the overall performance of our U.S. mortgage insurance business and conditions existing in the U.S. mortgage insurance industry at the time we decide to make the contribution.
In August 2013, Genworth Holdings issued $400 million aggregate principal amount of senior notes, with an interest rate of 4.90% per year payable semi-annually, and maturing in 2023 (“2023 Notes”). The 2023 Notes are Genworth Holdings’ direct, unsecured obligations and rank equally in right of payment with all of its existing and future unsecured and unsubordinated obligations. The 2023 Notes are fully and unconditionally guaranteed on an unsecured and unsubordinated basis by Genworth Financial. The net proceeds of $396 million from the issuance of the 2023 Notes, together with cash on hand at Genworth Holdings, were used to redeem all $346 million of the remaining outstanding aggregate principal amount of Genworth Holdings’ 2015 Notes, and pay accrued and unpaid interest on such notes and pay a make-whole payment of approximately $30 million pre-tax.
During 2013, Genworth Holdings repurchased $15 million aggregate principal amount of the 5.75% senior notes that mature in 2014, and paid accrued and unpaid interest thereon. In June 2013, Genworth Holdings repurchased $4 million aggregate principal amount of the 2015 Notes, and paid accrued and unpaid interest thereon.
During the fourth quarter of 2012, we completed a tender offer for up to $100 million of our 5.75% senior notes that mature in June 2014. As a result of this tender offer, we repurchased principal of approximately $100 million of these notes, plus accrued interest on the notes repurchased, for a pre-tax loss of $6 million. The tender offer was completed for an aggregate of $109 million (including a premium and accrued interest paid on the notes repurchased).
We repaid $222 million of our 5.65% senior notes that matured in June 2012.
During 2013 and 2012, River Lake Insurance Company, our indirect wholly-owned subsidiary, repaid $28 million and $11 million, respectively, of its total outstanding floating rate subordinated notes due in 2033.
In December 2012, we repurchased $20 million of non-recourse funding obligations issued by River Lake Insurance Company II, our indirect wholly-owned subsidiary, resulting in a U.S. GAAP pre-tax gain of $4 million. We accounted for these transactions as redemptions of our non-recourse funding obligations.
On March 26, 2012, River Lake Insurance Company IV Limited (“River Lake IV”), our indirect wholly-owned subsidiary, repaid $3 million of its total outstanding $8 million Class B Floating Rate Subordinated Notes due May 25, 2028 following an early redemption event, in accordance with the priority of payments. During the three months ended September 30, 2012, as part of a life block transaction, we acquired $270 million of non-recourse funding obligations issued by River Lake IV, which were accounted for as redemptions of our non-recourse funding obligations and resulted in a U.S. GAAP after-tax gain of approximately $21 million. The life block transaction also resulted in higher after-tax DAC amortization of $25 million reflecting loss recognition associated with a third-party reinsurance treaty plus additional expenses. The combined transactions resulted in a U.S. GAAP after-tax loss of $6 million in the three months ended September 30, 2012 which was included in our U.S. Life Insurance segment. In December 2012, we repaid the remaining outstanding non-recourse funding obligations issued by River Lake IV of $235 million.
In January 2012, as part of a life block transaction, we acquired $475 million of our non-recourse funding obligations issued by River Lake Insurance Company III (“River Lake III”), our indirect wholly-owned subsidiary, which were accounted for as redemptions of our non-recourse funding obligations and resulted in a
205
U.S. GAAP after-tax gain of approximately $52 million. In connection with the life block transaction, we ceded certain term life insurance policies to a third-party reinsurer resulting in a U.S. GAAP after-tax loss, net of DAC amortization, of $93 million. The combined transactions resulted in a U.S. GAAP after-tax loss of approximately $41 million in the three months ended March 31, 2012 which was included in our U.S. Life Insurance segment. In February and March 2012, we repaid the remaining outstanding non-recourse funding obligations issued by River Lake III of $176 million.
For further information about our borrowings, refer to note 13 in our consolidated financial statements under “Item 8—Financial Statements and Supplementary Data.”
If regulatory changes (including those under consideration by the GSEs and NAIC) or other business-related considerations indicate a contribution is required and appropriate, we could provide additional capital to GEMICO with an asset contribution or a cash contribution through a variety of means. In addition to the available funds held at the U.S. mortgage holding company, we have various alternatives available to us to manage GEMICO’s future capital position, including organic earnings growth; utilization of a portion of available deferred tax assets; possible reinsurance transactions; use of proceeds from the planned Australian IPO; issuance of convertible or exchangeable securities at the Genworth Financial and/or the Genworth Holdings levels; and other options that may be available.
We believe existing cash held at Genworth Holdings combined with dividends from subsidiaries, payments under tax sharing and expense reimbursement arrangements with subsidiaries and proceeds from borrowings or securities issuances will provide us with sufficient capital flexibility and liquidity to meet our future operating requirements. We actively monitor our liquidity position, liquidity generation options and the credit markets given changing market conditions. We previously managed liquidity at Genworth Holdings to maintain a minimum balance of two times expected annual debt interest payments plus an additional excess of $350 million. With the addition of the revolving credit facility in September 2013, we changed the target from two times expected annual debt interest payments to one and half times expected annual debt interest payments plus the additional excess of $350 million, although the excess amount may be lower during the quarter due to the timing of cash inflows and outflows. We will evaluate the target level of the excess amount as circumstances warrant. We cannot predict with any certainty the impact to us from any future disruptions in the credit markets or further downgrades by one or more of the rating agencies of the financial strength ratings of our insurance company subsidiaries and/or the credit ratings of our holding companies. The availability of additional funding will depend on a variety of factors such as market conditions, regulatory considerations, the general availability of credit, the overall availability of credit to the financial services industry, the level of activity and availability of reinsurance, our credit ratings and credit capacity and the performance of and outlook for our business.
206
Contractual obligations and commercial commitments
We enter into obligations with third parties in the ordinary course of our operations. These obligations, as of December 31, 2013, are set forth in the table below. However, we do not believe that our cash flow requirements can be assessed based upon this analysis of these obligations as the funding of these future cash obligations will be from future cash flows from premiums, deposits, fees and investment income that are not reflected in the following table. Future cash outflows, whether they are contractual obligations or not, also will vary based upon our future needs. Although some outflows are fixed, others depend on future events. Examples of fixed obligations include our obligations to pay principal and interest on fixed rate borrowings. Examples of obligations that will vary include obligations to pay interest on variable rate borrowings and insurance liabilities that depend on future interest rates and market performance. Many of our obligations are linked to cash-generating contracts. These obligations include payments to contractholders that assume those contractholders will continue to make deposits in accordance with the terms of their contracts. In addition, our operations involve significant expenditures that are not based upon “commitments.”
| Payments due by period | ||||||||||||||||||||
| (Amounts in millions) |
Total | 2014 | 2015-2016 | 2017-2018 | 2019 and thereafter |
|||||||||||||||
| Borrowings and interest (1) |
$ | 10,626 | $ | 832 | $ | 1,117 | $ | 1,167 | $ | 7,510 | ||||||||||
| Operating lease obligations |
87 | 21 | 36 | 24 | 6 | |||||||||||||||
| Other purchase liabilities (2) |
73 | 44 | 27 | 2 | — | |||||||||||||||
| Securities lending and repurchase obligations (3) |
1,118 | 1,118 | — | — | — | |||||||||||||||
| Commercial mortgage loan commitments (4) |
29 | 29 | — | — | — | |||||||||||||||
| Limited partnership commitments (4) |
65 | 39 | 17 | 8 | 1 | |||||||||||||||
| Private placement commitments (4) |
109 | 109 | — | — | — | |||||||||||||||
| Insurance liabilities (5) |
88,487 | 3,335 | 4,315 | 4,533 | 76,304 | |||||||||||||||
| Tax matters agreement (6) |
291 | 42 | 85 | 80 | 84 | |||||||||||||||
| Unrecognized tax benefits (7) |
41 | 3 | 6 | 8 | 24 | |||||||||||||||
|
|
|
|
|
|
|
|
|
|
|
|||||||||||
| Total contractual obligations |
$ | 100,926 | $ | 5,572 | $ | 5,603 | $ | 5,822 | $ | 83,929 | ||||||||||
|
|
|
|
|
|
|
|
|
|
|
|||||||||||
| (1) | Includes payments of principal and interest on our long-term borrowings and non-recourse funding obligations, as described in note 13 to our consolidated financial statements under “Item 8—Financial Statements and Supplementary Data.” For our U.S. domiciled insurance companies, any payment of principal, including by redemption, or interest on our non-recourse funding obligations are subject to regulatory approval. The total amount for borrowings and interest in this table does not equal the amounts on our consolidated balance sheet due to interest included in the table that is expected to be payable in future years. In addition, the total amount does not include borrowings related to securitization entities. See note 18 to our consolidated financial statements under “Item 8—Financial Statements and Supplementary Data” for information related to the timing of payments and the maturity dates of these borrowings. |
| (2) | Includes contractual purchase commitments for goods and services entered into in the ordinary course of business and includes obligations under our pension liabilities. |
| (3) | The timing for the return of the collateral associated with our securities lending program is uncertain; therefore, the return of collateral is reflected as being due in 2014. |
| (4) | Includes amounts we are committed to fund for U.S. commercial mortgage loans, interests in limited partnerships and private placement investments. |
| (5) | Includes estimated claim and benefit, policy surrender and commission obligations offset by expected future deposits and premiums on in-force insurance policies and investment contracts. Also includes amounts established for recourse and indemnification related to our U.S. mortgage insurance contract underwriting business. Estimated claim and benefit obligations are based on mortality, morbidity and lapse assumptions comparable with our historical experience. The obligations in this table have not been discounted at present value. In contrast to this table, our obligations reported in our consolidated balance sheet are recorded in accordance with U.S. GAAP where the liabilities are discounted consistent with the present value concept |
207
| under accounting guidance related to accounting and reporting by insurance enterprises, as applicable. Therefore, the estimated obligations for insurance liabilities presented in this table significantly exceed the liabilities recorded in reserves for future policy benefits and the liability for policy and contract claims. Due to the significance of the assumptions used, the amounts presented could materially differ from actual results. We have not included separate account obligations as these obligations are legally insulated from general account obligations and will be fully funded by cash flows from separate account assets. We expect to fully fund the obligations for insurance liabilities from cash flows from general account investments and future deposits and premiums. |
| (6) | Because their future cash outflows are uncertain, the following non-current liabilities are excluded from this table: deferred taxes (except the Tax Matters Agreement, which is included, as described in note 14 to our consolidated financial statements under “Item 8—Financial Statements and Supplementary Data”), derivatives, unearned premiums and certain other items. |
| (7) | Includes the settlement of uncertain tax positions, with related interest, based on the estimated timing of the resolution of income tax examinations in multiple jurisdictions. See notes 2 and 14 to our consolidated financial statements under “Item 8—Financial Statements and Supplementary Data” for a discussion of uncertain tax positions. |
Off-Balance Sheet Transactions
We have used off-balance sheet securitization transactions to mitigate and diversify our asset risk position and to adjust the asset class mix in our investment portfolio by reinvesting securitization proceeds in accordance with our approved investment guidelines. The transactions we have used involved securitizations of some of our receivables and investments that were secured by commercial mortgage loans, fixed maturity securities or other receivables, consisting primarily of policy loans. Total securitized assets remaining as of December 31, 2013 and 2012 were $461 million and $575 million, respectively, including $314 million and $424 million, respectively, of securitized assets required to be consolidated.
Securitization transactions typically result in gains or losses that are included in net investment gains (losses) in our consolidated financial statements. There were no off-balance sheet securitization transactions executed in 2013, 2012 or 2011.
We have arranged for the assets that we have transferred in securitization transactions to be serviced by us directly, or pursuant to arrangements with a third-party service provider. Servicing activities include ongoing review, credit monitoring, reporting and collection activities.
Financial support for certain securitization entities was provided under credit support agreements that remain in place throughout the life of the related entities. Assets with credit support were funded by demand notes that were further enhanced with support provided by a third party. We previously provided limited recourse for a maximum of $40 million of credit losses related to one of our commercial mortgage loan entities that was required to be consolidated. As a result of a clean up call being exercised on this securitization entity during the fourth quarter of 2013, we effectively no longer have any limited recourse outstanding as of December 31, 2013.
See note 18 to our consolidated financial statements under “Item 8—Financial Statements and Supplementary Data” for additional information related to securitization entities.
Seasonality
In general, our business as a whole is not seasonal in nature. However, in our U.S. mortgage insurance business, the level of delinquencies, which increases the likelihood of losses, generally tends to decrease in mid-first quarter and continue through second quarter while increasing in the third and fourth quarters of the calendar year. Therefore, we typically experience lower levels of losses resulting from delinquencies in the first and second quarters, as compared with those in the third and fourth quarters. However, as a result of the downturn in
208
the U.S. housing market that began in 2008, delinquencies have remained elevated in the first and second quarters in recent years. Currently, as the U.S. housing market is beginning to show signs of stabilization and early recovery, delinquencies have been trending downward and beginning to return to more normal seasonal trends. While the U.S. economy continues recovering, we may see higher than usual delinquencies until the housing market returns to a more normal development pattern long-term. There is also modest delinquency seasonality in our international mortgage insurance business in Australia and Canada. In Australia, we generally experience higher new delinquencies and lower cure rates in the first and second quarters of each calendar year. In Canada, we generally experience modestly higher delinquencies in the winter months.
See “—Business trends and conditions” for additional information related to our businesses.
Inflation
We do not believe that inflation has had a material effect on our results of operations, except insofar as inflation may affect interest rates.
New Accounting Standards
For a discussion of recently adopted and not yet adopted accounting standards, see note 2 in our consolidated financial statements under “Item 8—Financial Statements and Supplementary Data.”
209
| Item 7A. | Quantitative and Qualitative Disclosures About Market Risk |
Market risk is the risk of the loss of fair value resulting from adverse changes in market rates and prices, such as interest rates, foreign currency exchange rates and equity prices. Market risk is directly influenced by the volatility and liquidity in the markets in which the related underlying financial instruments are traded. The following is a discussion of our market risk exposures and our risk management practices.
Credit markets generally showed signs of improvement across most asset classes during 2013. While credit markets improved during the first quarter of 2013, market volatility increased during the remainder of 2013, ending 2013 with credit spreads moderately tighter in most asset classes. Additionally, U.S. Treasury yields remained at historically low levels during 2013. See “—Business trends and conditions” and “—Investments and Derivative Instruments” in “Item 7—Management’s Discussion and Analysis of Financial Condition and Results of Operations” for further discussion of recent market conditions.
In 2013 compared to 2012, the U.S. dollar strengthened against currencies in Australia and Canada; however, it weakened against currencies in the United Kingdom, as well as the Euro. This has generally resulted in lower levels of reported revenues and net income (loss), assets, liabilities and accumulated other comprehensive income (loss) in our U.S. dollar consolidated financial statements. See “Item 7—Management’s Discussion and Analysis of Financial Condition and Results of Operations” for further discussion on the impact changes in foreign currency exchange rates have had during the year.
While we enter into derivatives to mitigate certain market risks, our agreements with derivative counterparties typically require that we provide collateral when our net derivative liability position with a particular counterparty reaches a certain level. As a result, we may be required to post collateral due to fluctuations in the fair value of our derivatives and may result in us holding more high quality securities to ensure we have sufficient collateral to post derivative counterparties in the event of adverse changes in fair value of our derivative instruments. In the event we do not have sufficient high quality securities to provide as collateral, we may need to sell certain other securities to purchase assets that would be eligible for collateral posting, which could adversely impact our future investment income.
Interest Rate Risk
We enter into market-sensitive instruments primarily for purposes other than trading. Our life insurance, long-term care insurance and deferred annuity products have significant interest rate risk and are associated with our U.S. life insurance subsidiaries. Our international mortgage insurance business and immediate annuity products have moderate interest rate risk, while our lifestyle protection and U.S. mortgage insurance businesses have relatively low interest rate risk.
Our insurance and investment products are sensitive to interest rate fluctuations and expose us to the risk that falling interest rates or credit spreads will reduce our margin or the difference between the returns we earn on the investments that support our obligations under these products and the amounts that we must pay to policyholders and contractholders. Because we may reduce the interest rates we credit on most of these products only at limited, pre-established intervals, and because some contracts have guaranteed minimum interest crediting rates, declines in interest rates can impact the profitability of these products. As of December 31, 2013, of our $11.8 billion deferred annuity products, $1.0 billion have guaranteed minimum interest crediting rate floors greater than or equal to 3.5%, with no guaranteed minimum interest crediting rate floors greater than 5.5%. Most of these products were sold prior to 1999. Our universal life insurance products also have guaranteed minimum interest crediting rate floors, with no guaranteed minimum interest crediting rate floors greater than 6.0%. Of our $6.6 billion of universal life insurance products as of December 31, 2013, $3.5 billion have guaranteed minimum interest crediting rate floors ranging between 3% and 4%.
210
During periods of increasing market interest rates, we may offer higher crediting rates on interest-sensitive products, such as universal life insurance and fixed annuities, and we may increase crediting rates on in-force products to keep these products competitive. In addition, rapidly rising interest rates may cause increased policy surrenders, withdrawals from life insurance policies and annuity contracts and requests for policy loans, as policyholders and contractholders shift assets into higher yielding investments. Increases in crediting rates, as well as surrenders and withdrawals, could have an adverse effect on our financial condition and results of operations, including the requirement to liquidate fixed-income investments in an unrealized loss position to satisfy surrenders or withdrawals.
Our life and long-term care insurance products as well as our guaranteed benefits on variable annuities also expose us to the risk of interest rate fluctuations. The pricing and expected future profitability of these products are based in part on expected investment returns. Over time, life and long-term care insurance products generally produce positive cash flows as customers pay periodic premiums, which we invest as they are received. Low interest rates increase reinvestment risk and reduce our ability to achieve our targeted investment margins and may adversely affect the profitability of our life and long-term care insurance products and may increase hedging costs on our in-force block of variable annuity products. A prolonged low interest rate environment may negatively impact the sufficiency of our margins on our DAC and PVFP, which could result in an impairment. In addition, certain statutory capital requirements are based on models that consider interest rates. Prolonged periods of low interest rates may increase the statutory capital we are required to hold as well as the amount of assets we must maintain to support statutory reserves.
The significant interest rate risk that is present in our life insurance, long-term care insurance and deferred annuity products is a result of longer duration liabilities where a significant portion of cash flows to pay benefits comes from investment returns. Additionally, certain of these products have implicit and explicit rate guarantees or optionality that is significantly impacted by changes in interest rates. We seek to minimize interest rate risk by purchasing assets to better align the duration of our assets with the duration of the liabilities or utilizing derivatives to mitigate interest rate risk for product lines where asset durations are not sufficient to align with the related liability. Additionally, we also minimize certain of these risks through product design features.
The carrying value of our investment portfolio as of December 31, 2013 and 2012 was $68.6 billion and $74.4 billion, respectively, of which 85% and 84%, respectively, was invested in fixed maturity securities. The primary market risk to our investment portfolio is interest rate risk associated with investments in fixed maturity securities. We mitigate the market risk associated with our fixed maturity securities portfolio by matching the duration of our fixed maturity securities with the duration of the liabilities that those securities are intended to support.
Interest rate fluctuations also could have an adverse effect on the results of our investment portfolio. During periods of declining market interest rates, the interest we receive on variable interest rate investments decreases. In addition, during those periods, we are forced to reinvest the cash we receive as interest or return of principal on our investments in lower-yielding high-grade instruments or in lower-credit instruments to maintain comparable returns. Issuers of fixed-income securities may also decide to prepay their obligations in order to borrow at lower market rates, which exacerbates the risk that we may have to invest the cash proceeds of these securities in lower-yielding or lower-credit instruments. During periods of increasing interest rates, market values of lower-yielding assets will decline. In addition, our interest rate hedges will decline which will require us to post additional collateral with our derivative counterparties.
The primary market risk for our long-term borrowings is interest rate risk at the time of maturity or early redemption, when we may be required to refinance these obligations. We continue to monitor the interest rate environment and to evaluate refinancing opportunities as maturity dates approach. While we are exposed to interest rate risk from certain variable rate long-term borrowings and non-recourse funding obligations, in certain instances we invest in variable rate assets to back those obligations to mitigate the interest rate risk from the variable interest payments.
211
We use derivative instruments, such as interest rate swaps, financial futures and option-based financial instruments, as part of our risk management strategy. We use these derivatives to mitigate certain interest rate risk by:
| • | reducing the risk between the timing of the receipt of cash and its investment in the market; |
| • | extending or shortening the duration of assets to better align with the duration of the liabilities; and |
| • | protecting against the early termination of an asset or liability. |
As a matter of policy, we have not and will not engage in derivative market-making, speculative derivative trading or other speculative derivatives activities.
Assuming investment yields remain at the 2013 year end levels and based on our existing policies and investment portfolio as of December 31, 2013, the impact from investing in that lower interest rate environment could reduce our margin of investment income above our interest credited or interest accretion related to our liabilities (“investment margins”) by approximately $25 million, $45 million and $85 million in 2014, 2015 and 2016, respectively, compared to our 2013 investment margins before considering the impact from taxes, noncontrolling interests or DAC and other adjustments. The impact includes additional expected benefits from qualifying interest rate hedges for our U.S. Life Insurance segment. In determining the potential impact, we have included potential changes in crediting rates to policyholders, limited by any restrictions on our ability to adjust policyholder rates due to guaranteed crediting rates or floors. The above impacts do not contemplate any evaluation of reserve adequacy or unlocking of DAC and primarily relate to our U.S. Life Insurance and International Mortgage Insurance segments. Our U.S. Life Insurance segment represents approximately 60%, 35% and 45% of this impact in 2014, 2015 and 2016, respectively. The impact on our International Mortgage Insurance segment results from the shorter duration of its investment portfolio.
Equity Market Risk
Our exposure to equity market risk within our insurance companies primarily relates to variable annuities and certain equity linked products. Certain variable annuity products have living benefit guarantees that expose us to equity market risk if the performance of the underlying mutual funds in the separate account products experience downturns and volatility for an extended period of time potentially resulting in more payments from general account assets than from contractholder separate account investments. Additionally, continued equity market volatility could result in additional losses in our variable annuity products and associated hedging program which will further challenge our ability to recover DAC on these products and could lead to write-offs of DAC, as well as increased hedging costs. Downturns in equity markets could also lead to an increase in liabilities associated with secondary guarantee features, such as guaranteed minimum benefits on separate account products, where we have equity market risk exposure.
We are exposed to equity risk on our holdings of common stocks and other equities, as well as risk on products where we have equity market risk exposure. We manage equity price risk through industry and issuer diversification, asset allocation techniques and hedging strategies.
We use derivative instruments, such as financial futures and option-based financial instruments, as part of our risk management strategy. We use these derivatives to mitigate equity risk by reducing our exposure to fluctuations in equity market indices that underlie some of our products.
Foreign Currency Risk
We also have exposure to foreign currency exchange risk. Our international operations generate revenues denominated in local currencies, and we invest cash generated outside the United States in non-U.S.-denominated
212
securities. As of December 31, 2013 and 2012, approximately 20% and 21%, respectively, of our invested assets were held by our international operations and we invest cash generated in those operations in securities denominated in the same local currencies. Although investing in securities denominated in local currencies limits the effect of currency exchange rate fluctuation on local operating results, we remain exposed to the impact of fluctuations in exchange rates as we translate the operating results of our foreign operations in our consolidated financial statements. We currently do not hedge the translation of operating results for our international operations. For the years ended December 31, 2013, 2012 and 2011, 70%, 106% and 207%, respectively, of our income from continuing operations, excluding net investment gains (losses), was generated by our international operations. Our investments in non-U.S.-denominated securities are subject to fluctuations in non-U.S. securities and currency markets, and those markets can be volatile. Non-U.S. currency fluctuations also affect the value of any dividends paid by our non-U.S. subsidiaries to their parent companies in the United States.
We use derivative instruments, such as foreign currency swaps, financial futures and option-based financial instruments, as part of our risk management strategy. We use these derivatives to mitigate certain foreign currency risks by:
| • | matching the currency of invested assets with the liabilities they support; |
| • | converting certain non-functional currency investments into functional currency; and |
| • | hedging certain near-term foreign currency dividends or cash flows expected from international subsidiaries. |
Sensitivity Analysis
Sensitivity analysis measures the impact of hypothetical changes in interest rates, foreign exchange rates and other market rates or prices on the profitability of market-sensitive financial instruments.
The following discussion about the potential effects of changes in interest rates, foreign currency exchange rates and equity market prices is based on so-called “shock-tests,” which model the effects of interest rate, foreign currency exchange rate and equity market price shifts on our financial condition and results of operations. Although we believe shock-tests provide the most meaningful analysis permitted by the rules and regulations of the SEC, they are constrained by several factors, including the necessity to conduct the analysis based on a single point in time and by their inability to include the extraordinarily complex market reactions that normally would arise from the market shifts modeled. Although the following results of shock-tests for changes in interest rates, foreign currency exchange rates and equity market prices may have some limited use as benchmarks, they should not be viewed as forecasts. These forward-looking disclosures also are selective in nature and address only the potential impacts on our financial instruments. For the purpose of this sensitivity analysis, we excluded the potential impacts on our insurance liabilities that are not considered financial instruments, with the exception of those insurance liabilities that have embedded derivatives that are required to be bifurcated in accordance with U.S. GAAP. In addition, this sensitivity analysis does not include a variety of other potential factors that could affect our business as a result of these changes in interest rates, foreign currency exchange rates and equity market prices.
Interest Rate Risk
One means of assessing exposure to interest rate changes is a duration-based analysis that measures the potential changes in fair value resulting from a hypothetical change in interest rates of 100 basis points across all maturities. This is referred to as a parallel shift in the yield curve. Note that all impacts noted below exclude any effects of deferred taxes, DAC and PVFP unless otherwise noted.
Under this model, with all other factors constant and assuming no offsetting change in the value of our liabilities, we estimated that such an increase in interest rates would cause the fair value of our fixed-income securities portfolio to decrease by approximately $3.9 billion based on our securities positions as of December 31, 2013, as compared to an estimated decrease of $4.4 billion under this model as of December 31, 2012. The decrease in the impact of the parallel shift in the yield curve in 2013 was due to the decrease in the fair
213
value of our investment portfolio as well as the decrease in duration of fixed maturity securities to better align with the liabilities being backed by these investments. Additionally, the results of this parallel shift in the yield curve would cause the fair value of our commercial mortgage loans to decrease by approximately $272 million based on our commercial mortgage loans as of December 31, 2013, as compared to an estimated decrease of $270 million as of December 31, 2012.
We performed a similar sensitivity analysis on our derivatives portfolio and noted that a 100 basis point increase in interest rates resulted in a decrease in fair value of $647 million based on our derivatives portfolio as of December 31, 2013, as compared to an estimated decline of $825 million under this model as of December 31, 2012. The estimated decrease in fair value of our derivatives portfolio would also require us to post collateral to certain derivative counterparties of approximately $409 million and would require us to post cash margin related to our futures contracts of $75 million based on our derivatives portfolio as of December 31, 2013. Of the $647 million estimated decrease in fair value on our derivatives portfolio as of December 31, 2013, $75 million related to non-qualified derivatives used to mitigate interest rate risk associated with our GMWB embedded derivative liabilities as of December 31, 2013. We also performed a similar sensitivity analysis on our embedded derivatives associated with our GMWB liabilities and noted that a 100 basis point increase in interest rates resulted in a decrease of $75 million based on our GMWB embedded derivative liabilities as of December 31, 2013, as compared to an estimated decline of $114 million under this model as of December 31, 2012.
The impact on our insurance liabilities is not included in the sensitivities above.
The principal amount, weighted-average interest rate and fair value by maturity of our variable rate debt were as follows as of December 31, 2013:
| (Amounts in millions) |
Principal amount |
Weighted-average interest rate |
Fair value (2) |
|||||||||
| Maturity: (1) |
||||||||||||
| Non-recourse funding obligations: |
||||||||||||
| River Lake Insurance Company, 2033 |
$ | 1,031 | 1.39 | % | $ | 765 | ||||||
| River Lake Insurance Company II, 2035 |
692 | 0.93 | % | 523 | ||||||||
| Rivermont Insurance Company I, 2050 |
315 | 2.17 | % | 171 | ||||||||
|
|
|
|
|
|||||||||
| Total non-recourse funding obligations |
2,038 | 1.50 | % | 1,459 | ||||||||
| Floating rate junior notes, 2021 (3) |
125 | 7.65 | % | 129 | ||||||||
|
|
|
|
|
|||||||||
| Total floating rate debt |
$ | 2,163 | $ | 1,588 | ||||||||
|
|
|
|
|
|||||||||
| (1) | There are no maturities over the next five years. |
| (2) | The valuation methodology used is based on the then-current coupon, revalued based on the London Interbank Offered Rate rate set and current spread assumption based on commercially available data. The model is a floating rate coupon model using the spread assumption to derive the valuation. |
| (3) | Subordinated floating rate notes issued in June 2011 by our indirect wholly-owned subsidiary, Genworth Financial Mortgage Insurance Pty Limited, with an interest rate of three-month Bank Bill Swap reference rate plus a margin of 4.75%. |
As of December 31, 2012, the weighted-average interest rate on our non-recourse funding obligations was 1.54% based on $2,066 million of principal. The weighted-average interest rate on subordinated floating rate notes issued by Genworth Financial Mortgage Insurance Pty Limited was 8.67% based on $145 million of principal as of December 31, 2012.
Equity Market Risk
One means of assessing exposure to changes in equity market prices is to estimate the potential changes in market values on our equity investments resulting from a hypothetical broad-based decline in equity market prices of 10%. Under this model, with all other factors constant, we estimated that such a decline in equity
214
market prices would cause the market value of our equity investments to decline by approximately $26 million based on our equity positions as of December 31, 2013, as compared to an estimated decline of $43 million under this model for the year ended December 31, 2012.
We performed a similar sensitivity analysis on our equity market derivatives and noted that a 10% decline in equity market prices would result in an increase in fair value of $65 million based on our equity market derivatives as of December 31, 2013, as compared to an estimated increase of $74 million under this model as of December 31, 2012. The estimated increase in fair value primarily relates to non-qualified derivatives used to mitigate equity market risk associated with our GMWB embedded derivative liabilities. We also performed a similar sensitivity analysis on our embedded derivatives associated with our GMWB liabilities and noted that a 10% decline in equity market prices would result in an estimated increase in fair value of $52 million based on our GMWB embedded derivative liabilities as of December 31, 2013, as compared to an estimated increase of $77 million under this model as of December 31, 2012.
Foreign Currency Risk
One means of assessing exposure to changes in foreign currency exchange rates is to model effects on reported income using a sensitivity analysis. We analyzed our combined currency exposure for the year ended December 31, 2013, including the results of our international operations financial instruments designated and effective as hedges to identify assets and liabilities denominated in currencies other than their relevant functional currencies. Net unhedged exposures in each currency were then remeasured, generally assuming a 10% decrease in foreign currency exchange rates compared to the U.S. dollar. Under this model, with all other factors constant, we estimated that such a decrease would decrease our pre-tax results by approximately $69 million for the year ended December 31, 2013, consistent with the estimated decrease under this model for the year ended December 31, 2012.
We also performed a similar sensitivity analysis on our foreign currency derivative portfolio and noted that a 10% decrease in currency exchange rates resulted in a decrease in fair value of $31 million as of December 31, 2013, as compared to an estimated decrease of $27 million under this model for the year ended December 31, 2012. The change in fair value of derivatives may not result in a direct impact to our income as a result of certain derivatives that may be designated as qualifying hedge relationships.
Derivative Counterparty Credit Risk
For all derivative instruments except for derivatives associated with our consolidated securitization entities, a counterparty (or its guarantor, as applicable) may not have a long-term unsecured debt rating below “A-/A3” as rated by S&P and Moody’s, respectively, at the date of execution of the derivative instrument. The same requirement applies where a Credit Support Annex (“CSA”) to an International Swaps and Derivatives Association, Inc. (“ISDA”) Master Agreement has been obtained such that the counterparty is obligated to provide collateral. In the case of a split or single rating, the lowest or the single rating will apply.
In the case of foreign exchange transactions with a tenor of exposure of less than one year, a counterparty must have short-term credit rating of “A-1/P-1” or its equivalent. In the case of a split or single rating, the lowest or the single rating will apply.
All counterparty exposure is measured on a net mark-to-market basis where the valuation of a derivative is adjusted to reflect current market values. This is achieved by estimating the net present value of derivatives positions contracted and outstanding with each counterparty and calculating the gross loss (excluding recoveries) that would be sustained in the event of a counterparty bankruptcy (taking into account netting and pledged collateral under the applicable ISDA Master Agreement and CSA). Investment exposure limits to counterparties take into account all exposures (through derivatives, bond investments, repurchase transactions or otherwise).
We also engage in derivatives transactions traded on regulated exchanges or clearinghouses where the exchanges or clearinghouse ensure the performance of the contracts.
215
| Item 8. | Financial Statements and Supplementary Data |
Genworth Financial, Inc.
Index to Consolidated Financial Statements
| Page | ||||
| Annual Financial Statements: |
||||
| Report of KPMG LLP, Independent Registered Public Accounting Firm |
217 | |||
| Financial Statements as of December 31, 2013 and 2012 and for the years ended December 31, 2013, 2012 and 2011: |
||||
| 218 | ||||
| 219 | ||||
| 220 | ||||
| 221 | ||||
| 223 | ||||
| 224 | ||||
| 226 | ||||
| 242 | ||||
| 243 | ||||
| 259 | ||||
| 269 | ||||
| 269 | ||||
| 271 | ||||
| 272 | ||||
| 275 | ||||
| 278 | ||||
| 281 | ||||
| 282 | ||||
| 290 | ||||
| 293 | ||||
| 293 | ||||
| 296 | ||||
| 316 | ||||
| Note 19—Insurance Subsidiary Financial Information and Regulatory Matters |
319 | |||
| 324 | ||||
| 332 | ||||
| 333 | ||||
| Note 23—Changes In Accumulated Other Comprehensive Income (Loss) |
336 | |||
| 338 | ||||
| 339 | ||||
| 340 | ||||
| Report of KPMG LLP, Independent Registered Public Accounting Firm, on Financial Statement Schedules |
353 | |||
| Financial Statement Schedules as of December 31, 2013 and 2012 and for the years ended December 31, 2013, 2012 and 2011: |
||||
| Schedule I, Summary of Investments—Other Than Investments in Related Parties |
354 | |||
| Schedule II, Financial Statements of Genworth Financial, Inc. (Parent Only) |
355 | |||
| 361 | ||||
216
Report of Independent Registered Public Accounting Firm
The Board of Directors and Stockholders
Genworth Financial, Inc.:
We have audited the accompanying consolidated balance sheets of Genworth Financial, Inc. (the Company) as of December 31, 2013 and 2012, and the related consolidated statements of income, comprehensive income, changes in stockholders’ equity, and cash flows for each of the years in the three-year period ended December 31, 2013. These consolidated financial statements are the responsibility of the Company’s management. Our responsibility is to express an opinion on these consolidated financial statements based on our audits.
We conducted our audits in accordance with the standards of the Public Company Accounting Oversight Board (United States). Those standards require that we plan and perform the audit to obtain reasonable assurance about whether the financial statements are free of material misstatement. An audit includes examining, on a test basis, evidence supporting the amounts and disclosures in the financial statements. An audit also includes assessing the accounting principles used and significant estimates made by management, as well as evaluating the overall financial statement presentation. We believe that our audits provide a reasonable basis for our opinion.
In our opinion, the consolidated financial statements referred to above present fairly, in all material respects, the financial position of Genworth Financial, Inc. as of December 31, 2013 and 2012, and the results of its operations and its cash flows for each of the years in the three-year period ended December 31, 2013, in conformity with U.S. generally accepted accounting principles.
We also have audited, in accordance with the standards of the Public Company Accounting Oversight Board (United States), Genworth Financial, Inc.’s internal control over financial reporting as of December 31, 2013, based on criteria established in Internal Control—Integrated Framework (1992) issued by the Committee of Sponsoring Organizations of the Treadway Commission (COSO), and our report dated March 3, 2014, expressed an unqualified opinion on the effectiveness of the Company’s internal control over financial reporting.
/s/ KPMG LLP
Richmond, Virginia
March 3, 2014
217
CONSOLIDATED BALANCE SHEETS
(Amounts in millions, except per share amounts)
| December 31, | ||||||||
| 2013 | 2012 | |||||||
| Assets |
||||||||
| Investments: |
||||||||
| Fixed maturity securities available-for-sale, at fair value |
$ | 58,629 | $ | 62,161 | ||||
| Equity securities available-for-sale, at fair value |
341 | 518 | ||||||
| Commercial mortgage loans |
5,899 | 5,872 | ||||||
| Restricted commercial mortgage loans related to securitization entities |
233 | 341 | ||||||
| Policy loans |
1,434 | 1,601 | ||||||
| Other invested assets |
1,686 | 3,493 | ||||||
| Restricted other invested assets related to securitization entities, at fair value |
391 | 393 | ||||||
|
|
|
|
|
|||||
| Total investments |
68,613 | 74,379 | ||||||
| Cash and cash equivalents |
4,214 | 3,632 | ||||||
| Accrued investment income |
678 | 715 | ||||||
| Deferred acquisition costs |
5,278 | 5,036 | ||||||
| Intangible assets |
399 | 366 | ||||||
| Goodwill |
867 | 868 | ||||||
| Reinsurance recoverable |
17,219 | 17,230 | ||||||
| Other assets |
639 | 710 | ||||||
| Separate account assets |
10,138 | 9,937 | ||||||
| Assets associated with discontinued operations |
— | 439 | ||||||
|
|
|
|
|
|||||
| Total assets |
$ | 108,045 | $ | 113,312 | ||||
|
|
|
|
|
|||||
| Liabilities and stockholders’ equity |
||||||||
| Liabilities: |
||||||||
| Future policy benefits |
$ | 33,705 | $ | 33,505 | ||||
| Policyholder account balances |
25,528 | 26,262 | ||||||
| Liability for policy and contract claims |
7,204 | 7,509 | ||||||
| Unearned premiums |
4,107 | 4,333 | ||||||
| Other liabilities ($50 and $133 other liabilities related to securitization entities) |
4,096 | 5,239 | ||||||
| Borrowings related to securitization entities ($75 and $62 carried at fair value) |
242 | 336 | ||||||
| Non-recourse funding obligations |
2,038 | 2,066 | ||||||
| Long-term borrowings |
5,161 | 4,776 | ||||||
| Deferred tax liability |
206 | 1,507 | ||||||
| Separate account liabilities |
10,138 | 9,937 | ||||||
| Liabilities associated with discontinued operations |
— | 61 | ||||||
|
|
|
|
|
|||||
| Total liabilities |
92,425 | 95,531 | ||||||
|
|
|
|
|
|||||
| Commitments and contingencies |
||||||||
| Stockholders’ equity: |
||||||||
| Class A common stock, $0.001 par value; 1.5 billion shares authorized; 583 million and 580 million shares issued as of December 31, 2013 and 2012, respectively; 495 million and 492 million shares outstanding as of December 31, 2013 and 2012, respectively |
1 | 1 | ||||||
| Additional paid-in capital |
12,127 | 12,127 | ||||||
|
|
|
|
|
|||||
| Accumulated other comprehensive income (loss): |
||||||||
| Net unrealized investment gains (losses): |
||||||||
| Net unrealized gains (losses) on securities not other-than-temporarily impaired |
914 | 2,692 | ||||||
| Net unrealized gains (losses) on other-than-temporarily impaired securities |
12 | (54 | ) | |||||
|
|
|
|
|
|||||
| Net unrealized investment gains (losses) |
926 | 2,638 | ||||||
|
|
|
|
|
|||||
| Derivatives qualifying as hedges |
1,319 | 1,909 | ||||||
| Foreign currency translation and other adjustments |
297 | 655 | ||||||
|
|
|
|
|
|||||
| Total accumulated other comprehensive income (loss) |
2,542 | 5,202 | ||||||
| Retained earnings |
2,423 | 1,863 | ||||||
| Treasury stock, at cost (88 million shares as of December 31, 2013 and 2012) |
(2,700 | ) | (2,700 | ) | ||||
|
|
|
|
|
|||||
| Total Genworth Financial, Inc.’s stockholders’ equity |
14,393 | 16,493 | ||||||
| Noncontrolling interests |
1,227 | 1,288 | ||||||
|
|
|
|
|
|||||
| Total stockholders’ equity |
15,620 | 17,781 | ||||||
|
|
|
|
|
|||||
| Total liabilities and stockholders’ equity |
$ | 108,045 | $ | 113,312 | ||||
|
|
|
|
|
|||||
See Notes to Consolidated Financial Statements
218
CONSOLIDATED STATEMENTS OF INCOME
(Amounts in millions, except per share amounts)
| Years ended December 31, | ||||||||||||
| 2013 | 2012 | 2011 | ||||||||||
| Revenues: |
||||||||||||
| Premiums |
$ | 5,148 | $ | 5,041 | $ | 5,688 | ||||||
| Net investment income |
3,271 | 3,343 | 3,380 | |||||||||
| Net investment gains (losses) |
(37 | ) | 27 | (195 | ) | |||||||
| Insurance and investment product fees and other |
1,021 | 1,229 | 1,050 | |||||||||
|
|
|
|
|
|
|
|||||||
| Total revenues |
9,403 | 9,640 | 9,923 | |||||||||
|
|
|
|
|
|
|
|||||||
| Benefits and expenses: |
||||||||||||
| Benefits and other changes in policy reserves |
4,895 | 5,378 | 5,941 | |||||||||
| Interest credited |
738 | 775 | 794 | |||||||||
| Acquisition and operating expenses, net of deferrals |
1,659 | 1,594 | 1,930 | |||||||||
| Amortization of deferred acquisition costs and intangibles |
569 | 722 | 593 | |||||||||
| Goodwill impairment |
— | 89 | 29 | |||||||||
| Interest expense |
492 | 476 | 506 | |||||||||
|
|
|
|
|
|
|
|||||||
| Total benefits and expenses |
8,353 | 9,034 | 9,793 | |||||||||
|
|
|
|
|
|
|
|||||||
| Income from continuing operations before income taxes |
1,050 | 606 | 130 | |||||||||
| Provision (benefit) for income taxes |
324 | 138 | (11 | ) | ||||||||
|
|
|
|
|
|
|
|||||||
| Income from continuing operations |
726 | 468 | 141 | |||||||||
| Income (loss) from discontinued operations, net of taxes |
(12 | ) | 57 | 36 | ||||||||
|
|
|
|
|
|
|
|||||||
| Net income |
714 | 525 | 177 | |||||||||
| Less: net income attributable to noncontrolling interests |
154 | 200 | 139 | |||||||||
|
|
|
|
|
|
|
|||||||
| Net income available to Genworth Financial, Inc.’s common stockholders |
$ | 560 | $ | 325 | $ | 38 | ||||||
|
|
|
|
|
|
|
|||||||
| Income from continuing operations available to Genworth Financial, Inc.’s common stockholders per common share: |
||||||||||||
| Basic |
$ | 1.16 | $ | 0.55 | $ | — | ||||||
|
|
|
|
|
|
|
|||||||
| Diluted |
$ | 1.15 | $ | 0.54 | $ | — | ||||||
|
|
|
|
|
|
|
|||||||
| Net income available to Genworth Financial, Inc.’s common stockholders per common share: |
||||||||||||
| Basic |
$ | 1.13 | $ | 0.66 | $ | 0.08 | ||||||
|
|
|
|
|
|
|
|||||||
| Diluted |
$ | 1.12 | $ | 0.66 | $ | 0.08 | ||||||
|
|
|
|
|
|
|
|||||||
| Weighted-average common shares outstanding: |
||||||||||||
| Basic |
493.6 | 491.6 | 490.6 | |||||||||
|
|
|
|
|
|
|
|||||||
| Diluted |
498.7 | 494.4 | 493.5 | |||||||||
|
|
|
|
|
|
|
|||||||
| Supplemental disclosures: |
||||||||||||
| Total other-than-temporary impairments |
$ | (16 | ) | $ | (62 | ) | $ | (118 | ) | |||
| Portion of other-than-temporary impairments included in other comprehensive income (loss) |
(9 | ) | (44 | ) | (14 | ) | ||||||
|
|
|
|
|
|
|
|||||||
| Net other-than-temporary impairments |
(25 | ) | (106 | ) | (132 | ) | ||||||
| Other investment gains (losses) |
(12 | ) | 133 | (63 | ) | |||||||
|
|
|
|
|
|
|
|||||||
| Total net investment gains (losses) |
$ | (37 | ) | $ | 27 | $ | (195 | ) | ||||
|
|
|
|
|
|
|
|||||||
See Notes to Consolidated Financial Statements
219
CONSOLIDATED STATEMENTS OF COMPREHENSIVE INCOME
(Amounts in millions)
| Years ended December 31, | ||||||||||||
| 2013 | 2012 | 2011 | ||||||||||
| Net income |
$ | 714 | $ | 525 | $ | 177 | ||||||
| Other comprehensive income (loss), net of taxes: |
||||||||||||
| Net unrealized gains (losses) on securities not other-than-temporarily impaired |
(1,817 | ) | 1,078 | 1,615 | ||||||||
| Net unrealized gains (losses) on other-than-temporarily impaired securities |
66 | 78 | (11 | ) | ||||||||
| Derivatives qualifying as hedges |
(590 | ) | (100 | ) | 1,085 | |||||||
| Foreign currency translation and other adjustments |
(442 | ) | 126 | (135 | ) | |||||||
|
|
|
|
|
|
|
|||||||
| Total other comprehensive income (loss) |
(2,783 | ) | 1,182 | 2,554 | ||||||||
|
|
|
|
|
|
|
|||||||
| Total comprehensive income (loss) |
(2,069 | ) | 1,707 | 2,731 | ||||||||
| Less: comprehensive income attributable to noncontrolling interests |
31 | 227 | 152 | |||||||||
|
|
|
|
|
|
|
|||||||
| Total comprehensive income (loss) available to Genworth Financial, Inc.’s common stockholders |
$ | (2,100 | ) | $ | 1,480 | $ | 2,579 | |||||
|
|
|
|
|
|
|
|||||||
See Notes to Consolidated Financial Statements
220
CONSOLIDATED STATEMENTS OF CHANGES IN STOCKHOLDERS’ EQUITY
(Amounts in millions)
| Common stock |
Additional paid-in capital |
Accumulated other comprehensive income (loss) |
Retained earnings |
Treasury stock, at cost |
Total Genworth Financial, Inc.’s stockholders’ equity |
Noncontrolling interests |
Total stockholders’ equity |
|||||||||||||||||||||||||
| Balances as of December 31, 2012 |
$ | 1 | $ | 12,127 | $ | 5,202 | $ | 1,863 | $ | (2,700 | ) | $ | 16,493 | $ | 1,288 | $ | 17,781 | |||||||||||||||
|
|
|
|||||||||||||||||||||||||||||||
| Repurchase of subsidiary shares |
— | — | — | — | — | — | (43 | ) | (43 | ) | ||||||||||||||||||||||
| Comprehensive income (loss): |
||||||||||||||||||||||||||||||||
| Net income |
— | — | — | 560 | — | 560 | 154 | 714 | ||||||||||||||||||||||||
| Net unrealized gains (losses) on securities not other-than-temporarily impaired |
— | — | (1,778 | ) | — | — | (1,778 | ) | (39 | ) | (1,817 | ) | ||||||||||||||||||||
| Net unrealized gains (losses) on other-than-temporarily impaired securities |
— | — | 66 | — | — | 66 | — | 66 | ||||||||||||||||||||||||
| Derivatives qualifying as hedges |
— | — | (590 | ) | — | — | (590 | ) | — | (590 | ) | |||||||||||||||||||||
| Foreign currency translation and other adjustments |
— | — | (358 | ) | — | — | (358 | ) | (84 | ) | (442 | ) | ||||||||||||||||||||
|
|
|
|
|
|
|
|||||||||||||||||||||||||||
| Total comprehensive income (loss) |
(2,100 | ) | 31 | (2,069 | ) | |||||||||||||||||||||||||||
| Dividends to noncontrolling interests |
— | — | — | — | — | — | (52 | ) | (52 | ) | ||||||||||||||||||||||
| Stock-based compensation expense and exercises and other |
— | — | — | — | — | — | 3 | 3 | ||||||||||||||||||||||||
|
|
|
|
|
|
|
|
|
|
|
|
|
|
|
|
|
|||||||||||||||||
| Balances as of December 31, 2013 |
$ | 1 | $ | 12,127 | $ | 2,542 | $ | 2,423 | $ | (2,700 | ) | $ | 14,393 | $ | 1,227 | $ | 15,620 | |||||||||||||||
|
|
|
|
|
|
|
|
|
|
|
|
|
|
|
|
|
|||||||||||||||||
| Balances as of December 31, 2011 |
$ | 1 | $ | 12,136 | $ | 4,047 | $ | 1,538 | $ | (2,700 | ) | $ | 15,022 | $ | 1,110 | $ | 16,132 | |||||||||||||||
|
|
|
|||||||||||||||||||||||||||||||
| Comprehensive income (loss): |
||||||||||||||||||||||||||||||||
| Net income |
— | — | — | 325 | — | 325 | 200 | 525 | ||||||||||||||||||||||||
| Net unrealized gains (losses) on securities not other-than-temporarily impaired |
— | — | 1,075 | — | — | 1,075 | 3 | 1,078 | ||||||||||||||||||||||||
| Net unrealized gains (losses) on other-than-temporarily impaired securities |
— | — | 78 | — | — | 78 | — | 78 | ||||||||||||||||||||||||
| Derivatives qualifying as hedges |
— | — | (100 | ) | — | — | (100 | ) | — | (100 | ) | |||||||||||||||||||||
| Foreign currency translation and other adjustments |
— | — | 102 | — | — | 102 | 24 | 126 | ||||||||||||||||||||||||
|
|
|
|
|
|
|
|||||||||||||||||||||||||||
| Total comprehensive income (loss) |
1,480 | 227 | 1,707 | |||||||||||||||||||||||||||||
| Dividends to noncontrolling interests |
— | — | — | — | — | — | (50 | ) | (50 | ) | ||||||||||||||||||||||
| Stock-based compensation expense and exercises and other |
— | (9 | ) | — | — | — | (9 | ) | 1 | (8 | ) | |||||||||||||||||||||
|
|
|
|
|
|
|
|
|
|
|
|
|
|
|
|
|
|||||||||||||||||
| Balances as of December 31, 2012 |
$ | 1 | $ | 12,127 | $ | 5,202 | $ | 1,863 | $ | (2,700 | ) | $ | 16,493 | $ | 1,288 | $ | 17,781 | |||||||||||||||
|
|
|
|
|
|
|
|
|
|
|
|
|
|
|
|
|
|||||||||||||||||
See Notes to Consolidated Financial Statements
221
GENWORTH FINANCIAL, INC.
CONSOLIDATED STATEMENTS OF CHANGES IN STOCKHOLDERS’ EQUITY — (Continued)
(Amounts in millions)
| Common stock |
Additional paid-in capital |
Accumulated other comprehensive income (loss) |
Retained earnings |
Treasury stock, at cost |
Total Genworth Financial, Inc.’s stockholders’ equity |
Noncontrolling interests |
Total stockholders’ equity |
|||||||||||||||||||||||||
| Balances as of December 31, 2010 |
$ | 1 | $ | 12,107 | $ | 1,506 | $ | 1,500 | $ | (2,700 | ) | $ | 12,414 | $ | 1,096 | $ | 13,510 | |||||||||||||||
|
|
|
|||||||||||||||||||||||||||||||
| Repurchase of subsidiary shares |
— | — | — | — | — | — | (71 | ) | (71 | ) | ||||||||||||||||||||||
| Comprehensive income (loss): |
||||||||||||||||||||||||||||||||
| Net income |
— | — | — | 38 | — | 38 | 139 | 177 | ||||||||||||||||||||||||
| Net unrealized gains (losses) on securities not other-than-temporarily impaired |
— | — | 1,576 | — | — | 1,576 | 39 | 1,615 | ||||||||||||||||||||||||
| Net unrealized gains (losses) on other-than-temporarily impaired securities |
— | — | (11 | ) | — | — | (11 | ) | — | (11 | ) | |||||||||||||||||||||
| Derivatives qualifying as hedges |
— | — | 1,085 | — | — | 1,085 | — | 1,085 | ||||||||||||||||||||||||
| Foreign currency translation and other adjustments |
— | — | (109 | ) | — | — | (109 | ) | (26 | ) | (135 | ) | ||||||||||||||||||||
|
|
|
|
|
|
|
|||||||||||||||||||||||||||
| Total comprehensive income (loss) |
2,579 | 152 | 2,731 | |||||||||||||||||||||||||||||
| Dividends to noncontrolling interests |
— | — | — | — | — | — | (67 | ) | (67 | ) | ||||||||||||||||||||||
| Stock-based compensation expense and exercises and other |
— | 29 | — | — | — | 29 | — | 29 | ||||||||||||||||||||||||
|
|
|
|
|
|
|
|
|
|
|
|
|
|
|
|
|
|||||||||||||||||
| Balances as of December 31, 2011 |
$ | 1 | $ | 12,136 | $ | 4,047 | $ | 1,538 | $ | (2,700 | ) | $ | 15,022 | $ | 1,110 | $ | 16,132 | |||||||||||||||
|
|
|
|
|
|
|
|
|
|
|
|
|
|
|
|
|
|||||||||||||||||
See Notes to Consolidated Financial Statements
222
CONSOLIDATED STATEMENTS OF CASH FLOWS
(Amounts in millions)
| Years ended December 31, | ||||||||||||
| 2013 | 2012 | 2011 | ||||||||||
| Cash flows from operating activities: |
||||||||||||
| Net income |
$ | 714 | $ | 525 | $ | 177 | ||||||
| Less (income) loss from discontinued operations, net of taxes |
12 | (57 | ) | (36 | ) | |||||||
| Adjustments to reconcile net income to net cash from operating activities: |
||||||||||||
| Amortization of fixed maturity discounts and premiums and limited partnerships |
(97 | ) | (88 | ) | (77 | ) | ||||||
| Net investment (gains) losses |
37 | (27 | ) | 195 | ||||||||
| Charges assessed to policyholders |
(812 | ) | (801 | ) | (690 | ) | ||||||
| Acquisition costs deferred |
(457 | ) | (611 | ) | (637 | ) | ||||||
| Amortization of deferred acquisition costs and intangibles |
569 | 722 | 593 | |||||||||
| Goodwill impairment |
— | 89 | 29 | |||||||||
| Deferred income taxes |
(79 | ) | 82 | (350 | ) | |||||||
| Gain on sale of subsidiary |
— | — | (36 | ) | ||||||||
| Net increase (decrease) in trading securities, held-for-sale investments and derivative instruments |
(59 | ) | 191 | 1,451 | ||||||||
| Stock-based compensation expense |
41 | 26 | 31 | |||||||||
| Change in certain assets and liabilities: |
||||||||||||
| Accrued investment income and other assets |
(43 | ) | (68 | ) | (174 | ) | ||||||
| Insurance reserves |
2,256 | 2,330 | 2,507 | |||||||||
| Current tax liabilities |
288 | (234 | ) | 145 | ||||||||
| Other liabilities and other policy-related balances |
(1,039 | ) | (1,166 | ) | (73 | ) | ||||||
| Cash from operating activities—discontinued operations |
68 | 49 | 70 | |||||||||
|
|
|
|
|
|
|
|||||||
| Net cash from operating activities |
1,399 | 962 | 3,125 | |||||||||
|
|
|
|
|
|
|
|||||||
| Cash flows from investing activities: |
||||||||||||
| Proceeds from maturities and repayments of investments: |
||||||||||||
| Fixed maturity securities |
5,040 | 5,176 | 5,233 | |||||||||
| Commercial mortgage loans |
896 | 891 | 912 | |||||||||
| Restricted commercial mortgage loans related to securitization entities |
60 | 67 | 96 | |||||||||
| Proceeds from sales of investments: |
||||||||||||
| Fixed maturity and equity securities |
4,436 | 5,735 | 6,284 | |||||||||
| Purchases and originations of investments: |
||||||||||||
| Fixed maturity and equity securities |
(10,805 | ) | (12,322 | ) | (11,885 | ) | ||||||
| Commercial mortgage loans |
(873 | ) | (692 | ) | (300 | ) | ||||||
| Other invested assets, net |
89 | 416 | (529 | ) | ||||||||
| Policy loans, net |
242 | (29 | ) | (79 | ) | |||||||
| Proceeds from sale of a subsidiary, net of cash transferred |
365 | 77 | 211 | |||||||||
| Payments for businesses purchased, net of cash acquired |
— | — | (3 | ) | ||||||||
| Cash from investing activities—discontinued operations |
(30 | ) | (41 | ) | 1 | |||||||
|
|
|
|
|
|
|
|||||||
| Net cash from investing activities |
(580 | ) | (722 | ) | (59 | ) | ||||||
|
|
|
|
|
|
|
|||||||
| Cash flows from financing activities: |
||||||||||||
| Deposits to universal life and investment contracts |
2,999 | 2,810 | 2,664 | |||||||||
| Withdrawals from universal life and investment contracts |
(3,269 | ) | (2,781 | ) | (3,688 | ) | ||||||
| Redemption and repurchase of non-recourse funding obligations |
(28 | ) | (1,056 | ) | (130 | ) | ||||||
| Proceeds from the issuance of long-term debt |
793 | 361 | 545 | |||||||||
| Repayment and repurchase of long-term debt |
(365 | ) | (322 | ) | (760 | ) | ||||||
| Repayment of borrowings related to securitization entities |
(108 | ) | (72 | ) | (96 | ) | ||||||
| Repurchase of subsidiary shares |
(43 | ) | — | (71 | ) | |||||||
| Dividends paid to noncontrolling interests |
(52 | ) | (50 | ) | (67 | ) | ||||||
| Other, net |
(73 | ) | 54 | 26 | ||||||||
| Cash from financing activities—discontinued operations |
(3 | ) | (45 | ) | (64 | ) | ||||||
|
|
|
|
|
|
|
|||||||
| Net cash from financing activities |
(149 | ) | (1,101 | ) | (1,641 | ) | ||||||
|
|
|
|
|
|
|
|||||||
| Effect of exchange rate changes on cash and cash equivalents |
(109 | ) | 26 | (69 | ) | |||||||
|
|
|
|
|
|
|
|||||||
| Net change in cash and cash equivalents |
561 | (835 | ) | 1,356 | ||||||||
| Cash and cash equivalents at beginning of period |
3,653 | 4,488 | 3,132 | |||||||||
|
|
|
|
|
|
|
|||||||
| Cash and cash equivalents at end of period |
4,214 | 3,653 | 4,488 | |||||||||
| Less cash and cash equivalents of discontinued operations at end of period |
— | 21 | 45 | |||||||||
|
|
|
|
|
|
|
|||||||
| Cash and cash equivalents of continuing operations at end of period |
$ | 4,214 | $ | 3,632 | $ | 4,443 | ||||||
|
|
|
|
|
|
|
|||||||
See Notes to Consolidated Financial Statements
223
NOTES TO CONSOLIDATED FINANCIAL STATEMENTS
Years Ended December 31, 2013, 2012 and 2011
(1) Nature of Business and Formation of Genworth
Genworth Holdings, Inc. (“Genworth Holdings”) (formerly known as Genworth Financial, Inc.) was incorporated in Delaware in 2003 in preparation for an initial public offering (“IPO”) of Genworth common stock, which was completed on May 28, 2004. On April 1, 2013, Genworth Holdings completed a holding company reorganization pursuant to which Genworth Holdings became a direct, 100% owned subsidiary of a new public holding company that it had formed. The new public holding company was incorporated in Delaware on December 5, 2012, in connection with the reorganization, under the name Sub XLVI, Inc., and was renamed Genworth Financial, Inc. (“Genworth Financial”) upon the completion of the reorganization.
To implement the reorganization, Genworth Holdings formed Genworth Financial and Genworth Financial, in turn, formed Sub XLII, Inc. (“Merger Sub”). The holding company structure was implemented pursuant to Section 251(g) of the General Corporation Law of the State of Delaware (“DGCL”) by the merger of Merger Sub with and into Genworth Holdings (the “Merger”). Genworth Holdings survived the Merger as a direct, 100% owned subsidiary of Genworth Financial and each share of Genworth Holdings Class A Common Stock, par value $0.001 per share (“Genworth Holdings Class A Common Stock”), issued and outstanding immediately prior to the Merger and each share of Genworth Holdings Class A Common Stock held in the treasury of Genworth Holdings immediately prior to the Merger converted into one issued and outstanding or treasury, as applicable, share of Genworth Financial Class A Common Stock, par value $0.001 per share, having the same designations, rights, powers and preferences and the qualifications, limitations and restrictions as the Genworth Holdings Class A Common Stock being converted.
Immediately after the consummation of the Merger, Genworth Financial had the same authorized, outstanding and treasury capital stock as Genworth Holdings immediately prior to the Merger. Each share of Genworth Financial common stock outstanding immediately prior to the Merger was cancelled. Effective upon the consummation of the Merger, Genworth Financial adopted an amended and restated certificate of incorporation and amended and restated bylaws that were identical to those of Genworth Holdings immediately prior to the consummation of the Merger (other than provisions regarding certain technical matters, as permitted by Section 251(g) of the DGCL). Genworth Financial’s directors and executive officers immediately after the consummation of the Merger were the same as the directors and executive officers of Genworth Holdings immediately prior to the consummation of the Merger. Immediately after the consummation of the Merger, Genworth Financial had, on a consolidated basis, the same assets, businesses and operations as Genworth Holdings had immediately prior to the consummation of the Merger.
On April 1, 2013, in connection with the reorganization, immediately following the consummation of the Merger, Genworth Holdings distributed to Genworth Financial (as its sole stockholder), through a dividend (the “Distribution”), the 84.6% membership interest in one of its subsidiaries (Genworth Mortgage Holdings, LLC (“GMHL”)) that it held directly, and 100% of the shares of another of its subsidiaries (Genworth Mortgage Holdings, Inc. (“GMHI”)), that held the remaining 15.4% of outstanding membership interests of GMHL. At the time of the Distribution, GMHL and GMHI together owned (directly or indirectly) 100% of the shares or other equity interests of all of the subsidiaries that conducted Genworth Holdings’ U.S. mortgage insurance business (these subsidiaries also owned the subsidiaries that conducted Genworth Holdings’ European mortgage insurance business). As part of the comprehensive U.S. mortgage insurance capital plan, on April 1, 2013, immediately prior to the Distribution, Genworth Holdings contributed $100 million to the U.S. mortgage insurance subsidiaries.
224
GENWORTH FINANCIAL, INC.
NOTES TO CONSOLIDATED FINANCIAL STATEMENTS
Years Ended December 31, 2013, 2012 and 2011
References to “Genworth,” the “Company,” “we” or “our” in the accompanying consolidated financial statements and these notes thereto have the following meanings, unless the context otherwise requires:
| • | For periods prior to April 1, 2013: Genworth Holdings and its subsidiaries |
| • | For periods from and after April 1, 2013: Genworth Financial and its subsidiaries |
The accompanying financial statements include on a consolidated basis the accounts of Genworth and our affiliate companies in which we hold a majority voting interest or where we are the primary beneficiary of a variable interest entity (“VIE”). All intercompany accounts and transactions have been eliminated in consolidation.
We have the following operating segments:
| • | U.S. Life Insurance. We offer and manage a variety of insurance and fixed annuity products in the United States. Our primary products include life insurance, long-term care insurance and fixed annuities. |
| • | International Mortgage Insurance. We are a leading provider of mortgage insurance products and related services in Canada and Australia and also participate in select European and other countries. Our products predominantly insure prime-based, individually underwritten residential mortgage loans, also known as flow mortgage insurance. We also selectively provide mortgage insurance on a structured, or bulk, basis that aids in the sale of mortgages to the capital markets and helps lenders manage capital and risk. Additionally, we offer services, analytical tools and technology that enable lenders to operate efficiently and manage risk. |
| • | U.S. Mortgage Insurance. In the United States, we offer mortgage insurance products predominantly insuring prime-based, individually underwritten residential mortgage loans, also known as flow mortgage insurance. We selectively provide mortgage insurance on a bulk basis with essentially all of our bulk writings prime-based. Additionally, we offer services, analytical tools and technology that enable lenders to operate efficiently and manage risk. |
| • | International Protection. We are a leading provider of payment protection coverages (referred to as lifestyle protection) in multiple European countries and have operations in select other countries. Our lifestyle protection insurance products primarily help consumers meet specified payment obligations should they become unable to pay due to accident, illness, involuntary unemployment, disability or death. |
| • | Runoff. The Runoff segment includes the results of non-strategic products which are no longer actively sold. Our non-strategic products primarily include our variable annuity, variable life insurance, institutional, corporate-owned life insurance and other accident and health insurance products. Institutional products consist of: funding agreements, funding agreements backing notes (“FABNs”) and guaranteed investment contracts (“GICs”). In January 2011, we discontinued new sales of retail and group variable annuities while continuing to service our existing blocks of business. |
We also have Corporate and Other activities which include debt financing expenses that are incurred at the Genworth Holdings level, unallocated corporate income and expenses, eliminations of inter-segment transactions and the results of other businesses that are managed outside of our operating segments, including discontinued operations. See note 25 for additional information related to discontinued operations.
225
GENWORTH FINANCIAL, INC.
NOTES TO CONSOLIDATED FINANCIAL STATEMENTS
Years Ended December 31, 2013, 2012 and 2011
(2) Summary of Significant Accounting Policies
Our consolidated financial statements have been prepared on the basis of U.S. generally accepted accounting principles (“U.S. GAAP”). Preparing financial statements in conformity with U.S. GAAP requires us to make estimates and assumptions that affect reported amounts and related disclosures. Actual results could differ from those estimates. Certain prior year amounts have been reclassified to conform to the current year presentation.
a) Premiums
For traditional long-duration insurance contracts, we report premiums as earned when due. For short-duration insurance contracts, we report premiums as revenue over the terms of the related insurance policies on a pro-rata basis or in proportion to expected claims.
For single premium mortgage insurance contracts, we report premiums over the estimated policy life in accordance with the expected pattern of risk emergence as further described in our accounting policy for unearned premiums. In addition, we have a practice of refunding the post-delinquent premiums in our U.S. mortgage insurance business to the insured party if the delinquent loan goes to claim. We record a liability for premiums received on the delinquent loans where our practice is to refund post-delinquent premiums.
Premiums received under annuity contracts without significant mortality risk and premiums received on investment and universal life insurance products are not reported as revenues but rather as deposits and are included in liabilities for policyholder account balances.
b) Net Investment Income and Net Investment Gains and Losses
Investment income is recognized when earned. Income or losses upon call or prepayment of available-for-sale fixed maturity securities is recognized in net investment income, except for hybrid securities where the income or loss upon call is recognized in net investment gains and losses. Investment gains and losses are calculated on the basis of specific identification.
Investment income on mortgage-backed and asset-backed securities is initially based upon yield, cash flow and prepayment assumptions at the date of purchase. Subsequent revisions in those assumptions are recorded using the retrospective or prospective method. Under the retrospective method used for mortgage-backed and asset-backed securities of high credit quality (ratings equal to or greater than “AA” or that are backed by a U.S. agency) which cannot be contractually prepaid in such a manner that we would not recover a substantial portion of the initial investment, amortized cost of the security is adjusted to the amount that would have existed had the revised assumptions been in place at the date of purchase. The adjustments to amortized cost are recorded as a charge or credit to net investment income. Under the prospective method, which is used for all other mortgage-backed and asset-backed securities, future cash flows are estimated and interest income is recognized going forward using the new internal rate of return.
c) Insurance and Investment Product Fees and Other
Insurance and investment product fees and other consist primarily of insurance charges assessed on universal and term universal life insurance contracts and fees assessed against customer account values. For universal and term universal life insurance contracts, charges to policyholder accounts for cost of insurance are recognized as revenue when due. Variable product fees are charged to variable annuity contractholders and
226
GENWORTH FINANCIAL, INC.
NOTES TO CONSOLIDATED FINANCIAL STATEMENTS
Years Ended December 31, 2013, 2012 and 2011
variable life insurance policyholders based upon the daily net assets of the contractholder’s and policyholder’s account values and are recognized as revenue when charged. Policy surrender fees are recognized as income when the policy is surrendered.
d) Investment Securities
At the time of purchase, we designate our investment securities as either available-for-sale or trading and report them in our consolidated balance sheets at fair value. Our portfolio of fixed maturity securities comprises primarily investment grade securities. Changes in the fair value of available-for-sale investments, net of the effect on deferred acquisition costs (“DAC”), present value of future profits (“PVFP”), benefit reserves and deferred income taxes, are reflected as unrealized investment gains or losses in a separate component of accumulated other comprehensive income (loss). Realized and unrealized gains and losses related to trading securities are reflected in net investment gains (losses). Trading securities are included in other invested assets in our consolidated balance sheets and primarily represent fixed maturity securities where we utilized the fair value option.
Other-Than-Temporary Impairments On Available-For-Sale Securities
As of each balance sheet date, we evaluate securities in an unrealized loss position for other-than-temporary impairments. For debt securities, we consider all available information relevant to the collectability of the security, including information about past events, current conditions, and reasonable and supportable forecasts, when developing the estimate of cash flows expected to be collected. More specifically for mortgage-backed and asset-backed securities, we also utilize performance indicators of the underlying assets including default or delinquency rates, loan to collateral value ratios, third-party credit enhancements, current levels of subordination, vintage and other relevant characteristics of the security or underlying assets to develop our estimate of cash flows. Estimating the cash flows expected to be collected is a quantitative and qualitative process that incorporates information received from third-party sources along with certain internal assumptions and judgments regarding the future performance of the underlying collateral. Where possible, this data is benchmarked against third-party sources.
We recognize other-than-temporary impairments on debt securities in an unrealized loss position when one of the following circumstances exists:
| • | we do not expect full recovery of our amortized cost based on the estimate of cash flows expected to be collected, |
| • | we intend to sell a security or |
| • | it is more likely than not that we will be required to sell a security prior to recovery. |
For other-than-temporary impairments recognized during the period, we present the total other-than-temporary impairments, the portion of other-than-temporary impairments included in other comprehensive income (loss) (“OCI”) and the net other-than-temporary impairments as supplemental disclosure presented on the face of our consolidated statements of income.
Total other-than-temporary impairments are calculated as the difference between the amortized cost and fair value that emerged in the current period. For other-than-temporarily impaired securities where we do not intend to sell the security and it is not more likely than not that we will be required to sell the security prior to recovery, total other-than-temporary impairments are adjusted by the portion of other-than-temporary impairments
227
GENWORTH FINANCIAL, INC.
NOTES TO CONSOLIDATED FINANCIAL STATEMENTS
Years Ended December 31, 2013, 2012 and 2011
recognized in OCI (“non-credit”). Net other-than-temporary impairments recorded in net income (loss) represent the credit loss on the other-than-temporarily impaired securities with the offset recognized as an adjustment to the amortized cost to determine the new amortized cost basis of the securities.
For securities that were deemed to be other-than-temporarily impaired and a non-credit loss was recorded in OCI, the amount recorded as an unrealized gain (loss) represents the difference between the current fair value and the new amortized cost for each period presented. The unrealized gain (loss) on an other-than-temporarily impaired security is recorded as a separate component in OCI until the security is sold or until we record an other-than-temporary impairment where we intend to sell the security or will be required to sell the security prior to recovery.
To estimate the amount of other-than-temporary impairment attributed to credit losses on debt securities where we do not intend to sell the security and it is not more likely than not that we will be required to sell the security prior to recovery, we determine our best estimate of the present value of the cash flows expected to be collected from a security by discounting these cash flows at the current effective yield on the security prior to recording any other-than-temporary impairment. If the present value of the discounted cash flows is lower than the amortized cost of the security, the difference between the present value and amortized cost represents the credit loss associated with the security with the remaining difference between fair value and amortized cost recorded as a non-credit other-than-temporary impairment in OCI.
The evaluation of other-than-temporary impairments is subject to risks and uncertainties and is intended to determine the appropriate amount and timing for recognizing an impairment charge. The assessment of whether such impairment has occurred is based on management’s best estimate of the cash flows expected to be collected at the individual security level. We regularly monitor our investment portfolio to ensure that securities that may be other-than-temporarily impaired are identified in a timely manner and that any impairment charge is recognized in the proper period.
While the other-than-temporary impairment model for debt securities generally includes fixed maturity securities, there are certain hybrid securities that are classified as fixed maturity securities where the application of a debt impairment model depends on whether there has been any evidence of deterioration in credit of the issuer. Under certain circumstances, evidence of deterioration in credit of the issuer may result in the application of the equity securities impairment model.
For equity securities, we recognize an impairment charge in the period in which we determine that the security will not recover to book value within a reasonable period. We determine what constitutes a reasonable period on a security-by-security basis based upon consideration of all the evidence available to us, including the magnitude of an unrealized loss and its duration. In any event, this period does not exceed 18 months for common equity securities. We measure other-than-temporary impairments based upon the difference between the amortized cost of a security and its fair value.
e) Fair Value Measurements
Fair value is defined as the price that would be received to sell an asset or paid to transfer a liability in an orderly transaction between market participants at the measurement date. We have fixed maturity, equity and trading securities, derivatives, embedded derivatives, securities held as collateral, separate account assets and certain other financial instruments, which are carried at fair value.
228
GENWORTH FINANCIAL, INC.
NOTES TO CONSOLIDATED FINANCIAL STATEMENTS
Years Ended December 31, 2013, 2012 and 2011
Fair value measurements are based upon observable and unobservable inputs. Observable inputs reflect market data obtained from independent sources, while unobservable inputs reflect our view of market assumptions in the absence of observable market information. We utilize valuation techniques that maximize the use of observable inputs and minimize the use of unobservable inputs. All assets and liabilities carried at fair value are classified and disclosed in one of the following three categories:
| • | Level 1—Quoted prices for identical instruments in active markets. |
| • | Level 2—Quoted prices for similar instruments in active markets; quoted prices for identical or similar instruments in markets that are not active; and model-derived valuations whose inputs are observable or whose significant value drivers are observable. |
| • | Level 3—Instruments whose significant value drivers are unobservable. |
Level 1 primarily consists of financial instruments whose value is based on quoted market prices such as exchange-traded derivatives and actively traded mutual fund investments.
Level 2 includes those financial instruments that are valued using industry-standard pricing methodologies, models or other valuation methodologies. These models are primarily industry-standard models that consider various inputs, such as interest rate, credit spread and foreign exchange rates for the underlying financial instruments. All significant inputs are observable, or derived from observable, information in the marketplace or are supported by observable levels at which transactions are executed in the marketplace. Financial instruments in this category primarily include: certain public and private corporate fixed maturity and equity securities; government or agency securities; certain mortgage-backed and asset-backed securities; securities held as collateral; and certain non-exchange-traded derivatives such as interest rate or cross currency swaps.
Level 3 comprises financial instruments whose fair value is estimated based on industry-standard pricing methodologies and internally developed models utilizing significant inputs not based on, nor corroborated by, readily available market information. In limited instances, this category may also utilize non-binding broker quotes. This category primarily consists of certain less liquid fixed maturity, equity and trading securities and certain derivative instruments or embedded derivatives where we cannot corroborate the significant valuation inputs with market observable data.
As of each reporting period, all assets and liabilities recorded at fair value are classified in their entirety based on the lowest level of input that is significant to the fair value measurement. Our assessment of the significance of a particular input to the fair value measurement in its entirety requires judgment, and considers factors specific to the asset or liability, such as the relative impact on the fair value as a result of including a particular input. We review the fair value hierarchy classifications each reporting period. Changes in the observability of the valuation attributes may result in a reclassification of certain financial assets or liabilities. Such reclassifications are reported as transfers in and out of Level 3 at the beginning fair value for the reporting period in which the changes occur. See note 17 for additional information related to fair value measurements.
f) Commercial Mortgage Loans
Commercial mortgage loans are stated at principal amounts outstanding, net of deferred expenses and allowance for loan loss. Interest on loans is recognized on an accrual basis at the applicable interest rate on the principal amount outstanding. Loan origination fees and direct costs, as well as premiums and discounts, are amortized as level yield adjustments over the respective loan terms. Unamortized net fees or costs are recognized upon early repayment of the loans. Loan commitment fees are deferred and amortized on an effective yield basis
229
GENWORTH FINANCIAL, INC.
NOTES TO CONSOLIDATED FINANCIAL STATEMENTS
Years Ended December 31, 2013, 2012 and 2011
over the term of the loan. Commercial mortgage loans are considered past due when contractual payments have not been received from the borrower by the required payment date.
“Impaired” loans are defined by U.S. GAAP as loans for which it is probable that the lender will be unable to collect all amounts due according to original contractual terms of the loan agreement. In determining whether it is probable that we will be unable to collect all amounts due, we consider current payment status, debt service coverage ratios, occupancy levels and current loan-to-value. Impaired loans are carried on a non-accrual status. Loans are placed on non-accrual status when, in management’s opinion, the collection of principal or interest is unlikely, or when the collection of principal or interest is 90 days or more past due. Income on impaired loans is not recognized until the loan is sold or the cash received exceeds the carrying amount recorded.
We evaluate the impairment of commercial mortgage loans first on an individual loan basis. If an individual loan is not deemed impaired, then we evaluate the remaining loans collectively to determine whether an impairment should be recorded.
For individually impaired loans, we record an impairment charge when it is probable that a loss has been incurred. The impairment is recorded as an increase in the allowance for loan losses. All losses of principal are charged to the allowance for loan losses in the period in which the loan is deemed to be uncollectible.
For loans that are not individually impaired where we evaluate the loans collectively, the allowance for loan losses is maintained at a level that we determine is adequate to absorb estimated probable incurred losses in the loan portfolio. Our process to determine the adequacy of the allowance utilizes an analytical model based on historical loss experience adjusted for current events, trends and economic conditions that would result in a loss in the loan portfolio over the next 12 months. Key inputs into our evaluation include debt service coverage ratios, loan-to-value, property-type, occupancy levels, geographic region, and probability weighting of the scenarios generated by the model. The actual amounts realized could differ in the near term from the amounts assumed in arriving at the allowance for loan losses reported in the consolidated financial statements. Additions and reductions to the allowance through periodic provisions or benefits are recorded in net investment gains (losses).
For commercial mortgage loans classified as held-for-sale, each loan is carried at the lower of cost or market and is included in commercial mortgage loans in our consolidated balance sheets. See note 4 for additional disclosures related to commercial mortgage loans.
g) Securities Lending Activity
In the United States and Canada, we engage in certain securities lending transactions for the purpose of enhancing the yield on our investment securities portfolio. We maintain effective control over all loaned securities and, therefore, continue to report such securities as fixed maturity securities on the consolidated balance sheets. We are currently indemnified against counterparty credit risk by the intermediary.
Under the securities lending program in the United States, the borrower is required to provide collateral, which can consist of cash or government securities, on a daily basis in amounts equal to or exceeding 102% of the applicable securities loaned. Currently, we only accept cash collateral from borrowers under the program. Cash collateral received by us on securities lending transactions is reflected in other invested assets with an offsetting liability recognized in other liabilities for the obligation to return the collateral. Any cash collateral received is reinvested by our custodian based upon the investment guidelines provided within our agreement. In
230
GENWORTH FINANCIAL, INC.
NOTES TO CONSOLIDATED FINANCIAL STATEMENTS
Years Ended December 31, 2013, 2012 and 2011
the United States, the reinvested cash collateral is primarily invested in a money market fund approved by the National Association of Insurance Commissioners (“NAIC”), U.S. and foreign government securities, U.S. government agency securities, asset-backed securities and corporate debt securities. As of December 31, 2013 and 2012, the fair value of securities loaned under our securities lending program in the United States was $191 million and $194 million, respectively. As of December 31, 2013 and 2012, the fair value of collateral held under our securities lending program in the United States was $187 million and the offsetting obligation to return collateral of $199 million and $203 million, respectively, was included in other liabilities in the consolidated balance sheets. We did not have any non-cash collateral provided by the borrower in our securities lending program in the United States as of December 31, 2013 and 2012.
Under our securities lending program in Canada, the borrower is required to provide collateral consisting of government securities on a daily basis in amounts equal to or exceeding 105% of the fair value of the applicable securities loaned. Securities received from counterparties as collateral are not recorded on our consolidated balance sheet given that the risk and rewards of ownership is not transferred from the counterparties to us in the course of such transactions. Additionally, there was no cash collateral as cash collateral is not permitted as an acceptable form of collateral under the program. In Canada, the lending institution must be included on the approved Securities Lending Borrowers List with the Canadian regulator and the intermediary must be rated at least “AA-” by Standard & Poor’s Financial Services LLC. As of December 31, 2013 and 2012, the fair value of securities loaned under our securities lending program in Canada was $229 million and $210 million, respectively.
h) Repurchase Agreements
We have a repurchase program in which we sell an investment security at a specified price and agree to repurchase that security at another specified price at a later date. Repurchase agreements are treated as collateralized financing transactions and are carried at the amounts at which the securities will be subsequently reacquired, including accrued interest, as specified in the respective agreement. The market value of securities to be repurchased is monitored and collateral levels are adjusted where appropriate to protect the counterparty against credit exposure. Cash received is invested in fixed maturity securities. As of December 31, 2013 and 2012, the fair value of securities pledged under the repurchase program was $890 million and $1,616 million, respectively, and the repurchase obligation of $919 million and $1,534 million, respectively, was included in other liabilities in the consolidated balance sheets.
i) Cash and Cash Equivalents
Certificates of deposit, money market funds and other time deposits with original maturities of 90 days or less are considered cash equivalents in the consolidated balance sheets and consolidated statements of cash flows. Items with maturities greater than 90 days but less than one year at the time of acquisition are considered short-term investments.
j) Deferred Acquisition Costs
Acquisition costs include costs that are related directly to the successful acquisition of new and renewal insurance policies and investment contracts. Such costs are deferred and amortized as follows:
Long-Duration Contracts. Acquisition costs include commissions in excess of ultimate renewal commissions and for contracts and policies issued, some other costs such as underwriting, medical inspection and
231
GENWORTH FINANCIAL, INC.
NOTES TO CONSOLIDATED FINANCIAL STATEMENTS
Years Ended December 31, 2013, 2012 and 2011
issuance expenses. Amortization for traditional long-duration insurance products is determined as a level proportion of premium based on commonly accepted actuarial methods and reasonable assumptions about mortality, morbidity, lapse rates, expenses and future yield on related investments established when the contract or policy is issued. Amortization is adjusted each period to reflect policy lapse or termination rates as compared to anticipated experience. Amortization for annuity contracts without significant mortality risk and for investment and universal life insurance products is based on expected gross profits. Expected gross profits are adjusted quarterly to reflect actual experience to date or for the unlocking of underlying key assumptions relating to future gross profits based on experience studies.
Short-Duration Contracts. Acquisition costs primarily consist of commissions and premium taxes and are amortized ratably over the terms of the underlying policies.
We regularly review all of these assumptions and periodically test DAC for recoverability. For deposit products, if the current present value of expected future gross profits is less than the unamortized DAC for a line of business, a charge to income is recorded for additional DAC amortization, and for certain products, an increase in benefit reserves may be required. For other products, if the benefit reserve plus anticipated future premiums and interest income for a line of business are less than the current estimate of future benefits and expenses (including any unamortized DAC), a charge to income is recorded for additional DAC amortization or for increased benefit reserves. See note 6 for additional information related to DAC including loss recognition and recoverability.
k) Intangible Assets
Present Value of Future Profits. In conjunction with the acquisition of a block of insurance policies or investment contracts, a portion of the purchase price is assigned to the right to receive future gross profits arising from existing insurance and investment contracts. This intangible asset, called PVFP, represents the actuarially estimated present value of future cash flows from the acquired policies. PVFP is amortized, net of accreted interest, in a manner similar to the amortization of DAC.
We regularly review all of these assumptions and periodically test PVFP for recoverability. For deposit products, if the current present value of estimated future gross profits is less than the unamortized PVFP for a line of business, a charge to income is recorded for additional PVFP amortization. For other products, if the benefit reserve plus anticipated future premiums and interest income for a line of business are less than the current estimate of future benefits and expenses (including any unamortized PVFP), a charge to income is recorded for additional PVFP amortization or for increased benefit reserves. For the years ended December 31, 2013, 2012 and 2011, no charges to income were recorded as a result of our PVFP recoverability or loss recognition testing.
Deferred Sales Inducements to Contractholders. We defer sales inducements to contractholders for features on variable annuities that entitle the contractholder to an incremental amount to be credited to the account value upon making a deposit, and for fixed annuities with crediting rates higher than the contract’s expected ongoing crediting rates for periods after the inducement. Deferred sales inducements to contractholders are reported as a separate intangible asset and amortized in benefits and other changes in policy reserves using the same methodology and assumptions used to amortize DAC.
Other Intangible Assets. We amortize the costs of other intangibles over their estimated useful lives unless such lives are deemed indefinite. Amortizable intangible assets are tested for impairment based on undiscounted
232
GENWORTH FINANCIAL, INC.
NOTES TO CONSOLIDATED FINANCIAL STATEMENTS
Years Ended December 31, 2013, 2012 and 2011
cash flows, which requires the use of estimates and judgment, and, if impaired, written down to fair value based on either discounted cash flows or appraised values. Intangible assets with indefinite lives are tested at least annually for impairment using a qualitative or quantitative assessment and are written down to fair value as required.
l) Goodwill
Goodwill is not amortized but is tested for impairment annually or between annual tests if an event occurs or circumstances change that would more likely than not reduce the fair value of the reporting unit below its carrying value. We are permitted to utilize a qualitative impairment assessment if the fair value of the reporting unit is not more likely than not lower than its carrying value. If a qualitative impairment assessment is not performed, we are required to determine the fair value of the reporting unit. The determination of fair value requires the use of estimates and judgment, at the “reporting unit” level. A reporting unit is the operating segment, or a business, one level below that operating segment (the “component” level) if discrete financial information is prepared and regularly reviewed by management at the component level. If the reporting unit’s fair value is below its carrying value, we must determine the amount of implied goodwill that would be established if the reporting unit was hypothetically purchased on the impairment assessment date. We recognize an impairment charge for any amount by which the carrying amount of a reporting unit’s goodwill exceeds the amount of implied goodwill.
The determination of fair value for our reporting units is primarily based on an income approach whereby we use discounted cash flows for each reporting unit. When available and as appropriate, we use market approaches or other valuation techniques to corroborate discounted cash flow results. The discounted cash flow model used for each reporting unit is based on either: operating income or statutory distributable income, depending on the reporting unit being valued.
The cash flows used to determine fair value are dependent on a number of significant management assumptions based on our historical experience, our expectations of future performance, and expected economic environment. Our estimates are subject to change given the inherent uncertainty in predicting future performance and cash flows, which are impacted by such things as policyholder behavior, competitor pricing, new product introductions and specific industry and market conditions. Additionally, the discount rate used in our discounted cash flow approach is based on management’s judgment of the appropriate rate for each reporting unit based on the relative risk associated with the projected cash flows.
See note 8 for additional information related to goodwill and impairments recorded.
m) Reinsurance
Premium revenue, benefits and acquisition and operating expenses, net of deferrals, are reported net of the amounts relating to reinsurance ceded to and assumed from other companies. Amounts due from reinsurers for incurred and estimated future claims are reflected in the reinsurance recoverable asset. Amounts received from reinsurers that represent recovery of acquisition costs are netted against DAC so that the net amount is capitalized. The cost of reinsurance is accounted for over the terms of the related treaties using assumptions consistent with those used to account for the underlying reinsured policies. Premium revenue, benefits and acquisition and operating expenses, net of deferrals, for reinsurance contracts that do not qualify for reinsurance accounting are accounted for under the deposit method of accounting.
233
GENWORTH FINANCIAL, INC.
NOTES TO CONSOLIDATED FINANCIAL STATEMENTS
Years Ended December 31, 2013, 2012 and 2011
n) Derivatives
Derivative instruments are used to manage risk through one of four principal risk management strategies including: (i) liabilities; (ii) invested assets; (iii) portfolios of assets or liabilities; and (iv) forecasted transactions.
On the date we enter into a derivative contract, management designates the derivative as a hedge of the identified exposure (fair value, cash flow or foreign currency). If a derivative does not qualify for hedge accounting, the changes in its fair value and all scheduled periodic settlement receipts and payments are reported in income.
We formally document all relationships between hedging instruments and hedged items, as well as our risk management objective and strategy for undertaking various hedge transactions. In this documentation, we specifically identify the asset, liability or forecasted transaction that has been designated as a hedged item, state how the hedging instrument is expected to hedge the risks related to the hedged item, and set forth the method that will be used to retrospectively and prospectively assess the hedging instrument’s effectiveness and the method that will be used to measure hedge ineffectiveness. We generally determine hedge effectiveness based on total changes in fair value of the hedged item attributable to the hedged risk and the total changes in fair value of the derivative instrument.
We discontinue hedge accounting prospectively when: (i) it is determined that the derivative is no longer effective in offsetting changes in the fair value or cash flows of a hedged item; (ii) the derivative expires or is sold, terminated or exercised; (iii) the derivative is de-designated as a hedge instrument; or (iv) it is no longer probable that the forecasted transaction will occur.
For all qualifying and highly effective cash flow hedges, the effective portion of changes in fair value of the derivative instrument is reported as a component of OCI. The ineffective portion of changes in fair value of the derivative instrument is reported as a component of income. When hedge accounting is discontinued because it is probable that a forecasted transaction will not occur, the derivative continues to be carried in the consolidated balance sheets at its fair value, and gains and losses that were accumulated in OCI are recognized immediately in income. When the hedged forecasted transaction is no longer probable, but is reasonably possible, the accumulated gain or loss remains in OCI and is recognized when the transaction affects income; however, prospective hedge accounting for the transaction is terminated. In all other situations in which hedge accounting is discontinued on a cash flow hedge, amounts previously deferred in OCI are reclassified into income when income is impacted by the variability of the cash flow of the hedged item.
For all qualifying and highly effective fair value hedges, the changes in fair value of the derivative instrument are reported in income. In addition, changes in fair value attributable to the hedged portion of the underlying instrument are reported in income. When hedge accounting is discontinued because it is determined that the derivative no longer qualifies as an effective fair value hedge, the derivative continues to be carried in the consolidated balance sheets at its fair value, but the hedged asset or liability will no longer be adjusted for changes in fair value. In all other situations in which hedge accounting is discontinued, the derivative is carried at its fair value in the consolidated balance sheets, with changes in its fair value recognized in current period income.
We may enter into contracts that are not themselves derivative instruments but contain embedded derivatives. For each contract, we assess whether the economic characteristics of the embedded derivative are clearly and closely related to those of the host contract and determine whether a separate instrument with the same terms as the embedded instrument would meet the definition of a derivative instrument.
234
GENWORTH FINANCIAL, INC.
NOTES TO CONSOLIDATED FINANCIAL STATEMENTS
Years Ended December 31, 2013, 2012 and 2011
If it is determined that the embedded derivative possesses economic characteristics that are not clearly and closely related to the economic characteristics of the host contract, and that a separate instrument with the same terms would qualify as a derivative instrument, the embedded derivative is separated from the host contract and accounted for as a stand-alone derivative. Such embedded derivatives are recorded in the consolidated balance sheets at fair value and are classified consistent with their host contract. Changes in their fair value are recognized in current period income. If we are unable to properly identify and measure an embedded derivative for separation from its host contract, the entire contract is carried in the consolidated balance sheets at fair value, with changes in fair value recognized in current period income.
Changes in the fair value of non-qualifying derivatives, including embedded derivatives, changes in fair value of certain derivatives and related hedged items in fair value hedge relationships and hedge ineffectiveness on cash flow hedges are reported in net investment gains (losses).
o) Separate Accounts and Related Insurance Obligations
Separate account assets represent funds for which the investment income and investment gains and losses accrue directly to the contractholders and are reflected in our consolidated balance sheets at fair value, reported as summary total separate account assets with an equivalent summary total reported for liabilities. Amounts assessed against the contractholders for mortality, administrative and other services are included in revenues. Changes in liabilities for minimum guarantees are included in benefits and other changes in policy reserves. Net investment income, net investment gains (losses) and the related liability changes associated with the separate account are offset within the same line item in the consolidated statements of income. There were no gains or losses on transfers of assets from the general account to the separate account.
We offer certain minimum guarantees associated with our variable annuity contracts. Our variable annuity contracts usually contain a basic guaranteed minimum death benefit (“GMDB”) which provides a minimum benefit to be paid upon the annuitant’s death equal to the larger of account value and the return of net deposits. Some variable annuity contracts permit contractholders to purchase through riders, at an additional charge, enhanced death benefits such as the highest contract anniversary value (“ratchets”), accumulated net deposits at a stated rate (“rollups”), or combinations thereof.
Additionally, some of our variable annuity contracts provide the contractholder with living benefits such as a guaranteed minimum withdrawal benefit (“GMWB”) or certain types of guaranteed annuitization benefits. The GMWB allows contractholders to withdraw a pre-defined percentage of account value or benefit base each year, either for a specified period of time or for life. The guaranteed annuitization benefit generally provides for a guaranteed minimum level of income upon annuitization accompanied by the potential for upside market participation.
Most of our reserves for additional insurance and annuitization benefits are calculated by applying a benefit ratio to accumulated contractholder assessments, and then deducting accumulated paid claims. The benefit ratio is equal to the ratio of benefits to assessments, accumulated with interest and considering both past and anticipated future experience. The projections utilize stochastic scenarios of separate account returns incorporating reversion to the mean, as well as assumptions for mortality and lapses. Some of our minimum guarantees, mainly GMWBs, are accounted for as embedded derivatives; see notes 5 and 17 for additional information on these embedded derivatives and related fair value measurement disclosures.
235
GENWORTH FINANCIAL, INC.
NOTES TO CONSOLIDATED FINANCIAL STATEMENTS
Years Ended December 31, 2013, 2012 and 2011
p) Insurance Reserves
Future Policy Benefits
We include insurance-type contracts, such as traditional life insurance, in the liability for future policy benefits. Insurance-type contracts are broadly defined to include contracts with significant mortality and/or morbidity risk. The liability for future benefits of insurance contracts is the present value of such benefits less the present value of future net premiums based on mortality, morbidity and other assumptions, which are appropriate at the time the policies are issued or acquired. These assumptions are periodically evaluated for potential reserve deficiencies. For long-term care insurance products, benefit reductions are treated as partial lapse of coverage with the balance of our future policy benefits and deferred acquisition costs both reduced in proportion to the reduced coverage. For level premium term life insurance products, we floor the liability for future policy benefits on each policy at zero. Reserves for cancelable accident and health insurance are based upon unearned premiums, claims incurred but not reported and claims in the process of settlement. This estimate is based on our historical experience and that of the insurance industry, adjusted for current trends. Any changes in the estimated liability are reflected in income as the estimates are revised.
Policyholder Account Balances
We include investment-type contracts and our universal life insurance contracts in the liability for policyholder account balances. Investment-type contracts are broadly defined to include contracts without significant mortality or morbidity risk. Payments received from sales of investment contracts are recognized by providing a liability equal to the current account value of the policyholders’ contracts. Interest rates credited to investment contracts are guaranteed for the initial policy term with renewal rates determined as necessary by management.
q) Liability for Policy and Contract Claims
The liability for policy and contract claims represents the amount needed to provide for the estimated ultimate cost of settling claims relating to insured events that have occurred on or before the end of the respective reporting period. The estimated liability includes requirements for future payments of: (a) claims that have been reported to the insurer; (b) claims related to insured events that have occurred but that have not been reported to the insurer as of the date the liability is estimated; and (c) claim adjustment expenses. Claim adjustment expenses include costs incurred in the claim settlement process such as legal fees and costs to record, process and adjust claims.
For our mortgage insurance policies, reserves for losses and loss adjustment expenses are based on notices of mortgage loan defaults and estimates of defaults that have been incurred but have not been reported by loan servicers, using assumptions of claim rates for loans in default and the average amount paid for loans that result in a claim. As is common accounting practice in the mortgage insurance industry and in accordance with U.S. GAAP, we begin to provide for the ultimate claim payment relating to a potential claim on a defaulted loan when the status of that loan first goes delinquent. Over time, as the status of the underlying delinquent loans move toward foreclosure and the likelihood of the associated claim loss increases, the amount of the loss reserves associated with the potential claims may also increase.
Management considers the liability for policy and contract claims provided to be satisfactory to cover the losses that have occurred. Management monitors actual experience, and where circumstances warrant, will revise its assumptions. The methods of determining such estimates and establishing the reserves are reviewed
236
GENWORTH FINANCIAL, INC.
NOTES TO CONSOLIDATED FINANCIAL STATEMENTS
Years Ended December 31, 2013, 2012 and 2011
continuously and any adjustments are reflected in operations in the period in which they become known. Future developments may result in losses and loss expenses greater or less than the liability for policy and contract claims provided.
r) Unearned Premiums
For single premium insurance contracts, we recognize premiums over the policy life in accordance with the expected pattern of risk emergence. We recognize a portion of the revenue in premiums earned in the current period, while the remaining portion is deferred as unearned premiums and earned over time in accordance with the expected pattern of risk emergence. If single premium policies are cancelled and the premium is non-refundable, then the remaining unearned premium related to each cancelled policy is recognized to earned premiums upon notification of the cancellation. Expected pattern of risk emergence on which we base premium recognition is inherently judgmental and is based on actuarial analysis of historical experience. We periodically review our premium earnings recognition models with any adjustments to the estimates reflected in current period income. For the years ended December 31, 2013, 2012 and 2011, we updated our premium recognition factors for our international mortgage insurance business. These updates included the consideration of recent and projected loss experience, policy cancellation experience and refinement of actuarial methods. In 2013, 2012 and 2011, adjustments associated with this update resulted in an increase in earned premiums of $12 million, $36 million and $46 million, respectively.
s) Stock-Based Compensation
We determine a grant date fair value and recognize the related compensation expense, adjusted for expected forfeitures, through the income statement over the respective vesting period of the awards.
t) Employee Benefit Plans
We provide employees with a defined contribution pension plan and recognize expense throughout the year based on the employee’s age, service and eligible pay. We make an annual contribution to the plan. We also provide employees with defined contribution savings plans. We recognize expense for our contributions to the savings plans at the time employees make contributions to the plans.
Some employees participate in defined benefit pension and postretirement benefit plans. We recognize expense for these plans based upon actuarial valuations performed by external experts. We estimate aggregate benefits by using assumptions for employee turnover, future compensation increases, rates of return on pension plan assets and future health care costs. We recognize an expense for differences between actual experience and estimates over the average future service period of participants. We recognize the overfunded or underfunded status of a defined benefit plan as an asset or liability in our consolidated balance sheets and recognize changes in that funded status in the year in which the changes occur through OCI.
u) Income Taxes
We determine deferred tax assets and/or liabilities by multiplying the differences between the financial reporting and tax reporting bases for assets and liabilities by the enacted tax rates expected to be in effect when such differences are recovered or settled if there is no change in law. The effect on deferred taxes of a change in tax rates is recognized in income in the period that includes the enactment date. Valuation allowances on deferred tax assets are estimated based on our assessment of the realizability of such amounts.
237
GENWORTH FINANCIAL, INC.
NOTES TO CONSOLIDATED FINANCIAL STATEMENTS
Years Ended December 31, 2013, 2012 and 2011
Effective with the period beginning January 1, 2011, our companies elected to file a single U.S. consolidated income tax return (the “life/non-life consolidated return”). The election was made with the filing of the first life/non-life consolidated return, which was filed in September 2012. All companies domesticated in the United States and our Bermuda and Guernsey subsidiaries which have elected to be taxed as U.S. domestic companies were included in the life/non-life consolidated return as allowed by the tax law and regulations. The tax sharing agreement previously applicable only to the U.S. life insurance entities was terminated with the filing of the life/non-life consolidated return and those entities adopted the tax sharing agreement previously applicable to only the non-life entities (hereinafter the “life/non-life tax sharing agreement”). The two agreements were identical in all material respects. The life/non-life tax sharing agreement was provided to the appropriate state insurance regulators for approval. Intercompany balances relating to the impacts of the life/non-life tax sharing agreement were settled with the insurance companies after approval was received from the insurance regulators. Intercompany balances under all agreements are settled at least annually. For years before 2011, our U.S. non-life insurance entities were included in the consolidated federal income tax return of Genworth and subject to a tax sharing arrangement that allocated tax on a separate company basis but provided benefit for current utilization of losses and credits. Also, our U.S. life insurance entities filed a consolidated life insurance federal income tax return, and were subject to a separate tax sharing agreement, as approved by state insurance regulators, which allocated taxes on a separate company basis but provided benefit for current utilization of losses and credits.
Our subsidiaries based in Bermuda and Guernsey are treated as U.S. insurance companies under provisions of the U.S. Internal Revenue Code, are included in the life/non-life consolidated return, and have adopted the life/non-life tax sharing agreement. Jurisdictions outside the United States in which our various subsidiaries incur significant taxes include Australia, Canada and the United Kingdom.
v) Foreign Currency Translation
The determination of the functional currency is made based on the appropriate economic and management indicators. The assets and liabilities of foreign operations are translated into U.S. dollars at the exchange rates in effect at the balance sheet date. Translation adjustments are included as a separate component of accumulated other comprehensive income (loss). Revenues and expenses of the foreign operations are translated into U.S. dollars at the average rates of exchange during the period of the transaction. Gains and losses from foreign currency transactions are reported in income and have not been material in any years presented in our consolidated statements of income.
w) Variable Interest Entities
We are involved in certain entities that are considered VIEs as defined under U.S. GAAP, and, accordingly, we evaluate the VIE to determine whether we are the primary beneficiary and are required to consolidate the assets and liabilities of the entity. The primary beneficiary of a VIE is the enterprise that has the power to direct the activities of a VIE that most significantly impacts the VIE’s economic performance and has the obligation to absorb losses or receive benefits that could potentially be significant to the VIE. The determination of the primary beneficiary for a VIE can be complex and requires management judgment regarding the expected results of the entity and how those results are absorbed by beneficial interest holders, as well as which party has the power to direct activities that most significantly impact the performance of the VIEs.
Our primary involvement related to VIEs includes securitization transactions, certain investments and certain mortgage insurance policies.
238
GENWORTH FINANCIAL, INC.
NOTES TO CONSOLIDATED FINANCIAL STATEMENTS
Years Ended December 31, 2013, 2012 and 2011
We have retained interests in VIEs where we are the servicer and transferor of certain assets that were sold to a newly created VIE. Additionally, for certain securitization transactions, we were the transferor of certain assets that were sold to a newly created VIE but did not retain any beneficial interest in the VIE other than acting as the servicer of the underlying assets.
We hold investments in certain structures that are considered VIEs. Our investments represent beneficial interests that are primarily in the form of structured securities or alternative investments. Our involvement in these structures typically represent a passive investment in the returns generated by the VIE and typically do not result in having significant influence over the economic performance of the VIE.
We also provide mortgage insurance on certain residential mortgage loans originated and securitized by third parties using VIEs to issue mortgage-backed securities. While we provide mortgage insurance on the underlying loans, we do not typically have any ongoing involvement with the VIE other than our mortgage insurance coverage and do not act in a servicing capacity for the underlying loans held by the VIE.
See note 18 for additional information related to these consolidated entities.
x) Accounting Changes
Benchmarking Interest Rates Used When Applying Hedge Accounting
On July 17, 2013, we adopted new accounting guidance to provide additional flexibility in the benchmark interest rates used when applying hedge accounting. The new guidance permits the use of the Federal Funds Effective Swap Rate as a benchmark interest rate for hedge accounting purposes and removes certain restrictions on being able to apply hedge accounting for similar hedges using different benchmark interest rates. The adoption of this accounting guidance did not have a material impact on our consolidated financial statements.
Offsetting Assets And Liabilities
On January 1, 2013, we adopted new accounting guidance for disclosures about offsetting assets and liabilities. This guidance requires an entity to disclose information about offsetting and related arrangements to enable users to understand the effect of those arrangements on its financial position. The adoption of this accounting guidance impacted our disclosures only and did not impact our consolidated results.
Reclassification Of Items Out Of Accumulated Other Comprehensive Income
On January 1, 2013, we adopted new accounting guidance related to the presentation of the reclassification of items out of accumulated other comprehensive income into net income. The adoption of this accounting guidance impacted our disclosures only and did not impact our consolidated results.
Testing Indefinite-Lived Intangible Assets For Impairment
In July 2012, the Financial Accounting Standards Board (the “FASB”) issued new accounting guidance on testing indefinite-lived intangible assets for impairment. The new guidance permits the use of a qualitative assessment prior to, and potentially instead of, the quantitative impairment test for indefinite-lived intangible assets. We elected to early adopt this new accounting guidance effective October 1, 2012. The adoption of this accounting guidance did not have an impact on our consolidated financial statements.
239
GENWORTH FINANCIAL, INC.
NOTES TO CONSOLIDATED FINANCIAL STATEMENTS
Years Ended December 31, 2013, 2012 and 2011
Fair Value Measurements
On January 1, 2012, we adopted new accounting guidance related to fair value measurements. This new accounting guidance clarified existing fair value measurement requirements and changed certain fair value measurement principles and disclosure requirements. The adoption of this accounting guidance impacted our disclosures only and did not impact our consolidated results.
Repurchase Agreements and Other Agreements
On January 1, 2012, we adopted new accounting guidance related to repurchase agreements and other agreements that both entitle and obligate a transferor to repurchase or redeem financial assets before their maturity. The new guidance removed the requirement to consider a transferor’s ability to fulfill its contractual rights from the criteria used to determine effective control and was effective for us prospectively for any transactions occurring on or after January 1, 2012. The adoption of this accounting guidance did not have a material impact on our consolidated financial statements.
Testing Goodwill For Impairment
In September 2011, the FASB issued new accounting guidance related to goodwill impairment testing. The new guidance permits the use of a qualitative assessment prior to, and potentially instead of, the two step quantitative goodwill impairment test. We elected to early adopt this new guidance effective on July 1, 2011 in order to apply the new guidance in our annual goodwill impairment testing performed during the third quarter. The adoption of this new accounting guidance did not have an impact on our consolidated financial statements.
A Creditor’s Determination of Whether a Restructuring Is a Troubled Debt Restructuring
On July 1, 2011, we adopted new accounting guidance related to additional disclosures for troubled debt restructurings. The adoption of this new accounting guidance did not have a material impact on our consolidated financial statements.
When to Perform Step 2 of the Goodwill Impairment Test For Reporting Units With Zero or Negative Carrying Value
On January 1, 2011, we adopted new accounting guidance related to goodwill impairment testing when a reporting unit’s carrying value is zero or negative. This guidance did not impact our consolidated financial statements upon adoption, as all of our reporting units with goodwill balances have positive carrying values.
How Investments Held Through Separate Accounts Affect an Insurer’s Consolidation Analysis of Those Investments
On January 1, 2011, we adopted new accounting guidance related to how investments held through separate accounts affect an insurer’s consolidation analysis of those investments. The adoption of this new accounting guidance did not have a material impact on our consolidated financial statements.
Fair Value Measurements and Disclosures—Improving Disclosures about Fair Value Measurements
On January 1, 2011, we adopted new accounting guidance related to additional disclosures about purchases, sales, issuances and settlements in the rollforward of Level 3 fair value measurements. The adoption of this accounting guidance impacted our disclosures only and did not impact our consolidated results.
240
GENWORTH FINANCIAL, INC.
NOTES TO CONSOLIDATED FINANCIAL STATEMENTS
Years Ended December 31, 2013, 2012 and 2011
y) Accounting Pronouncements Not Yet Adopted
In January 2014, the FASB issued new accounting guidance related to the accounting for investments in affordable housing projects that qualify for the low-income housing tax credit. The new guidance permits reporting entities to make an accounting policy election to account for investments in qualified affordable housing projects by amortizing the initial cost of the investment in proportion to the tax benefits received and recognize the net investment performance as a component of income tax expense (called the proportional amortization method) if certain conditions are met. The new guidance requires use of the equity method or cost method for investments in qualified affordable housing projects not accounted for using the proportional amortization method. This new guidance will be effective for us on January 1, 2015 with early adoption permitted. We have not yet determined whether this new guidance will have a material impact on our consolidated financial statements.
In June 2013, the FASB issued new accounting guidance on the scope, measurement and disclosure requirements for investment companies. The new guidance clarifies the characteristics of an investment company, provides comprehensive guidance for assessing whether an entity is an investment company, requires investment companies to measure noncontrolling ownership interest in other investment companies at fair value rather than using the equity method of accounting and requires additional disclosures. These new requirements will be effective for us on January 1, 2014 and are not expected to have a material impact on our consolidated financial statements.
241
GENWORTH FINANCIAL, INC.
NOTES TO CONSOLIDATED FINANCIAL STATEMENTS
Years Ended December 31, 2013, 2012 and 2011
Basic and diluted earnings per share are calculated by dividing each income category presented below by the weighted-average basic and diluted shares outstanding for the periods indicated:
| (Amounts in millions, except per share amounts) |
2013 | 2012 | 2011 | |||||||||
| Weighted-average shares used in basic earnings per common share calculations |
493.6 | 491.6 | 490.6 | |||||||||
| Potentially dilutive securities: |
||||||||||||
| Stock options, restricted stock units and stock appreciation rights |
5.1 | 2.8 | 2.9 | |||||||||
|
|
|
|
|
|
|
|||||||
| Weighted-average shares used in diluted earnings per common share calculations |
498.7 | 494.4 | 493.5 | |||||||||
|
|
|
|
|
|
|
|||||||
| Income from continuing operations: |
||||||||||||
| Income from continuing operations |
$ | 726 | $ | 468 | $ | 141 | ||||||
| Less: income from continuing operations attributable to noncontrolling interests |
154 | 200 | 139 | |||||||||
|
|
|
|
|
|
|
|||||||
| Income from continuing operations available to Genworth Financial, Inc.’s |
$ | 572 | $ | 268 | $ | 2 | ||||||
|
|
|
|
|
|
|
|||||||
| Basic per common share |
$ | 1.16 | $ | 0.55 | $ | — | ||||||
|
|
|
|
|
|
|
|||||||
| Diluted per common share |
$ | 1.15 | $ | 0.54 | $ | — | ||||||
|
|
|
|
|
|
|
|||||||
| Income (loss) from discontinued operations: |
||||||||||||
| Income (loss) from discontinued operations, net of taxes |
$ | (12 | ) | $ | 57 | $ | 36 | |||||
| Less: income from discontinued operations, net of taxes, attributable to noncontrolling interests |
— | — | — | |||||||||
|
|
|
|
|
|
|
|||||||
| Income (loss) from discontinued operations, net of taxes, available to Genworth Financial, Inc.’s common stockholders |
$ | (12 | ) | $ | 57 | $ | 36 | |||||
|
|
|
|
|
|
|
|||||||
| Basic per common share |
$ | (0.02 | ) | $ | 0.12 | $ | 0.07 | |||||
|
|
|
|
|
|
|
|||||||
| Diluted per common share |
$ | (0.02 | ) | $ | 0.12 | $ | 0.07 | |||||
|
|
|
|
|
|
|
|||||||
| Net income: |
||||||||||||
| Income from continuing operations |
$ | 726 | $ | 468 | $ | 141 | ||||||
| Income (loss) from discontinued operations, net of taxes |
(12 | ) | 57 | 36 | ||||||||
|
|
|
|
|
|
|
|||||||
| Net income |
714 | 525 | 177 | |||||||||
| Less: net income attributable to noncontrolling interests |
154 | 200 | 139 | |||||||||
|
|
|
|
|
|
|
|||||||
| Net income available to Genworth Financial, Inc.’s common stockholders |
$ | 560 | $ | 325 | $ | 38 | ||||||
|
|
|
|
|
|
|
|||||||
| Basic per common share |
$ | 1.13 | $ | 0.66 | $ | 0.08 | ||||||
|
|
|
|
|
|
|
|||||||
| Diluted per common share |
$ | 1.12 | $ | 0.66 | $ | 0.08 | ||||||
|
|
|
|
|
|
|
|||||||
242
GENWORTH FINANCIAL, INC.
NOTES TO CONSOLIDATED FINANCIAL STATEMENTS
Years Ended December 31, 2013, 2012 and 2011
(a) Net Investment Income
Sources of net investment income were as follows for the years ended December 31:
| (Amounts in millions) |
2013 | 2012 | 2011 | |||||||||
| Fixed maturity securities—taxable |
$ | 2,642 | $ | 2,666 | $ | 2,697 | ||||||
| Fixed maturity securities—non-taxable |
9 | 11 | 35 | |||||||||
| Commercial mortgage loans |
335 | 340 | 365 | |||||||||
| Restricted commercial mortgage loans related to securitization entities (1) |
23 | 32 | 40 | |||||||||
| Equity securities |
17 | 19 | 19 | |||||||||
| Other invested assets (2) |
185 | 206 | 162 | |||||||||
| Restricted other invested assets related to securitization entities (1) |
4 | 1 | — | |||||||||
| Policy loans |
129 | 123 | 120 | |||||||||
| Cash, cash equivalents and short-term investments |
20 | 35 | 37 | |||||||||
|
|
|
|
|
|
|
|||||||
| Gross investment income before expenses and fees |
3,364 | 3,433 | 3,475 | |||||||||
| Expenses and fees |
(93 | ) | (90 | ) | (95 | ) | ||||||
|
|
|
|
|
|
|
|||||||
| Net investment income |
$ | 3,271 | $ | 3,343 | $ | 3,380 | ||||||
|
|
|
|
|
|
|
|||||||
| (1) | See note 18 for additional information related to consolidated securitization entities. |
| (2) | Included in other invested assets was $13 million, $21 million and $15 million of net investment income related to trading securities for the years ended December 31, 2013, 2012 and 2011, respectively. |
243
GENWORTH FINANCIAL, INC.
NOTES TO CONSOLIDATED FINANCIAL STATEMENTS
Years Ended December 31, 2013, 2012 and 2011
(b) Net Investment Gains (Losses)
The following table sets forth net investment gains (losses) for the years ended December 31:
| (Amounts in millions) |
2013 | 2012 | 2011 | |||||||||
| Available-for-sale securities: |
||||||||||||
| Realized gains |
$ | 176 | $ | 172 | $ | 210 | ||||||
| Realized losses |
(184 | ) | (143 | ) | (160 | ) | ||||||
|
|
|
|
|
|
|
|||||||
| Net realized gains (losses) on available-for-sale securities |
(8 | ) | 29 | 50 | ||||||||
|
|
|
|
|
|
|
|||||||
| Impairments: |
||||||||||||
| Total other-than-temporary impairments |
(16 | ) | (62 | ) | (118 | ) | ||||||
| Portion of other-than-temporary impairments included in other comprehensive income (loss) |
(9 | ) | (44 | ) | (14 | ) | ||||||
|
|
|
|
|
|
|
|||||||
| Net other-than-temporary impairments |
(25 | ) | (106 | ) | (132 | ) | ||||||
|
|
|
|
|
|
|
|||||||
| Trading securities |
(23 | ) | 21 | 27 | ||||||||
| Commercial mortgage loans |
4 | 4 | 6 | |||||||||
| Net gains (losses) related to securitization entities (1) |
69 | 81 | (47 | ) | ||||||||
| Derivative instruments (2) |
(49 | ) | 4 | (99 | ) | |||||||
| Contingent consideration adjustment |
— | (6 | ) | — | ||||||||
| Other |
(5 | ) | — | — | ||||||||
|
|
|
|
|
|
|
|||||||
| Net investment gains (losses) |
$ | (37 | ) | $ | 27 | $ | (195 | ) | ||||
|
|
|
|
|
|
|
|||||||
| (1) | See note 18 for additional information related to consolidated securitization entities. |
| (2) | See note 5 for additional information on the impact of derivative instruments included in net investment gains (losses). |
We generally intend to hold securities in unrealized loss positions until they recover. However, from time to time, our intent on an individual security may change, based upon market or other unforeseen developments. In such instances, we sell securities in the ordinary course of managing our portfolio to meet diversification, credit quality, yield and liquidity requirements. If a loss is recognized from a sale subsequent to a balance sheet date due to these unexpected developments, the loss is recognized in the period in which we determined that we have the intent to sell the securities or it is more likely than not that we will be required to sell the securities prior to recovery. The aggregate fair value of securities sold at a loss during the years ended December 31, 2013, 2012 and 2011 was $1,794 million, $1,491 million and $1,884 million, respectively, which was approximately 91%, 92% and 93%, respectively, of book value.
244
GENWORTH FINANCIAL, INC.
NOTES TO CONSOLIDATED FINANCIAL STATEMENTS
Years Ended December 31, 2013, 2012 and 2011
The following represents the activity for credit losses recognized in net income on debt securities where an other-than-temporary impairment was identified and a portion of other-than-temporary impairments was included in OCI as of and for the years ended December 31:
| (Amounts in millions) |
2013 | 2012 | 2011 | |||||||||
| Beginning balance |
$ | 387 | $ | 646 | $ | 784 | ||||||
| Additions: |
||||||||||||
| Other-than-temporary impairments not previously recognized |
4 | 16 | 39 | |||||||||
| Increases related to other-than-temporary impairments previously recognized |
11 | 55 | 82 | |||||||||
| Reductions: |
||||||||||||
| Securities sold, paid down or disposed |
(301 | ) | (330 | ) | (259 | ) | ||||||
|
|
|
|
|
|
|
|||||||
| Ending balance |
$ | 101 | $ | 387 | $ | 646 | ||||||
|
|
|
|
|
|
|
|||||||
(c) Unrealized Investment Gains and Losses
Net unrealized gains and losses on available-for-sale investment securities reflected as a separate component of accumulated other comprehensive income (loss) were as follows as of December 31:
| (Amounts in millions) |
2013 | 2012 | 2011 | |||||||||
| Net unrealized gains (losses) on investment securities: |
||||||||||||
| Fixed maturity securities |
$ | 2,346 | $ | 6,086 | $ | 3,742 | ||||||
| Equity securities |
23 | 34 | 5 | |||||||||
| Other invested assets |
(4 | ) | (8 | ) | (30 | ) | ||||||
|
|
|
|
|
|
|
|||||||
| Subtotal |
2,365 | 6,112 | 3,717 | |||||||||
| Adjustments to DAC, PVFP, sales inducements and benefit reserves |
(869 | ) | (1,925 | ) | (1,303 | ) | ||||||
| Income taxes, net |
(517 | ) | (1,457 | ) | (840 | ) | ||||||
|
|
|
|
|
|
|
|||||||
| Net unrealized investment gains (losses) |
979 | 2,730 | 1,574 | |||||||||
| Less: net unrealized investment gains (losses) attributable to noncontrolling interests |
53 | 92 | 89 | |||||||||
|
|
|
|
|
|
|
|||||||
| Net unrealized investment gains (losses) attributable to Genworth Financial, Inc. |
$ | 926 | $ | 2,638 | $ | 1,485 | ||||||
|
|
|
|
|
|
|
|||||||
245
GENWORTH FINANCIAL, INC.
NOTES TO CONSOLIDATED FINANCIAL STATEMENTS
Years Ended December 31, 2013, 2012 and 2011
The change in net unrealized gains (losses) on available-for-sale investment securities reported in accumulated other comprehensive income (loss) was as follows as of and for the years ended December 31:
| (Amounts in millions) |
2013 | 2012 | 2011 | |||||||||
| Beginning balance |
$ | 2,638 | $ | 1,485 | $ | (80 | ) | |||||
| Unrealized gains (losses) arising during the period: |
||||||||||||
| Unrealized gains (losses) on investment securities |
(3,780 | ) | 2,318 | 3,137 | ||||||||
| Adjustment to DAC |
248 | (159 | ) | (101 | ) | |||||||
| Adjustment to PVFP |
95 | (6 | ) | (86 | ) | |||||||
| Adjustment to sales inducements |
40 | (33 | ) | (3 | ) | |||||||
| Adjustment to benefit reserves |
673 | (424 | ) | (560 | ) | |||||||
| Provision for income taxes |
952 | (590 | ) | (836 | ) | |||||||
|
|
|
|
|
|
|
|||||||
| Change in unrealized gains (losses) on investment securities |
(1,772 | ) | 1,106 | 1,551 | ||||||||
| Reclassification adjustments to net investment (gains) losses, net of taxes of $(12), $(27) and $(29) |
21 | 50 | 53 | |||||||||
|
|
|
|
|
|
|
|||||||
| Change in net unrealized investment gains (losses) |
(1,751 | ) | 1,156 | 1,604 | ||||||||
| Less: change in net unrealized investment gains (losses) attributable to noncontrolling interests |
(39 | ) | 3 | 39 | ||||||||
|
|
|
|
|
|
|
|||||||
| Ending balance |
$ | 926 | $ | 2,638 | $ | 1,485 | ||||||
|
|
|
|
|
|
|
|||||||
(d) Fixed Maturity and Equity Securities
As of December 31, 2013, the amortized cost or cost, gross unrealized gains (losses) and fair value of our fixed maturity and equity securities classified as available-for-sale were as follows:
| Gross unrealized gains | Gross unrealized losses | |||||||||||||||||||||||
| (Amounts in millions) |
Amortized |
Not other-than- temporarily impaired |
Other-than- temporarily impaired |
Not other-than- temporarily impaired |
Other-than- temporarily impaired |
Fair value |
||||||||||||||||||
| Fixed maturity securities: |
||||||||||||||||||||||||
| U.S. government, agencies and government-sponsored enterprises |
$ | 4,710 | $ | 331 | $ | — | $ | (231 | ) | $ | — | $ | 4,810 | |||||||||||
| Tax-exempt |
324 | 7 | — | (36 | ) | — | 295 | |||||||||||||||||
| Government—non-U.S. |
2,057 | 104 | — | (15 | ) | — | 2,146 | |||||||||||||||||
| U.S. corporate |
23,614 | 1,761 | 19 | (359 | ) | — | 25,035 | |||||||||||||||||
| Corporate—non-U.S. |
14,489 | 738 | — | (156 | ) | — | 15,071 | |||||||||||||||||
| Residential mortgage-backed |
5,058 | 232 | 9 | (70 | ) | (4 | ) | 5,225 | ||||||||||||||||
| Commercial mortgage-backed |
2,886 | 75 | 2 | (62 | ) | (3 | ) | 2,898 | ||||||||||||||||
| Other asset-backed |
3,171 | 35 | — | (57 | ) | — | 3,149 | |||||||||||||||||
|
|
|
|
|
|
|
|
|
|
|
|
|
|||||||||||||
| Total fixed maturity securities |
56,309 | 3,283 | 30 | (986 | ) | (7 | ) | 58,629 | ||||||||||||||||
| Equity securities |
318 | 36 | — | (13 | ) | — | 341 | |||||||||||||||||
|
|
|
|
|
|
|
|
|
|
|
|
|
|||||||||||||
| Total available-for-sale securities |
$ | 56,627 | $ | 3,319 | $ | 30 | $ | (999 | ) | $ | (7 | ) | $ | 58,970 | ||||||||||
|
|
|
|
|
|
|
|
|
|
|
|
|
|||||||||||||
246
GENWORTH FINANCIAL, INC.
NOTES TO CONSOLIDATED FINANCIAL STATEMENTS
Years Ended December 31, 2013, 2012 and 2011
As of December 31, 2012, the amortized cost or cost, gross unrealized gains (losses) and fair value of our fixed maturity and equity securities classified as available-for-sale were as follows:
| Gross unrealized gains | Gross unrealized losses | |||||||||||||||||||||||
| (Amounts in millions) |
Amortized cost or cost |
Not other-than- temporarily impaired |
Other-than- temporarily impaired |
Not other-than- temporarily impaired |
Other-than- temporarily impaired |
Fair value |
||||||||||||||||||
| Fixed maturity securities: |
||||||||||||||||||||||||
| U.S. government, agencies and government-sponsored enterprises |
$ | 4,484 | $ | 1,025 | $ | — | $ | (18 | ) | $ | — | $ | 5,491 | |||||||||||
| Tax-exempt |
308 | 16 | — | (30 | ) | — | 294 | |||||||||||||||||
| Government—non-U.S. |
2,173 | 250 | — | (1 | ) | — | 2,422 | |||||||||||||||||
| U.S. corporate |
22,873 | 3,317 | 19 | (104 | ) | — | 26,105 | |||||||||||||||||
| Corporate—non-U.S. |
14,577 | 1,262 | — | (47 | ) | — | 15,792 | |||||||||||||||||
| Residential mortgage-backed |
5,744 | 549 | 13 | (124 | ) | (101 | ) | 6,081 | ||||||||||||||||
| Commercial mortgage-backed |
3,253 | 178 | 5 | (82 | ) | (21 | ) | 3,333 | ||||||||||||||||
| Other asset-backed |
2,660 | 50 | — | (65 | ) | (2 | ) | 2,643 | ||||||||||||||||
|
|
|
|
|
|
|
|
|
|
|
|
|
|||||||||||||
| Total fixed maturity securities |
56,072 | 6,647 | 37 | (471 | ) | (124 | ) | 62,161 | ||||||||||||||||
| Equity securities |
483 | 41 | — | (6 | ) | — | 518 | |||||||||||||||||
|
|
|
|
|
|
|
|
|
|
|
|
|
|||||||||||||
| Total available-for-sale securities |
$ | 56,555 | $ | 6,688 | $ | 37 | $ | (477 | ) | $ | (124 | ) | $ | 62,679 | ||||||||||
|
|
|
|
|
|
|
|
|
|
|
|
|
|||||||||||||
247
GENWORTH FINANCIAL, INC.
NOTES TO CONSOLIDATED FINANCIAL STATEMENTS
Years Ended December 31, 2013, 2012 and 2011
The following table presents the gross unrealized losses and fair values of our investment securities, aggregated by investment type and length of time that individual investment securities have been in a continuous unrealized loss position, as of December 31, 2013:
| Less than 12 months | 12 months or more | Total | ||||||||||||||||||||||||||||||||||
| (Dollar amounts in millions) |
Fair value |
Gross unrealized losses |
Number of securities |
Fair value |
Gross unrealized losses (1) |
Number of securities |
Fair value |
Gross unrealized losses (1) |
Number of securities |
|||||||||||||||||||||||||||
| Description of Securities |
||||||||||||||||||||||||||||||||||||
| Fixed maturity securities: |
||||||||||||||||||||||||||||||||||||
| U.S. government, agencies and government-sponsored enterprises |
$ | 796 | $ | (109 | ) | 32 | $ | 335 | $ | (122 | ) | 13 | $ | 1,131 | $ | (231 | ) | 45 | ||||||||||||||||||
| Tax-exempt |
82 | (3 | ) | 26 | 97 | (33 | ) | 9 | 179 | (36 | ) | 35 | ||||||||||||||||||||||||
| Government—non-U.S. |
479 | (15 | ) | 60 | — | — | — | 479 | (15 | ) | 60 | |||||||||||||||||||||||||
| U.S. corporate |
4,774 | (260 | ) | 707 | 663 | (99 | ) | 82 | 5,437 | (359 | ) | 789 | ||||||||||||||||||||||||
| Corporate—non-U.S. |
3,005 | (127 | ) | 379 | 287 | (29 | ) | 34 | 3,292 | (156 | ) | 413 | ||||||||||||||||||||||||
| Residential mortgage-backed |
1,052 | (55 | ) | 139 | 157 | (19 | ) | 92 | 1,209 | (74 | ) | 231 | ||||||||||||||||||||||||
| Commercial mortgage-backed |
967 | (42 | ) | 107 | 370 | (23 | ) | 62 | 1,337 | (65 | ) | 169 | ||||||||||||||||||||||||
| Other asset-backed |
1,089 | (17 | ) | 133 | 145 | (40 | ) | 17 | 1,234 | (57 | ) | 150 | ||||||||||||||||||||||||
|
|
|
|
|
|
|
|
|
|
|
|
|
|
|
|
|
|
|
|||||||||||||||||||
| Subtotal, fixed maturity securities |
12,244 | (628 | ) | 1,583 | 2,054 | (365 | ) | 309 | 14,298 | (993 | ) | 1,892 | ||||||||||||||||||||||||
| Equity securities |
95 | (13 | ) | 41 | — | — | — | 95 | (13 | ) | 41 | |||||||||||||||||||||||||
|
|
|
|
|
|
|
|
|
|
|
|
|
|
|
|
|
|
|
|||||||||||||||||||
| Total for securities in an unrealized loss position |
$ | 12,339 | $ | (641 | ) | 1,624 | $ | 2,054 | $ | (365 | ) | 309 | $ | 14,393 | $ | (1,006 | ) | 1,933 | ||||||||||||||||||
|
|
|
|
|
|
|
|
|
|
|
|
|
|
|
|
|
|
|
|||||||||||||||||||
| % Below cost—fixed maturity securities: |
||||||||||||||||||||||||||||||||||||
| <20% Below cost |
$ | 12,009 | $ | (547 | ) | 1,571 | $ | 1,575 | $ | (163 | ) | 238 | $ | 13,584 | $ | (710 | ) | 1,809 | ||||||||||||||||||
| 20%-50% Below cost |
235 | (81 | ) | 12 | 466 | (187 | ) | 51 | 701 | (268 | ) | 63 | ||||||||||||||||||||||||
| >50% Below cost |
— | — | — | 13 | (15 | ) | 20 | 13 | (15 | ) | 20 | |||||||||||||||||||||||||
|
|
|
|
|
|
|
|
|
|
|
|
|
|
|
|
|
|
|
|||||||||||||||||||
| Total fixed maturity securities |
12,244 | (628 | ) | 1,583 | 2,054 | (365 | ) | 309 | 14,298 | (993 | ) | 1,892 | ||||||||||||||||||||||||
|
|
|
|
|
|
|
|
|
|
|
|
|
|
|
|
|
|
|
|||||||||||||||||||
| % Below cost—equity securities: |
||||||||||||||||||||||||||||||||||||
| <20% Below cost |
87 | (11 | ) | 40 | — | — | — | 87 | (11 | ) | 40 | |||||||||||||||||||||||||
| 20%-50% Below cost |
8 | (2 | ) | 1 | — | — | — | 8 | (2 | ) | 1 | |||||||||||||||||||||||||
|
|
|
|
|
|
|
|
|
|
|
|
|
|
|
|
|
|
|
|||||||||||||||||||
| Total equity securities |
95 | (13 | ) | 41 | — | — | — | 95 | (13 | ) | 41 | |||||||||||||||||||||||||
|
|
|
|
|
|
|
|
|
|
|
|
|
|
|
|
|
|
|
|||||||||||||||||||
| Total for securities in an unrealized loss position |
$ | 12,339 | $ | (641 | ) | 1,624 | $ | 2,054 | $ | (365 | ) | 309 | $ | 14,393 | $ | (1,006 | ) | 1,933 | ||||||||||||||||||
|
|
|
|
|
|
|
|
|
|
|
|
|
|
|
|
|
|
|
|||||||||||||||||||
| Investment grade |
$ | 11,896 | $ | (616 | ) | 1,515 | $ | 1,631 | $ | (315 | ) | 208 | $ | 13,527 | $ | (931 | ) | 1,723 | ||||||||||||||||||
| Below investment grade (2) |
443 | (25 | ) | 109 | 423 | (50 | ) | 101 | 866 | (75 | ) | 210 | ||||||||||||||||||||||||
|
|
|
|
|
|
|
|
|
|
|
|
|
|
|
|
|
|
|
|||||||||||||||||||
| Total for securities in an unrealized loss position |
$ | 12,339 | $ | (641 | ) | 1,624 | $ | 2,054 | $ | (365 | ) | 309 | $ | 14,393 | $ | (1,006 | ) | 1,933 | ||||||||||||||||||
|
|
|
|
|
|
|
|
|
|
|
|
|
|
|
|
|
|
|
|||||||||||||||||||
| (1) | Amounts included $7 million of unrealized losses on other-than-temporarily impaired securities. |
| (2) | Amounts that have been in a continuous loss position for 12 months or more included $7 million of unrealized losses on other-than-temporarily impaired securities. |
As indicated in the table above, the majority of the securities in a continuous unrealized loss position for less than 12 months were investment grade and less than 20% below cost. These unrealized losses were primarily attributable to lower credit ratings since acquisition for corporate securities across various industry sectors. For securities that have been in a continuous unrealized loss for less than 12 months, the average fair value percentage below cost was approximately 5% as of December 31, 2013.
248
GENWORTH FINANCIAL, INC.
NOTES TO CONSOLIDATED FINANCIAL STATEMENTS
Years Ended December 31, 2013, 2012 and 2011
Fixed Maturity Securities In A Continuous Unrealized Loss Position For 12 Months Or More
Of the $163 million of unrealized losses on fixed maturity securities in a continuous unrealized loss for 12 months or more that were less than 20% below cost, the weighted-average rating was “BBB+” and approximately 81% of the unrealized losses were related to investment grade securities as of December 31, 2013. These unrealized losses were attributable to the lower credit ratings for these securities since acquisition, primarily associated with structured securities and corporate securities in the finance and insurance sector. The average fair value percentage below cost for these securities was approximately 9% as of December 31, 2013. See below for additional discussion related to fixed maturity securities that have been in a continuous loss position for 12 months or more with a fair value that was more than 20% below cost.
The following tables present the concentration of gross unrealized losses and fair values of fixed maturity securities that were more than 20% below cost and in a continuous loss position for 12 months or more by asset class as of December 31, 2013:
| Investment Grade | ||||||||||||||||||||||||||||||||
| 20% to 50% | Greater than 50% | |||||||||||||||||||||||||||||||
| (Dollar amounts in millions) |
Fair value |
Gross unrealized losses |
% of
total gross unrealized losses |
Number of securities |
Fair value |
Gross unrealized losses |
% of
total Gross unrealized losses |
Number of securities |
||||||||||||||||||||||||
| Fixed maturity securities: |
||||||||||||||||||||||||||||||||
| U.S. government, agencies and government-sponsored enterprises |
$ | 264 | $ | (106 | ) | 11 | % | 10 | $ | — | $ | — | — | % | — | |||||||||||||||||
| Tax-exempt |
67 | (26 | ) | 3 | 7 | — | — | — | — | |||||||||||||||||||||||
| U.S. corporate |
30 | (9 | ) | 1 | 3 | — | — | — | — | |||||||||||||||||||||||
| Corporate—non-U.S. |
20 | (7 | ) | 1 | 4 | — | — | — | — | |||||||||||||||||||||||
| Structured securities: |
||||||||||||||||||||||||||||||||
| Residential mortgage-backed |
6 | (3 | ) | — | 4 | 3 | (3 | ) | — | 6 | ||||||||||||||||||||||
| Other asset-backed |
60 | (29 | ) | 3 | 5 | — | — | — | — | |||||||||||||||||||||||
|
|
|
|
|
|
|
|
|
|
|
|
|
|
|
|
|
|||||||||||||||||
| Total structured securities |
66 | (32 | ) | 3 | 9 | 3 | (3 | ) | — | 6 | ||||||||||||||||||||||
|
|
|
|
|
|
|
|
|
|
|
|
|
|
|
|
|
|||||||||||||||||
| Total |
$ | 447 | $ | (180 | ) | 19 | % | 33 | $ | 3 | $ | (3 | ) | — | % | 6 | ||||||||||||||||
|
|
|
|
|
|
|
|
|
|
|
|
|
|
|
|
|
|||||||||||||||||
| Below Investment Grade | ||||||||||||||||||||||||||||||||
| 20% to 50% | Greater than 50% | |||||||||||||||||||||||||||||||
| (Dollar amounts in millions) |
Fair value |
Gross unrealized losses |
% of
total gross unrealized losses |
Number of securities |
Fair value |
Gross unrealized losses |
% of
total Gross unrealized losses |
Number of securities |
||||||||||||||||||||||||
| Fixed maturity securities: |
| |||||||||||||||||||||||||||||||
| Structured securities: |
||||||||||||||||||||||||||||||||
| Residential mortgage-backed |
$ | 4 | $ | (2 | ) | — | % | 13 | $ | 2 | $ | (4 | ) | — | % | 12 | ||||||||||||||||
| Commercial mortgage-backed |
15 | (5 | ) | — | 5 | 1 | (1 | ) | — | 1 | ||||||||||||||||||||||
| Other asset-backed |
— | — | — | — | 7 | (7 | ) | 1 | 1 | |||||||||||||||||||||||
|
|
|
|
|
|
|
|
|
|
|
|
|
|
|
|
|
|||||||||||||||||
| Total structured securities |
19 | (7 | ) | — | 18 | 10 | (12 | ) | 1 | 14 | ||||||||||||||||||||||
|
|
|
|
|
|
|
|
|
|
|
|
|
|
|
|
|
|||||||||||||||||
| Total |
$ | 19 | $ | (7 | ) | — | % | 18 | $ | 10 | $ | (12 | ) | 1 | % | 14 | ||||||||||||||||
|
|
|
|
|
|
|
|
|
|
|
|
|
|
|
|
|
|||||||||||||||||
For all securities in an unrealized loss position, we expect to recover the amortized cost based on our estimate of cash flows to be collected. We do not intend to sell and it is not more likely than not that we will be required to sell these securities prior to recovering our amortized cost. See the following for further discussion of gross unrealized losses by asset class.
249
GENWORTH FINANCIAL, INC.
NOTES TO CONSOLIDATED FINANCIAL STATEMENTS
Years Ended December 31, 2013, 2012 and 2011
U. S. government, agencies and government-sponsored enterprises
As indicated in the table above, $106 million of gross unrealized losses were related to U.S. government, agencies and government-sponsored enterprises securities that have been in a continuous loss position for more than 12 months and were greater than 20% below cost. The unrealized losses for U.S. government, agencies and government-sponsored enterprises securities represent long-term, zero coupon Treasury bonds. An increase in Treasury yields since the bonds were purchased resulted in a decrease in the market value of these securities. We expect that these securities will accrete up to par value over time.
Corporate Debt Securities
The following tables present the concentration of gross unrealized losses and fair values related to corporate debt fixed maturity securities that were more than 20% below cost and in a continuous loss position for 12 months or more by industry as of December 31, 2013:
| Investment Grade | ||||||||||||||||||||||||||||||||
| 20% to 50% | Greater than 50% | |||||||||||||||||||||||||||||||
| (Dollar amounts in millions) |
Fair value |
Gross unrealized losses |
% of total gross unrealized losses |
Number of securities |
Fair value |
Gross unrealized losses |
% of total gross unrealized losses |
Number of securities |
||||||||||||||||||||||||
| Industry: |
||||||||||||||||||||||||||||||||
| Finance and insurance |
$ | 39 | $ | (13 | ) | 2 | % | 5 | $ | — | $ | — | — | % | — | |||||||||||||||||
| Utilities and energy |
4 | (1 | ) | — | 1 | — | — | — | — | |||||||||||||||||||||||
| Industrial |
7 | (2 | ) | — | 1 | — | — | — | — | |||||||||||||||||||||||
|
|
|
|
|
|
|
|
|
|
|
|
|
|
|
|
|
|||||||||||||||||
| Total |
$ | 50 | $ | (16 | ) | 2 | % | 7 | $ | — | $ | — | — | % | — | |||||||||||||||||
|
|
|
|
|
|
|
|
|
|
|
|
|
|
|
|
|
|||||||||||||||||
Of the total unrealized losses of $16 million for corporate fixed maturity securities presented in the tables above, $13 million, or 81%, related to issuers in the finance and insurance sector that were 24% below cost on average. Given the current market conditions, including current financial industry events and uncertainty around global economic conditions, the fair value of these debt securities has declined due to credit spreads that have widened since acquisition. In our examination of these securities, we considered all available evidence, including the issuers’ financial condition and current industry events to develop our conclusion on the amount and timing of the cash flows expected to be collected. Based on this evaluation, we determined that the unrealized losses on these debt securities represented temporary impairments as of December 31, 2013. The $13 million of unrealized losses related to the finance and insurance industry related to financial hybrid securities on which a debt impairment model was employed. Most of our hybrid securities retained a credit rating of investment grade. The fair value of these hybrid securities has been impacted by credit spreads that have widened since acquisition and reflect uncertainty surrounding the extent and duration of government involvement, potential capital restructuring of these institutions, and continued but diminishing risk that income payments may be deferred. We continue to receive our contractual payments and expect to fully recover our amortized cost.
We expect that our investments in corporate securities will continue to perform in accordance with our expectations about the amount and timing of estimated cash flows. Although we do not anticipate such events, it is at least reasonably possible that issuers of our investments in corporate securities will perform worse than current expectations. Such events may lead us to recognize write-downs within our portfolio of corporate securities in the future.
250
GENWORTH FINANCIAL, INC.
NOTES TO CONSOLIDATED FINANCIAL STATEMENTS
Years Ended December 31, 2013, 2012 and 2011
Structured Securities
Of the $54 million of unrealized losses related to structured securities that have been in an unrealized loss position for 12 months or more and were more than 20% below cost, $5 million related to other-than-temporarily impaired securities where the unrealized losses represented the portion of the other-than-temporary impairment recognized in OCI. The extent and duration of the unrealized loss position on our structured securities was primarily due to the ongoing concern and uncertainty about the residential and commercial real estate market and unemployment, resulting in credit spreads that have widened since acquisition. Additionally, the fair value of certain structured securities has been significantly impacted from high risk premiums being incorporated into the valuation as a result of the amount of potential losses that may be absorbed by the security in the event of additional deterioration in the U.S. housing market.
While we considered the length of time each security had been in an unrealized loss position, the extent of the unrealized loss position and any significant declines in fair value subsequent to the balance sheet date in our evaluation of impairment for each of these individual securities, the primary factor in our evaluation of impairment is the expected performance for each of these securities. Our evaluation of expected performance is based on the historical performance of the associated securitization trust as well as the historical performance of the underlying collateral. Our examination of the historical performance of the securitization trust included consideration of the following factors for each class of securities issued by the trust: i) the payment history, including failure to make scheduled payments; ii) current payment status; iii) current and historical outstanding balances; iv) current levels of subordination and losses incurred to date; and v) characteristics of the underlying collateral. Our examination of the historical performance of the underlying collateral included: i) historical default rates, delinquency rates, voluntary and involuntary prepayments and severity of losses, including recent trends in this information; ii) current payment status; iii) loan to collateral value ratios, as applicable; iv) vintage; and v) other underlying characteristics such as current financial condition.
We used our assessment of the historical performance of both the securitization trust and the underlying collateral for each security, along with third-party sources, when available, to develop our best estimate of cash flows expected to be collected. These estimates reflect projections for future delinquencies, prepayments, defaults and losses for the assets that collateralize the securitization trust and are used to determine the expected cash flows for our security, based on the payment structure of the trust. Our projection of expected cash flows is primarily based on the expected performance of the underlying assets that collateralize the securitization trust and is not directly impacted by the rating of our security. While we consider the rating of the security as an indicator of the financial condition of the issuer, this factor does not have a significant impact on our expected cash flows for each security. In limited circumstances, our expected cash flows include expected payments from reliable financial guarantors where we believe the financial guarantor will have sufficient assets to pay claims under the financial guarantee when the cash flows from the securitization trust are not sufficient to make scheduled payments. We then discount the expected cash flows using the effective yield of each security to determine the present value of expected cash flows.
Based on this evaluation, the present value of expected cash flows was greater than or equal to the amortized cost for each security. Accordingly, we determined that the unrealized losses on each of our structured securities represented temporary impairments as of December 31, 2013.
Despite the considerable analysis and rigor employed on our structured securities, it is at least reasonably possible that the underlying collateral of these investments will perform worse than current market expectations. Such events may lead to adverse changes in cash flows on our holdings of structured securities and future write-downs within our portfolio of structured securities.
251
GENWORTH FINANCIAL, INC.
NOTES TO CONSOLIDATED FINANCIAL STATEMENTS
Years Ended December 31, 2013, 2012 and 2011
The following table presents the gross unrealized losses and fair values of our investment securities, aggregated by investment type and length of time that individual investment securities have been in a continuous unrealized loss position, as of December 31, 2012:
| Less than 12 months | 12 months or more | Total | ||||||||||||||||||||||||||||||||||
| (Dollar amounts in millions) |
Fair value |
Gross unrealized losses |
Number of securities |
Fair value |
Gross unrealized losses (1) |
Number of securities |
Fair value |
Gross unrealized losses (2) |
Number of securities |
|||||||||||||||||||||||||||
| Description of Securities |
||||||||||||||||||||||||||||||||||||
| U.S. government, agencies and government-sponsored enterprises |
$ | 655 | $ | (18 | ) | 19 | $ | — | $ | — | — | $ | 655 | $ | (18 | ) | 19 | |||||||||||||||||||
| Tax-exempt |
— | — | — | 137 | (30 | ) | 13 | 137 | (30 | ) | 13 | |||||||||||||||||||||||||
| Government—non-U.S. |
103 | (1 | ) | 21 | — | — | — | 103 | (1 | ) | 21 | |||||||||||||||||||||||||
| U.S. corporate |
859 | (19 | ) | 154 | 646 | (85 | ) | 65 | 1,505 | (104 | ) | 219 | ||||||||||||||||||||||||
| Corporate—non-U.S. |
665 | (9 | ) | 105 | 436 | (38 | ) | 41 | 1,101 | (47 | ) | 146 | ||||||||||||||||||||||||
| Residential mortgage-backed |
152 | (1 | ) | 32 | 494 | (224 | ) | 278 | 646 | (225 | ) | 310 | ||||||||||||||||||||||||
| Commercial mortgage-backed |
183 | (1 | ) | 20 | 749 | (102 | ) | 130 | 932 | (103 | ) | 150 | ||||||||||||||||||||||||
| Other asset-backed |
282 | (1 | ) | 42 | 185 | (66 | ) | 18 | 467 | (67 | ) | 60 | ||||||||||||||||||||||||
|
|
|
|
|
|
|
|
|
|
|
|
|
|
|
|
|
|
|
|||||||||||||||||||
| Subtotal, fixed maturity securities |
2,899 | (50 | ) | 393 | 2,647 | (545 | ) | 545 | 5,546 | (595 | ) | 938 | ||||||||||||||||||||||||
| Equity securities |
52 | (4 | ) | 32 | 14 | (2 | ) | 13 | 66 | (6 | ) | 45 | ||||||||||||||||||||||||
|
|
|
|
|
|
|
|
|
|
|
|
|
|
|
|
|
|
|
|||||||||||||||||||
| Total for securities in an unrealized loss position |
$ | 2,951 | $ | (54 | ) | 425 | $ | 2,661 | $ | (547 | ) | 558 | $ | 5,612 | $ | (601 | ) | 983 | ||||||||||||||||||
|
|
|
|
|
|
|
|
|
|
|
|
|
|
|
|
|
|
|
|||||||||||||||||||
| % Below cost—fixed maturity securities: |
||||||||||||||||||||||||||||||||||||
| <20% Below cost |
$ | 2,899 | $ | (50 | ) | 393 | $ | 2,151 | $ | (194 | ) | 337 | $ | 5,050 | $ | (244 | ) | 730 | ||||||||||||||||||
| 20%-50% Below cost |
— | — | — | 445 | (218 | ) | 128 | 445 | (218 | ) | 128 | |||||||||||||||||||||||||
| >50% Below cost |
— | — | — | 51 | (133 | ) | 80 | 51 | (133 | ) | 80 | |||||||||||||||||||||||||
|
|
|
|
|
|
|
|
|
|
|
|
|
|
|
|
|
|
|
|||||||||||||||||||
| Total fixed maturity securities |
2,899 | (50 | ) | 393 | 2,647 | (545 | ) | 545 | 5,546 | (595 | ) | 938 | ||||||||||||||||||||||||
|
|
|
|
|
|
|
|
|
|
|
|
|
|
|
|
|
|
|
|||||||||||||||||||
| % Below cost—equity securities: |
||||||||||||||||||||||||||||||||||||
| <20% Below cost |
47 | (2 | ) | 29 | 12 | (1 | ) | 11 | 59 | (3 | ) | 40 | ||||||||||||||||||||||||
| 20%-50% Below cost |
5 | (2 | ) | 3 | 2 | (1 | ) | 2 | 7 | (3 | ) | 5 | ||||||||||||||||||||||||
|
|
|
|
|
|
|
|
|
|
|
|
|
|
|
|
|
|
|
|||||||||||||||||||
| Total equity securities |
52 | (4 | ) | 32 | 14 | (2 | ) | 13 | 66 | (6 | ) | 45 | ||||||||||||||||||||||||
|
|
|
|
|
|
|
|
|
|
|
|
|
|
|
|
|
|
|
|||||||||||||||||||
| Total for securities in an unrealized loss position |
$ | 2,951 | $ | (54 | ) | 425 | $ | 2,661 | $ | (547 | ) | 558 | $ | 5,612 | $ | (601 | ) | 983 | ||||||||||||||||||
|
|
|
|
|
|
|
|
|
|
|
|
|
|
|
|
|
|
|
|||||||||||||||||||
| Investment grade |
$ | 2,761 | $ | (43 | ) | 356 | $ | 1,616 | $ | (209 | ) | 235 | $ | 4,377 | $ | (252 | ) | 591 | ||||||||||||||||||
| Below investment grade (3) |
190 | (11 | ) | 69 | 1,045 | (338 | ) | 323 | 1,235 | (349 | ) | 392 | ||||||||||||||||||||||||
|
|
|
|
|
|
|
|
|
|
|
|
|
|
|
|
|
|
|
|||||||||||||||||||
| Total for securities in an unrealized loss position |
$ | 2,951 | $ | (54 | ) | 425 | $ | 2,661 | $ | (547 | ) | 558 | $ | 5,612 | $ | (601 | ) | 983 | ||||||||||||||||||
|
|
|
|
|
|
|
|
|
|
|
|
|
|
|
|
|
|
|
|||||||||||||||||||
| (1) | Amounts included $123 million of unrealized losses on other-than-temporarily impaired securities. |
| (2) | Amounts included $124 million of unrealized losses on other-than-temporarily impaired securities. |
| (3) | Amounts that have been in a continuous loss position for 12 months or more included $119 million of unrealized losses on other-than-temporarily impaired securities. |
252
GENWORTH FINANCIAL, INC.
NOTES TO CONSOLIDATED FINANCIAL STATEMENTS
Years Ended December 31, 2013, 2012 and 2011
The scheduled maturity distribution of fixed maturity securities as of December 31, 2013 is set forth below. Actual maturities may differ from contractual maturities because issuers of securities may have the right to call or prepay obligations with or without call or prepayment penalties.
| (Amounts in millions) |
Amortized cost or cost |
Fair value |
||||||
| Due one year or less |
$ | 2,945 | $ | 2,974 | ||||
| Due after one year through five years |
9,659 | 10,187 | ||||||
| Due after five years through ten years |
12,135 | 12,526 | ||||||
| Due after ten years |
20,455 | 21,670 | ||||||
|
|
|
|
|
|||||
| Subtotal |
45,194 | 47,357 | ||||||
| Residential mortgage-backed |
5,058 | 5,225 | ||||||
| Commercial mortgage-backed |
2,886 | 2,898 | ||||||
| Other asset-backed |
3,171 | 3,149 | ||||||
|
|
|
|
|
|||||
| Total |
$ | 56,309 | $ | 58,629 | ||||
|
|
|
|
|
|||||
As of December 31, 2013, $5,703 million of our investments (excluding mortgage-backed and asset-backed securities) were subject to certain call provisions.
As of December 31, 2013, securities issued by utilities and energy, finance and insurance, and consumer—non-cyclical industry groups represented approximately 24%, 19% and 12%, respectively, of our domestic and foreign corporate fixed maturity securities portfolio. No other industry group comprised more than 10% of our investment portfolio. This portfolio is widely diversified among various geographic regions in the United States and internationally, and is not dependent on the economic stability of one particular region.
As of December 31, 2013, we did not hold any fixed maturity securities in any single issuer, other than securities issued or guaranteed by the U.S. government, which exceeded 10% of stockholders’ equity.
As of December 31, 2013 and 2012, $50 million and $1,049 million, respectively, of securities were on deposit with various state or foreign government insurance departments in order to comply with relevant insurance regulations. The decrease from 2012 to 2013 related to the Government Guarantee Agreement in Canada whereby the requirement for the government guarantee fund was terminated and the amount held in the fund reverted back to us on January 1, 2013. See note 19 for additional information related to the termination of the Government Guarantee Agreement in Canada.
253
GENWORTH FINANCIAL, INC.
NOTES TO CONSOLIDATED FINANCIAL STATEMENTS
Years Ended December 31, 2013, 2012 and 2011
(e) Commercial Mortgage Loans
Our mortgage loans are collateralized by commercial properties, including multi-family residential buildings. The carrying value of commercial mortgage loans is stated at original cost net of prepayments, amortization and allowance for loan losses.
We diversify our commercial mortgage loans by both property type and geographic region. The following tables set forth the distribution across property type and geographic region for commercial mortgage loans as of December 31:
| 2013 | 2012 | |||||||||||||||
| (Amounts in millions) |
Carrying value |
% of total |
Carrying value |
% of total |
||||||||||||
| Property type: |
||||||||||||||||
| Retail |
$ | 2,073 | 35 | % | $ | 1,895 | 32 | % | ||||||||
| Industrial |
1,581 | 27 | 1,603 | 27 | ||||||||||||
| Office |
1,558 | 26 | 1,580 | 27 | ||||||||||||
| Apartments |
491 | 8 | 552 | 9 | ||||||||||||
| Mixed use/other |
229 | 4 | 282 | 5 | ||||||||||||
|
|
|
|
|
|
|
|
|
|||||||||
| Subtotal |
5,932 | 100 | % | 5,912 | 100 | % | ||||||||||
|
|
|
|
|
|||||||||||||
| Unamortized balance of loan origination fees and costs |
— | 2 | ||||||||||||||
| Allowance for losses |
(33 | ) | (42 | ) | ||||||||||||
|
|
|
|
|
|||||||||||||
| Total |
$ | 5,899 | $ | 5,872 | ||||||||||||
|
|
|
|
|
|||||||||||||
| 2013 | 2012 | |||||||||||||||
| (Amounts in millions) |
Carrying value |
% of total |
Carrying value |
% of total |
||||||||||||
| Geographic region: |
||||||||||||||||
| Pacific |
$ | 1,590 | 27 | % | $ | 1,553 | 26 | % | ||||||||
| South Atlantic |
1,535 | 26 | 1,587 | 27 | ||||||||||||
| Middle Atlantic |
828 | 14 | 739 | 13 | ||||||||||||
| Mountain |
478 | 8 | 463 | 8 | ||||||||||||
| East North Central |
404 | 7 | 468 | 8 | ||||||||||||
| West North Central |
377 | 6 | 353 | 6 | ||||||||||||
| New England |
337 | 6 | 343 | 6 | ||||||||||||
| West South Central |
241 | 4 | 265 | 4 | ||||||||||||
| East South Central |
142 | 2 | 141 | 2 | ||||||||||||
|
|
|
|
|
|
|
|
|
|||||||||
| Subtotal |
5,932 | 100 | % | 5,912 | 100 | % | ||||||||||
|
|
|
|
|
|||||||||||||
| Unamortized balance of loan origination fees and costs |
— | 2 | ||||||||||||||
| Allowance for losses |
(33 | ) | (42 | ) | ||||||||||||
|
|
|
|
|
|||||||||||||
| Total |
$ | 5,899 | $ | 5,872 | ||||||||||||
|
|
|
|
|
|||||||||||||
254
GENWORTH FINANCIAL, INC.
NOTES TO CONSOLIDATED FINANCIAL STATEMENTS
Years Ended December 31, 2013, 2012 and 2011
The following tables set forth the aging of past due commercial mortgage loans by property type as of December 31:
| 2013 | ||||||||||||||||||||||||
| (Amounts in millions) |
31 - 60 days past due |
61 - 90 days past due |
Greater than 90 days past due |
Total past due |
Current | Total | ||||||||||||||||||
| Property type: |
||||||||||||||||||||||||
| Retail |
$ | — | $ | — | $ | 10 | $ | 10 | $ | 2,063 | $ | 2,073 | ||||||||||||
| Industrial |
2 | 2 | 16 | 20 | 1,561 | 1,581 | ||||||||||||||||||
| Office |
— | — | 6 | 6 | 1,552 | 1,558 | ||||||||||||||||||
| Apartments |
— | — | — | — | 491 | 491 | ||||||||||||||||||
| Mixed use/other |
1 | — | — | 1 | 228 | 229 | ||||||||||||||||||
|
|
|
|
|
|
|
|
|
|
|
|
|
|||||||||||||
| Total recorded investment |
$ | 3 | $ | 2 | $ | 32 | $ | 37 | $ | 5,895 | $ | 5,932 | ||||||||||||
|
|
|
|
|
|
|
|
|
|
|
|
|
|||||||||||||
| % of total commercial mortgage loans |
— | % | — | % | 1 | % | 1 | % | 99 | % | 100 | % | ||||||||||||
|
|
|
|
|
|
|
|
|
|
|
|
|
|||||||||||||
| 2012 | ||||||||||||||||||||||||
| (Amounts in millions) |
31 - 60 days past due |
61 - 90 days past due |
Greater than 90 days past due |
Total past due |
Current | Total | ||||||||||||||||||
| Property type: |
||||||||||||||||||||||||
| Retail |
$ | — | $ | 3 | $ | — | $ | 3 | $ | 1,892 | $ | 1,895 | ||||||||||||
| Industrial |
— | — | — | — | 1,603 | 1,603 | ||||||||||||||||||
| Office |
2 | — | — | 2 | 1,578 | 1,580 | ||||||||||||||||||
| Apartments |
— | — | 4 | 4 | 548 | 552 | ||||||||||||||||||
| Mixed use/other |
66 | — | — | 66 | 216 | 282 | ||||||||||||||||||
|
|
|
|
|
|
|
|
|
|
|
|
|
|||||||||||||
| Total recorded investment |
$ | 68 | $ | 3 | $ | 4 | $ | 75 | $ | 5,837 | $ | 5,912 | ||||||||||||
|
|
|
|
|
|
|
|
|
|
|
|
|
|||||||||||||
| % of total commercial mortgage loans |
1 | % | — | % | — | % | 1 | % | 99 | % | 100 | % | ||||||||||||
|
|
|
|
|
|
|
|
|
|
|
|
|
|||||||||||||
As of December 31, 2013 and 2012, we had no commercial mortgage loans that were past due for more than 90 days and still accruing interest. We also did not have any commercial mortgage loans that were past due for less than 90 days on non-accrual status as of December 31, 2013 and 2012.
We evaluate the impairment of commercial mortgage loans on an individual loan basis. As of December 31, 2013, our commercial mortgage loans greater than 90 days past due included loans with appraised values in excess of the recorded investment and the current recorded investment of these loans was expected to be recoverable.
As of and for the years ended December 31, 2013 and 2012, we modified or extended 33 and 38 commercial mortgage loans, respectively, with a total carrying value of $165 million and $279 million, respectively. All of these modifications or extensions were based on current market interest rates, did not result in any forgiveness in the outstanding principal amount owed by the borrower and were not considered troubled debt restructurings.
255
GENWORTH FINANCIAL, INC.
NOTES TO CONSOLIDATED FINANCIAL STATEMENTS
Years Ended December 31, 2013, 2012 and 2011
The following table sets forth the allowance for credit losses and recorded investment in commercial mortgage loans as of or for the years ended December 31:
| (Amounts in millions) |
2013 | 2012 | 2011 | |||||||||
| Allowance for credit losses: |
||||||||||||
| Beginning balance |
$ | 42 | $ | 51 | $ | 59 | ||||||
| Charge-offs |
(2 | ) | (2 | ) | (5 | ) | ||||||
| Recoveries |
— | — | — | |||||||||
| Provision |
(7 | ) | (7 | ) | (3 | ) | ||||||
|
|
|
|
|
|
|
|||||||
| Ending balance |
$ | 33 | $ | 42 | $ | 51 | ||||||
|
|
|
|
|
|
|
|||||||
| Ending allowance for individually impaired loans |
$ | — | $ | — | $ | — | ||||||
|
|
|
|
|
|
|
|||||||
| Ending allowance for loans not individually impaired that were evaluated collectively for impairment |
$ | 33 | $ | 42 | $ | 51 | ||||||
|
|
|
|
|
|
|
|||||||
| Recorded investment: |
||||||||||||
| Ending balance |
$ | 5,932 | $ | 5,912 | $ | 6,140 | ||||||
|
|
|
|
|
|
|
|||||||
| Ending balance of individually impaired loans |
$ | 2 | $ | — | $ | 10 | ||||||
|
|
|
|
|
|
|
|||||||
| Ending balance of loans not individually impaired that were evaluated collectively for impairment |
$ | 5,930 | $ | 5,912 | $ | 6,130 | ||||||
|
|
|
|
|
|
|
|||||||
As of December 31, 2013, we had individually impaired commercial mortgage loans included within the retail property type with a recorded investment of $2 million, an unpaid principal balance of $3 million, charge-offs of $1 million and an average recorded investment of $2 million. As of December 31, 2012, we did not have any commercial mortgage loans that were individually impaired.
In evaluating the credit quality of commercial mortgage loans, we assess the performance of the underlying loans using both quantitative and qualitative criteria. Certain risks associated with commercial mortgage loans can be evaluated by reviewing both the loan-to-value and debt service coverage ratio to understand both the probability of the borrower not being able to make the necessary loan payments as well as the ability to sell the underlying property for an amount that would enable us to recover our unpaid principal balance in the event of default by the borrower. The average loan-to-value ratio is based on our most recent estimate of the fair value for the underlying property which is evaluated at least annually and updated more frequently if necessary to better indicate risk associated with the loan. A lower loan-to-value indicates that our loan value is more likely to be recovered in the event of default by the borrower if the property was sold. The debt service coverage ratio is based on “normalized” annual net operating income of the property compared to the payments required under the terms of the loan. Normalization allows for the removal of annual one-time events such as capital expenditures, prepaid or late real estate tax payments or non-recurring third-party fees (such as legal, consulting or contract fees). This ratio is evaluated at least annually and updated more frequently if necessary to better indicate risk associated with the loan. A higher debt service coverage ratio indicates the borrower is less likely to default on the loan. The debt service coverage ratio should not be used without considering other factors associated with the borrower, such as the borrower’s liquidity or access to other resources that may result in our expectation that the borrower will continue to make the future scheduled payments.
256
GENWORTH FINANCIAL, INC.
NOTES TO CONSOLIDATED FINANCIAL STATEMENTS
Years Ended December 31, 2013, 2012 and 2011
The following tables set forth the loan-to-value of commercial mortgage loans by property type as of December 31:
| 2013 | ||||||||||||||||||||||||
| (Amounts in millions) |
0% - 50% | 51% - 60% | 61% - 75% | 76% - 100% | Greater than 100% (1) |
Total | ||||||||||||||||||
| Property type: |
||||||||||||||||||||||||
| Retail |
$ | 596 | $ | 336 | $ | 1,024 | $ | 95 | $ | 22 | $ | 2,073 | ||||||||||||
| Industrial |
430 | 237 | 748 | 146 | 20 | 1,581 | ||||||||||||||||||
| Office |
397 | 191 | 716 | 191 | 63 | 1,558 | ||||||||||||||||||
| Apartments |
201 | 86 | 176 | 27 | 1 | 491 | ||||||||||||||||||
| Mixed use/other |
71 | 36 | 110 | 12 | — | 229 | ||||||||||||||||||
|
|
|
|
|
|
|
|
|
|
|
|
|
|||||||||||||
| Total recorded investment |
$ | 1,695 | $ | 886 | $ | 2,774 | $ | 471 | $ | 106 | $ | 5,932 | ||||||||||||
|
|
|
|
|
|
|
|
|
|
|
|
|
|||||||||||||
| % of total |
28 | % | 15 | % | 47 | % | 8 | % | 2 | % | 100 | % | ||||||||||||
|
|
|
|
|
|
|
|
|
|
|
|
|
|||||||||||||
| Weighted-average debt service coverage ratio |
2.14 | 1.79 | 1.66 | 1.03 | 0.63 | 1.75 | ||||||||||||||||||
|
|
|
|
|
|
|
|
|
|
|
|
|
|||||||||||||
| (1) | Included $2 million of impaired loans, $5 million of delinquent loans and $99 million of loans in good standing, where borrowers continued to make timely payments, with a total weighted-average loan-to-value of 119%. |
| 2012 | ||||||||||||||||||||||||
| (Amounts in millions) |
0% - 50% | 51% - 60% | 61% - 75% | 76% - 100% | Greater than 100% (1) |
Total | ||||||||||||||||||
| Property type: |
||||||||||||||||||||||||
| Retail |
$ | 548 | $ | 280 | $ | 874 | $ | 162 | $ | 31 | $ | 1,895 | ||||||||||||
| Industrial |
462 | 242 | 671 | 188 | 40 | 1,603 | ||||||||||||||||||
| Office |
323 | 237 | 688 | 288 | 44 | 1,580 | ||||||||||||||||||
| Apartments |
167 | 140 | 201 | 29 | 15 | 552 | ||||||||||||||||||
| Mixed use/other |
68 | 24 | 103 | 81 | 6 | 282 | ||||||||||||||||||
|
|
|
|
|
|
|
|
|
|
|
|
|
|||||||||||||
| Total recorded investment |
$ | 1,568 | $ | 923 | $ | 2,537 | $ | 748 | $ | 136 | $ | 5,912 | ||||||||||||
|
|
|
|
|
|
|
|
|
|
|
|
|
|||||||||||||
| % of total |
27 | % | 16 | % | 42 | % | 13 | % | 2 | % | 100 | % | ||||||||||||
|
|
|
|
|
|
|
|
|
|
|
|
|
|||||||||||||
| Weighted-average debt service coverage ratio |
2.13 | 1.73 | 2.09 | 1.18 | 2.48 | 1.95 | ||||||||||||||||||
|
|
|
|
|
|
|
|
|
|
|
|
|
|||||||||||||
| (1) | Included $136 million of loans in good standing, where borrowers continued to make timely payments, with a total weighted-average loan-to-value of 144%. |
257
GENWORTH FINANCIAL, INC.
NOTES TO CONSOLIDATED FINANCIAL STATEMENTS
Years Ended December 31, 2013, 2012 and 2011
The following tables set forth the debt service coverage ratio for fixed rate commercial mortgage loans by property type as of December 31:
| 2013 | ||||||||||||||||||||||||
| (Amounts in millions) |
Less than 1.00 | 1.00 - 1.25 | 1.26 - 1.50 | 1.51 - 2.00 | Greater than 2.00 |
Total | ||||||||||||||||||
| Property type: |
||||||||||||||||||||||||
| Retail |
$ | 106 | $ | 314 | $ | 374 | $ | 779 | $ | 399 | $ | 1,972 | ||||||||||||
| Industrial |
195 | 100 | 270 | 721 | 295 | 1,581 | ||||||||||||||||||
| Office |
131 | 181 | 225 | 637 | 376 | 1,550 | ||||||||||||||||||
| Apartments |
3 | 31 | 107 | 187 | 163 | 491 | ||||||||||||||||||
| Mixed use/other |
16 | 9 | 32 | 106 | 66 | 229 | ||||||||||||||||||
|
|
|
|
|
|
|
|
|
|
|
|
|
|||||||||||||
| Total recorded investment |
$ | 451 | $ | 635 | $ | 1,008 | $ | 2,430 | $ | 1,299 | $ | 5,823 | ||||||||||||
|
|
|
|
|
|
|
|
|
|
|
|
|
|||||||||||||
| % of total |
8 | % | 11 | % | 17 | % | 42 | % | 22 | % | 100 | % | ||||||||||||
|
|
|
|
|
|
|
|
|
|
|
|
|
|||||||||||||
| Weighted-average loan-to-value |
80 | % | 68 | % | 63 | % | 60 | % | 43 | % | 59 | % | ||||||||||||
|
|
|
|
|
|
|
|
|
|
|
|
|
|||||||||||||
| 2012 | ||||||||||||||||||||||||
| (Amounts in millions) |
Less than 1.00 | 1.00 - 1.25 | 1.26 - 1.50 | 1.51 - 2.00 | Greater than 2.00 |
Total | ||||||||||||||||||
| Property type: |
||||||||||||||||||||||||
| Retail |
$ | 87 | $ | 295 | $ | 391 | $ | 634 | $ | 384 | $ | 1,791 | ||||||||||||
| Industrial |
164 | 148 | 311 | 629 | 345 | 1,597 | ||||||||||||||||||
| Office |
148 | 174 | 312 | 559 | 303 | 1,496 | ||||||||||||||||||
| Apartments |
9 | 62 | 90 | 279 | 112 | 552 | ||||||||||||||||||
| Mixed use/other |
32 | 21 | 49 | 64 | 50 | 216 | ||||||||||||||||||
|
|
|
|
|
|
|
|
|
|
|
|
|
|||||||||||||
| Total recorded investment |
$ | 440 | $ | 700 | $ | 1,153 | $ | 2,165 | $ | 1,194 | $ | 5,652 | ||||||||||||
|
|
|
|
|
|
|
|
|
|
|
|
|
|||||||||||||
| % of total |
8 | % | 12 | % | 20 | % | 39 | % | 21 | % | 100 | % | ||||||||||||
|
|
|
|
|
|
|
|
|
|
|
|
|
|||||||||||||
| Weighted-average loan-to-value |
81 | % | 71 | % | 66 | % | 61 | % | 45 | % | 61 | % | ||||||||||||
|
|
|
|
|
|
|
|
|
|
|
|
|
|||||||||||||
As of December 31, 2013 and 2012, we had floating rate commercial mortgage loans of $109 million and $260 million, respectively.
(f) Restricted Commercial Mortgage Loans Related To Securitization Entities
We have consolidated securitization entities that hold commercial mortgage loans that are recorded as restricted commercial mortgage loans related to securitization entities. See note 18 for additional information related to consolidated securitization entities.
(g) Restricted Other Invested Assets Related To Securitization Entities
We have consolidated securitization entities that hold certain investments that are recorded as restricted other invested assets related to securitization entities. The consolidated securitization entities hold certain investments as trading securities whereby the changes in fair value are recorded in current period income (loss). The trading securities comprise asset-backed securities, including residual interest in certain policy loan securitization entities and highly rated bonds that are primarily backed by credit card receivables. See note 18 for additional information related to consolidated securitization entities.
258
GENWORTH FINANCIAL, INC.
NOTES TO CONSOLIDATED FINANCIAL STATEMENTS
Years Ended December 31, 2013, 2012 and 2011
Our business activities routinely deal with fluctuations in interest rates, equity prices, currency exchange rates and other asset and liability prices. We use derivative instruments to mitigate or reduce certain of these risks. We have established policies for managing each of these risks, including prohibitions on derivatives market-making and other speculative derivatives activities. These policies require the use of derivative instruments in concert with other techniques to reduce or mitigate these risks. While we use derivatives to mitigate or reduce risks, certain derivatives do not meet the accounting requirements to be designated as hedging instruments and are denoted as “derivatives not designated as hedges” in the following disclosures. For derivatives that meet the accounting requirements to be designated as hedges, the following disclosures for these derivatives are denoted as “derivatives designated as hedges,” which include both cash flow and fair value hedges.
The following table sets forth our positions in derivative instruments as of December 31:
| Derivative assets | Derivative liabilities | |||||||||||||||||||
| (Amounts in millions) |
Balance
sheet classification |
Fair value | Balance
sheet classification |
Fair value | ||||||||||||||||
| 2013 | 2012 | 2013 | 2012 | |||||||||||||||||
| Derivatives designated as hedges |
||||||||||||||||||||
| Cash flow hedges: |
||||||||||||||||||||
| Interest rate swaps |
Other invested assets | $ | 121 | $ | 414 | Other liabilities | $ | 569 | $ | 27 | ||||||||||
| Inflation indexed swaps |
Other invested assets | — | — | Other liabilities | 60 | 105 | ||||||||||||||
| Foreign currency swaps |
Other invested assets | 4 | 3 | Other liabilities | 2 | 1 | ||||||||||||||
| Forward bond purchase commitments |
Other invested assets | — | 53 | Other liabilities | 13 | — | ||||||||||||||
|
|
|
|
|
|
|
|
|
|||||||||||||
| Total cash flow hedges |
125 | 470 | 644 | 133 | ||||||||||||||||
|
|
|
|
|
|
|
|
|
|||||||||||||
| Fair value hedges: |
||||||||||||||||||||
| Interest rate swaps |
Other invested assets | 1 | 12 | Other liabilities | — | — | ||||||||||||||
| Foreign currency swaps |
Other invested assets | — | 31 | Other liabilities | — | — | ||||||||||||||
|
|
|
|
|
|
|
|
|
|||||||||||||
| Total fair value hedges |
1 | 43 | — | — | ||||||||||||||||
|
|
|
|
|
|
|
|
|
|||||||||||||
| Total derivatives designated as hedges |
126 | 513 | 644 | 133 | ||||||||||||||||
|
|
|
|
|
|
|
|
|
|||||||||||||
| Derivatives not designated as hedges |
||||||||||||||||||||
| Interest rate swaps |
Other invested assets | 314 | 603 | Other liabilities | 6 | 280 | ||||||||||||||
| Interest rate swaps related to securitization entities (1) |
Restricted other invested assets |
— | — | Other liabilities | 16 | 27 | ||||||||||||||
| Credit default swaps |
Other invested assets | 11 | 8 | Other liabilities | — | 1 | ||||||||||||||
| Credit default swaps related to securitization entities (1) |
Restricted other invested assets |
— | — | Other liabilities | 32 | 104 | ||||||||||||||
| Equity index options |
Other invested assets | 12 | 25 | Other liabilities | — | — | ||||||||||||||
| Financial futures |
Other invested assets | — | — | Other liabilities | — | — | ||||||||||||||
| Equity return swaps |
Other invested assets | — | — | Other liabilities | 1 | 8 | ||||||||||||||
| Other foreign currency contracts |
Other invested assets | 8 | — | Other liabilities | 4 | — | ||||||||||||||
| GMWB embedded derivatives |
Reinsurance recoverable (2) | (1 | ) | 10 | Policyholder account balances (3) |
96 | 350 | |||||||||||||
| Fixed index annuity embedded derivatives |
Other assets (4) | — | — | Policyholder account balances (4) |
143 | 27 | ||||||||||||||
|
|
|
|
|
|
|
|
|
|||||||||||||
| Total derivatives not designated as hedges |
344 | 646 | 298 | 797 | ||||||||||||||||
|
|
|
|
|
|
|
|
|
|||||||||||||
| Total derivatives |
$ | 470 | $ | 1,159 | $ | 942 | $ | 930 | ||||||||||||
|
|
|
|
|
|
|
|
|
|||||||||||||
| (1) | See note 18 for additional information related to consolidated securitization entities. |
| (2) | Represents embedded derivatives associated with the reinsured portion of our GMWB liabilities. |
| (3) | Represents the embedded derivatives associated with our GMWB liabilities, excluding the impact of reinsurance. |
| (4) | Represents the embedded derivatives associated with our fixed index annuity liabilities. |
259
GENWORTH FINANCIAL, INC.
NOTES TO CONSOLIDATED FINANCIAL STATEMENTS
Years Ended December 31, 2013, 2012 and 2011
The fair value of derivative positions presented above was not offset by the respective collateral amounts retained or provided under these agreements. The amounts recognized for derivative counterparty collateral retained by us was recorded in other invested assets with a corresponding amount recorded in other liabilities to represent our obligation to return the collateral retained by us.
The activity associated with derivative instruments can generally be measured by the change in notional value over the periods presented. However, for GMWB and fixed index annuity embedded derivatives, the change between periods is best illustrated by the number of policies. The following tables represent activity associated with derivative instruments as of the dates indicated:
| (Notional in millions) |
Measurement | December 31, 2012 |
Additions | Maturities/ terminations |
December 31, 2013 |
|||||||||||||||
| Derivatives designated as hedges |
||||||||||||||||||||
| Cash flow hedges: |
||||||||||||||||||||
| Interest rate swaps |
Notional | $ | 10,146 | $ | 9,645 | $ | (5,865 | ) | $ | 13,926 | ||||||||||
| Inflation indexed swaps |
Notional | 554 | 11 | (4 | ) | 561 | ||||||||||||||
| Foreign currency swaps |
Notional | 183 | 102 | (250 | ) | 35 | ||||||||||||||
| Forward bond purchase commitments |
Notional | 456 | — | (219 | ) | 237 | ||||||||||||||
|
|
|
|
|
|
|
|
|
|||||||||||||
| Total cash flow hedges |
11,339 | 9,758 | (6,338 | ) | 14,759 | |||||||||||||||
|
|
|
|
|
|
|
|
|
|||||||||||||
| Fair value hedges: |
||||||||||||||||||||
| Interest rate swaps |
Notional | 723 | — | (717 | ) | 6 | ||||||||||||||
| Foreign currency swaps |
Notional | 85 | — | (85 | ) | — | ||||||||||||||
|
|
|
|
|
|
|
|
|
|||||||||||||
| Total fair value hedges |
808 | — | (802 | ) | 6 | |||||||||||||||
|
|
|
|
|
|
|
|
|
|||||||||||||
| Total derivatives designated as hedges |
12,147 | 9,758 | (7,140 | ) | 14,765 | |||||||||||||||
|
|
|
|
|
|
|
|
|
|||||||||||||
| Derivatives not designated as hedges |
||||||||||||||||||||
| Interest rate swaps |
Notional | 6,331 | 961 | (2,470 | ) | 4,822 | ||||||||||||||
| Interest rate swaps related to securitization entities (1) |
Notional | 104 | — | (13 | ) | 91 | ||||||||||||||
| Credit default swaps |
Notional | 932 | 68 | (361 | ) | 639 | ||||||||||||||
| Credit default swaps related to securitization entities (1) |
Notional | 312 | — | — | 312 | |||||||||||||||
| Equity index options |
Notional | 936 | 1,568 | (1,727 | ) | 777 | ||||||||||||||
| Financial futures |
Notional | 1,692 | 5,138 | (5,570 | ) | 1,260 | ||||||||||||||
| Equity return swaps |
Notional | 186 | 138 | (214 | ) | 110 | ||||||||||||||
| Other foreign currency contracts |
Notional | — | 769 | (282 | ) | 487 | ||||||||||||||
|
|
|
|
|
|
|
|
|
|||||||||||||
| Total derivatives not designated as hedges |
10,493 | 8,642 | (10,637 | ) | 8,498 | |||||||||||||||
|
|
|
|
|
|
|
|
|
|||||||||||||
| Total derivatives |
$ | 22,640 | $ | 18,400 | $ | (17,777 | ) | $ | 23,263 | |||||||||||
|
|
|
|
|
|
|
|
|
|||||||||||||
| (1) | See note 18 for additional information related to consolidated securitization entities. |
| (Number of policies) |
Measurement | December 31, 2012 |
Additions | Maturities/ terminations |
December 31, 2013 |
|||||||||||||||
| Derivatives not designated as hedges |
||||||||||||||||||||
| GMWB embedded derivatives |
Policies | 45,027 | — | (2,982 | ) | 42,045 | ||||||||||||||
| Fixed index annuity embedded derivatives |
Policies | 2,013 | 5,766 | (74 | ) | 7,705 | ||||||||||||||
260
GENWORTH FINANCIAL, INC.
NOTES TO CONSOLIDATED FINANCIAL STATEMENTS
Years Ended December 31, 2013, 2012 and 2011
Cash Flow Hedges
Certain derivative instruments are designated as cash flow hedges. The changes in fair value of these instruments are recorded as a component of OCI. We designate and account for the following as cash flow hedges when they have met the effectiveness requirements: (i) various types of interest rate swaps to convert floating rate investments to fixed rate investments; (ii) various types of interest rate swaps to convert floating rate liabilities into fixed rate liabilities; (iii) receive U.S. dollar fixed on foreign currency swaps to hedge the foreign currency cash flow exposure of foreign currency denominated investments; (iv) forward starting interest rate swaps to hedge against changes in interest rates associated with future fixed rate bond purchases and/or interest income; (v) forward bond purchase commitments to hedge against the variability in the anticipated cash flows required to purchase future fixed rate bonds; and (vi) other instruments to hedge the cash flows of various forecasted transactions.
The following table provides information about the pre-tax income (loss) effects of cash flow hedges for the year ended December 31, 2013:
| (Amounts in millions) |
Gain (loss) recognized in OCI |
Gain (loss) reclassified into net income from OCI |
Classification of gain |
Gain (loss) recognized in net income (1) |
Classification of gain | |||||||||||
| Interest rate swaps hedging assets |
$ | (892 | ) | $ | 47 | Net investment income | $ | (14 | ) | Net investment gains (losses) | ||||||
| Interest rate swaps hedging assets |
— | 1 | Net investment gains (losses) | — | Net investment gains (losses) | |||||||||||
| Interest rate swaps hedging liabilities |
42 | 2 | Interest expense | — | Net investment gains (losses) | |||||||||||
| Inflation indexed swaps |
45 | (5 | ) | Net investment income | — | Net investment gains (losses) | ||||||||||
| Foreign currency swaps |
(1 | ) | — | Interest expense | — | Net investment gains (losses) | ||||||||||
| Forward bond purchase commitments |
(60 | ) | — | Net investment income | — | Net investment gains (losses) | ||||||||||
|
|
|
|
|
|
|
|||||||||||
| Total |
$ | (866 | ) | $ | 45 | $ | (14 | ) | ||||||||
|
|
|
|
|
|
|
|||||||||||
| (1) | Represents ineffective portion of cash flow hedges as there were no amounts excluded from the measurement of effectiveness. |
261
GENWORTH FINANCIAL, INC.
NOTES TO CONSOLIDATED FINANCIAL STATEMENTS
Years Ended December 31, 2013, 2012 and 2011
The following table provides information about the pre-tax income (loss) effects of cash flow hedges for the year ended December 31, 2012:
| (Amounts in millions) |
Gain (loss) recognized in OCI |
Gain (loss) reclassified into net income from OCI |
Classification of gain |
Gain (loss) recognized in net income (1) |
Classification of gain | |||||||||||
| Interest rate swaps hedging assets |
$ | (74 | ) | $ | 40 | Net investment income | $ | (12 | ) | Net investment gains (losses) | ||||||
| Interest rate swaps hedging assets |
— | 2 | Net investment gains (losses) | — | Net investment gains (losses) | |||||||||||
| Interest rate swaps hedging liabilities |
— | 2 | Interest expense | — | Net investment gains (losses) | |||||||||||
| Inflation indexed swaps |
(58 | ) | (9 | ) | Net investment income | — | Net investment gains (losses) | |||||||||
| Foreign currency swaps |
3 | — | Interest expense | — | Net investment gains (losses) | |||||||||||
| Forward bond purchase commitments |
14 | — | Net investment income | — | Net investment gains (losses) | |||||||||||
|
|
|
|
|
|
|
|||||||||||
| Total |
$ | (115 | ) | $ | 35 | $ | (12 | ) | ||||||||
|
|
|
|
|
|
|
|||||||||||
| (1) | Represents ineffective portion of cash flow hedges, as there were no amounts excluded from the measurement of effectiveness. |
The following table provides information about the pre-tax income (loss) effects of cash flow hedges for the year ended December 31, 2011:
| (Amounts in millions) |
Gain (loss) recognized in OCI |
Gain (loss) reclassified into net income from OCI |
Classification of gain |
Gain (loss) recognized in net income (1) |
Classification of gain | |||||||||||
| Interest rate swaps hedging assets |
$ | 1,642 | $ | 27 | Net investment income | $ | 49 | Net investment gains (losses) | ||||||||
| Interest rate swaps hedging assets |
— | 2 | Net investment gains (losses) | — | Net investment gains (losses) | |||||||||||
| Interest rate swaps hedging liabilities |
— | 2 | Interest expense | — | Net investment gains (losses) | |||||||||||
| Inflation indexed swaps |
(10 | ) | (25 | ) | Net investment income | — | Net investment gains (losses) | |||||||||
| Foreign currency swaps |
4 | (5 | ) | Interest expense | — | Net investment gains (losses) | ||||||||||
| Forward bond purchase commitments |
47 | — | Net investment income | — | Net investment gains (losses) | |||||||||||
|
|
|
|
|
|
|
|||||||||||
| Total |
$ | 1,683 | $ | 1 | $ | 49 | ||||||||||
|
|
|
|
|
|
|
|||||||||||
| (1) | Represents ineffective portion of cash flow hedges, as there were no amounts excluded from the measurement of effectiveness. |
262
GENWORTH FINANCIAL, INC.
NOTES TO CONSOLIDATED FINANCIAL STATEMENTS
Years Ended December 31, 2013, 2012 and 2011
The following table provides a reconciliation of current period changes, net of applicable income taxes, for these designated derivatives presented in the separate component of stockholders’ equity labeled “derivatives qualifying as hedges,” for the years ended December 31:
| (Amounts in millions) |
2013 | 2012 | 2011 | |||||||||
| Derivatives qualifying as effective accounting hedges as of January 1 |
$ | 1,909 | $ | 2,009 | $ | 924 | ||||||
| Current period increases (decreases) in fair value, net of deferred taxes of $305, $38 and $(597) |
(561 | ) | (77 | ) | 1,086 | |||||||
| Reclassification to net (income), net of deferred taxes of $16, $12 and $— |
(29 | ) | (23 | ) | (1 | ) | ||||||
|
|
|
|
|
|
|
|||||||
| Derivatives qualifying as effective accounting hedges as of December 31 |
$ | 1,319 | $ | 1,909 | $ | 2,009 | ||||||
|
|
|
|
|
|
|
|||||||
The total of derivatives designated as cash flow hedges of $1,319 million, net of taxes, recorded in stockholders’ equity as of December 31, 2013 is expected to be reclassified to future net income, concurrently with and primarily offsetting changes in interest expense and interest income on floating rate instruments and interest income on future fixed rate bond purchases. Of this amount, $40 million, net of taxes, is expected to be reclassified to net income in the next 12 months. Actual amounts may vary from this amount as a result of market conditions. All forecasted transactions associated with qualifying cash flow hedges are expected to occur by 2047. No amounts were reclassified to net income during the years ended December 31, 2013, 2012 and 2011 in connection with forecasted transactions that were no longer considered probable of occurring.
Fair Value Hedges
Certain derivative instruments are designated as fair value hedges. The changes in fair value of these instruments are recorded in net income. In addition, changes in the fair value attributable to the hedged portion of the underlying instrument are reported in net income. We designate and account for the following as fair value hedges when they have met the effectiveness requirements: (i) interest rate swaps to convert fixed rate investments to floating rate investments; (ii) interest rate swaps to convert fixed rate liabilities into floating rate liabilities; (iii) cross currency swaps to convert non-U.S. dollar fixed rate liabilities to floating rate U.S. dollar liabilities; and (iv) other instruments to hedge various fair value exposures of investments.
The following table provides information about the pre-tax income (loss) effects of fair value hedges and related hedged items for the year ended December 31, 2013:
| Derivative instrument | Hedged item | |||||||||||||||||
| (Amounts in millions) |
Gain (loss) recognized in net income |
Classification |
Other impacts to net income |
Classification |
Gain (loss) recognized in net income |
Classification | ||||||||||||
| Interest rate swaps hedging assets |
$ | — | Net investment gains (losses) | $ | — | Net investment income | $ | — | Net investment gains (losses) | |||||||||
| Interest rate swaps hedging liabilities |
|
(11 |
) |
Net investment gains (losses) |
|
13 |
|
Interest credited |
|
11 |
|
Net investment gains (losses) | ||||||
| Foreign currency |
(31 | ) | Net investment gains (losses) | — | Interest credited | 31 | Net investment gains (losses) | |||||||||||
|
|
|
|
|
|
|
|||||||||||||
| Total |
$ | (42 | ) | $ | 13 | $ | 42 | |||||||||||
|
|
|
|
|
|
|
|||||||||||||
263
GENWORTH FINANCIAL, INC.
NOTES TO CONSOLIDATED FINANCIAL STATEMENTS
Years Ended December 31, 2013, 2012 and 2011
The following table provides information about the pre-tax income (loss) effects of fair value hedges and related hedged items for the year ended December 31, 2012:
| Derivative instrument | Hedged item | |||||||||||||||||
| (Amounts in millions) |
Gain (loss) recognized in net income |
Classification |
Other impacts to net income |
Classification |
Gain (loss) recognized in net income |
Classification | ||||||||||||
| Interest rate swaps hedging assets |
$ | 1 | Net investment gains (losses) | $ | (4 | ) | Net investment income | $ | (1 | ) | Net investment gains (losses) | |||||||
| Interest rate swaps hedging liabilities |
|
(30 |
) |
Net investment gains (losses) | 38 | Interest credited | 30 | Net investment gains (losses) | ||||||||||
| Foreign currency |
(1 | ) | Net investment gains (losses) | 2 | Interest credited | — | Net investment gains (losses) | |||||||||||
|
|
|
|
|
|
|
|||||||||||||
| Total |
$ | (30 | ) | $ | 36 | $ | 29 | |||||||||||
|
|
|
|
|
|
|
|||||||||||||
The following table provides information about the pre-tax income (loss) effects of fair value hedges and related hedged items for the year ended December 31, 2011:
| Derivative instrument | Hedged item | |||||||||||||||||
| (Amounts in millions) |
Gain (loss) recognized in net income |
Classification |
Other impacts to net income |
Classification |
Gain (loss) recognized in net income |
Classification | ||||||||||||
| Interest rate swaps hedging assets |
$ | 3 | Net investment gains (losses) | $ | (9 | ) | Net investment income | $ | (3 | ) | Net investment gains (losses) | |||||||
| Interest rate swaps hedging liabilities |
(52 | ) | Net investment gains (losses) | 66 | Interest credited | 52 | Net investment gains (losses) | |||||||||||
| Foreign currency |
(3 | ) | Net investment gains (losses) | 3 | Interest credited | 3 | Net investment gains (losses) | |||||||||||
|
|
|
|
|
|
|
|||||||||||||
| Total |
$ | (52 | ) | $ | 60 | $ | 52 | |||||||||||
|
|
|
|
|
|
|
|||||||||||||
The difference between the gain (loss) recognized for the derivative instrument and the hedged item presented above represents the net ineffectiveness of the fair value hedging relationships. The other impacts presented above represent the net income effects of the derivative instruments that are presented in the same location as the income (loss) activity from the hedged item. There were no amounts excluded from the measurement of effectiveness.
Derivatives Not Designated As Hedges
We also enter into certain non-qualifying derivative instruments such as: (i) interest rate swaps and financial futures to mitigate interest rate risk as part of managing regulatory capital positions; (ii) credit default swaps to enhance yield and reproduce characteristics of investments with similar terms and credit risk; (iii) equity index options, equity return swaps, interest rate swaps and financial futures to mitigate the risks associated with liabilities that have guaranteed minimum benefits and fixed index annuities; (iv) interest rate swaps where the hedging relationship does not qualify for hedge accounting; (v) credit default swaps to mitigate loss exposure to certain credit risk; (vi) foreign currency forward contracts and options to mitigate currency risk associated with investments and future dividends and other cash flows from certain foreign subsidiaries to our holding company;
264
GENWORTH FINANCIAL, INC.
NOTES TO CONSOLIDATED FINANCIAL STATEMENTS
Years Ended December 31, 2013, 2012 and 2011
and (vii) equity index options to mitigate certain macroeconomic risks associated with certain foreign subsidiaries. Additionally, we provide GMWBs on certain variable annuities that are required to be bifurcated as embedded derivatives. We also offer fixed index annuity products and have reinsurance agreements with certain features that are required to be bifurcated as embedded derivatives.
We also have derivatives related to securitization entities where we were required to consolidate the related securitization entity as a result of our involvement in the structure. The counterparties for these derivatives typically only have recourse to the securitization entity. The interest rate swaps used for these entities are typically used to effectively convert the interest payments on the assets of the securitization entity to the same basis as the interest rate on the borrowings issued by the securitization entity. Credit default swaps are utilized in certain securitization entities to enhance the yield payable on the borrowings issued by the securitization entity and also include a settlement feature that allows the securitization entity to provide the par value of assets in the securitization entity for the amount of any losses incurred under the credit default swap.
The following table provides the pre-tax gain (loss) recognized in net income for the effects of derivatives not designated as hedges for the years ended December 31:
| (Amounts in millions) |
2013 | 2012 | 2011 |
Classification of gain (loss) recognized | ||||||||||
| Interest rate swaps |
$ | (7 | ) | $ | 21 | $ | 11 | Net investment gains (losses) | ||||||
| Interest rate swaps related to securitization entities (1) |
9 | (4 | ) | (16 | ) | Net investment gains (losses) | ||||||||
| Credit default swaps |
14 | 57 | (45 | ) | Net investment gains (losses) | |||||||||
| Credit default swaps related to securitization entities (1) |
77 | 76 | (46 | ) | Net investment gains (losses) | |||||||||
| Equity index options |
(43 | ) | (58 | ) | 8 | Net investment gains (losses) | ||||||||
| Financial futures |
(232 | ) | (121 | ) | 175 | Net investment gains (losses) | ||||||||
| Equity return swaps |
(33 | ) | (37 | ) | 3 | Net investment gains (losses) | ||||||||
| Other foreign currency contracts |
6 | (19 | ) | (16 | ) | Net investment gains (losses) | ||||||||
| Reinsurance embedded derivatives |
— | 3 | 29 | Net investment gains (losses) | ||||||||||
| GMWB embedded derivatives |
277 | 170 | (316 | ) | Net investment gains (losses) | |||||||||
| Fixed index annuity embedded derivatives |
(18 | ) | (1 | ) | 1 | Net investment gains (losses) | ||||||||
|
|
|
|
|
|
|
|||||||||
| Total derivatives not designated as hedges |
$ | 50 | $ | 87 | $ | (212 | ) | |||||||
|
|
|
|
|
|
|
|||||||||
| (1) | See note 18 for additional information related to consolidated securitization entities. |
265
GENWORTH FINANCIAL, INC.
NOTES TO CONSOLIDATED FINANCIAL STATEMENTS
Years Ended December 31, 2013, 2012 and 2011
Derivative Counterparty Credit Risk
Most of our derivative arrangements with counterparties require the posting of collateral upon meeting certain net exposure thresholds. For derivatives related to securitization entities, there are no arrangements that require either party to provide collateral and the recourse of the derivative counterparty is typically limited to the assets held by the securitization entity and there is no recourse to any entity other than the securitization entity.
The following tables present additional information about derivative assets and liabilities subject to an enforceable master netting arrangement as of December 31:
| 2013 | ||||||||||||||||||||||||||||
| Gross amounts not offset in the balance sheet |
||||||||||||||||||||||||||||
| (Amounts in millions) |
Gross amounts recognized |
Gross amounts offset in the balance sheet |
Net amounts presented in the balance sheet |
Financial instruments |
Collateral pledged/ received |
Over collateralization |
Net amount |
|||||||||||||||||||||
| Derivative assets (1) |
$ | 496 | $ | — | $ | 496 | $ | (286 | ) | $ | (199 | ) | $ | 16 | $ | 27 | ||||||||||||
| Derivative liabilities (2) |
662 | — | 662 | (286 | ) | (394 | ) | 23 | 5 | |||||||||||||||||||
|
|
|
|
|
|
|
|
|
|
|
|
|
|
|
|||||||||||||||
| Net derivatives |
$ | (166 | ) | $ | — | $ | (166 | ) | $ | — | $ | 195 | $ | (7 | ) | $ | 22 | |||||||||||
|
|
|
|
|
|
|
|
|
|
|
|
|
|
|
|||||||||||||||
| (1) | Included $25 million of accruals on derivatives classified as other assets and does not include amounts related to embedded derivatives. |
| (2) | Included $7 million of accruals on derivatives classified as other liabilities and does not include amounts related to embedded derivatives and derivatives related to securitization entities. |
| 2012 | ||||||||||||||||||||||||||||
| Gross amounts not offset in the balance sheet |
||||||||||||||||||||||||||||
| (Amounts in millions) |
Gross amounts recognized |
Gross amounts offset in the balance sheet |
Net amounts presented in the balance sheet |
Financial instruments |
Collateral pledged/ received |
Over collateralization |
Net amount |
|||||||||||||||||||||
| Derivative assets (1) |
$ | 1,196 | $ | — | $ | 1,196 | $ | (368 | ) | $ | (840 | ) | $ | 84 | $ | 72 | ||||||||||||
| Derivative liabilities (2) |
432 | — | 432 | (368 | ) | (61 | ) | 9 | 12 | |||||||||||||||||||
|
|
|
|
|
|
|
|
|
|
|
|
|
|
|
|||||||||||||||
| Net derivatives |
$ | 764 | $ | — | $ | 764 | $ | — | $ | (779 | ) | $ | 75 | $ | 60 | |||||||||||||
|
|
|
|
|
|
|
|
|
|
|
|
|
|
|
|||||||||||||||
| (1) | Included $47 million of accruals on derivatives classified as other assets and does not include amounts related to embedded derivatives. |
| (2) | Included $10 million of accruals on derivatives classified as other liabilities and does not include amounts related to embedded derivatives and derivatives related to securitization entities. |
Except for derivatives related to securitization entities, almost all of our master swap agreements contain credit downgrade provisions that allow either party to assign or terminate derivative transactions if the other party’s long-term unsecured debt rating or financial strength rating is below the limit defined in the applicable agreement. If the downgrade provisions had been triggered as of December 31, 2013 and 2012, we could have been allowed to claim or required to disburse up to the net amounts shown in the last column of the charts above. The charts above exclude embedded derivatives and derivatives related to securitization entities as those derivatives are not subject to master netting arrangements.
266
GENWORTH FINANCIAL, INC.
NOTES TO CONSOLIDATED FINANCIAL STATEMENTS
Years Ended December 31, 2013, 2012 and 2011
Credit Derivatives
We sell protection under single name credit default swaps and credit default swap index tranches in combination with purchasing securities to replicate characteristics of similar investments based on the credit quality and term of the credit default swap. Credit default triggers for both indexed reference entities and single name reference entities follow the Credit Derivatives Physical Settlement Matrix published by the International Swaps and Derivatives Association. Under these terms, credit default triggers are defined as bankruptcy, failure to pay or restructuring, if applicable. Our maximum exposure to credit loss equals the notional value for credit default swaps. In the event of default for credit default swaps, we are typically required to pay the protection holder the full notional value less a recovery rate determined at auction.
In addition to the credit derivatives discussed above, we also have credit derivative instruments related to securitization entities that we consolidate. These derivatives represent a customized index of reference entities with specified attachment points for certain derivatives. The credit default triggers are similar to those described above. In the event of default, the securitization entity will provide the counterparty with the par value of assets held in the securitization entity for the amount of incurred loss on the credit default swap. The maximum exposure to loss for the securitization entity is the notional value of the derivatives. Certain losses on these credit default swaps would be absorbed by the third-party noteholders of the securitization entity and the remaining losses on the credit default swaps would be absorbed by our portion of the notes issued by the securitization entity.
The following table sets forth our credit default swaps where we sell protection on single name reference entities and the fair values as of the dates indicated:
| 2013 | 2012 | |||||||||||||||||||||||
| (Amounts in millions) |
Notional value |
Assets | Liabilities | Notional value |
Assets | Liabilities | ||||||||||||||||||
| Investment grade |
||||||||||||||||||||||||
| Matures in less than one year |
$ | — | $ | — | $ | — | $ | 116 | $ | — | $ | — | ||||||||||||
| Matures after one year through five years |
39 | 1 | — | — | — | — | ||||||||||||||||||
| Matures after five years through ten years |
— | — | — | 39 | 1 | — | ||||||||||||||||||
|
|
|
|
|
|
|
|
|
|
|
|
|
|||||||||||||
| Total credit default swaps on single name reference entities |
$ | 39 | $ | 1 | $ | — | $ | 155 | $ | 1 | $ | — | ||||||||||||
|
|
|
|
|
|
|
|
|
|
|
|
|
|||||||||||||
267
GENWORTH FINANCIAL, INC.
NOTES TO CONSOLIDATED FINANCIAL STATEMENTS
Years Ended December 31, 2013, 2012 and 2011
The following table sets forth our credit default swaps where we sell protection on credit default swap index tranches and the fair values as of December 31:
| 2013 | 2012 | |||||||||||||||||||||||
| (Amounts in millions) |
Notional value |
Assets | Liabilities | Notional value |
Assets | Liabilities | ||||||||||||||||||
| Original index tranche attachment/detachment point and maturity: |
||||||||||||||||||||||||
| 7% - 15% matures after one year through five years (1) |
$ | 100 | $ | 3 | $ | — | $ | 100 | $ | — | $ | 1 | ||||||||||||
| 9% - 12% matures in less than one year (2) |
— | — | — | 50 | — | — | ||||||||||||||||||
| 9% - 12% matures after one year through five years (2) |
250 | 5 | — | 250 | 2 | — | ||||||||||||||||||
| 10% - 15% matures in less than one year (3) |
250 | 2 | — | — | — | — | ||||||||||||||||||
| 10% - 15% matures after one year through five years (3) |
— | — | — | 250 | 4 | — | ||||||||||||||||||
| 15% - 30% matures after five years through ten years (4) |
— | — | — | 127 | 1 | — | ||||||||||||||||||
|
|
|
|
|
|
|
|
|
|
|
|
|
|||||||||||||
| Total credit default swap index tranches |
600 | 10 | — | 777 | 7 | 1 | ||||||||||||||||||
|
|
|
|
|
|
|
|
|
|
|
|
|
|||||||||||||
| Customized credit default swap index tranches related to securitization entities: |
||||||||||||||||||||||||
| Portion backing third-party borrowings maturing 2017 (5) |
12 | — | 1 | 12 | — | 5 | ||||||||||||||||||
| Portion backing our interest maturing 2017 (6) |
300 | — | 31 | 300 | — | 99 | ||||||||||||||||||
|
|
|
|
|
|
|
|
|
|
|
|
|
|||||||||||||
| Total customized credit default swap index tranches related to securitization entities |
312 | — | 32 | 312 | — | 104 | ||||||||||||||||||
|
|
|
|
|
|
|
|
|
|
|
|
|
|||||||||||||
| Total credit default swaps on index tranches |
$ | 912 | $ | 10 | $ | 32 | $ | 1,089 | $ | 7 | $ | 105 | ||||||||||||
|
|
|
|
|
|
|
|
|
|
|
|
|
|||||||||||||
| (1) | The current attachment/detachment as of December 31, 2013 and 2012 was 7% - 15%. |
| (2) | The current attachment/detachment as of December 31, 2013 and 2012 was 9% - 12%. |
| (3) | The current attachment/detachment as of December 31, 2013 and 2012 was 10% - 15%. |
| (4) | The current attachment/detachment as of December 31, 2013 and 2012 was 14.8% - 30.3%. |
| (5) | Original notional value was $39 million. |
| (6) | Original notional value was $300 million. |
268
GENWORTH FINANCIAL, INC.
NOTES TO CONSOLIDATED FINANCIAL STATEMENTS
Years Ended December 31, 2013, 2012 and 2011
(6) Deferred Acquisition Costs
The following table presents the activity impacting DAC as of and for the years ended December 31:
| (Amounts in millions) |
2013 | 2012 | 2011 | |||||||||
| Unamortized balance as of January 1 |
$ | 5,460 | $ | 5,458 | $ | 5,359 | ||||||
| Impact of foreign currency translation |
(12 | ) | 9 | (8 | ) | |||||||
| Costs deferred |
457 | 611 | 637 | |||||||||
| Amortization, net of interest accretion |
(451 | ) | (618 | ) | (460 | ) | ||||||
| Other (1) |
— | — | (70 | ) | ||||||||
|
|
|
|
|
|
|
|||||||
| Unamortized balance as of December 31 |
5,454 | 5,460 | 5,458 | |||||||||
| Accumulated effect of net unrealized investment (gains) losses |
(176 | ) | (424 | ) | (265 | ) | ||||||
|
|
|
|
|
|
|
|||||||
| Balance as of December 31 |
$ | 5,278 | $ | 5,036 | $ | 5,193 | ||||||
|
|
|
|
|
|
|
|||||||
| (1) | Relates to the sale of our Medicare supplement insurance business in 2011. See note 8 for additional information. |
We regularly review DAC to determine if it is recoverable from future income. As of December 31, 2013, we believe all of our businesses have sufficient future income and therefore the related DAC is recoverable. As part of a life block transaction in the third quarter of 2012, we recorded $39 million of additional DAC amortization to reflect loss recognition on certain term life insurance policies under a reinsurance treaty. As of December 31, 2012, we believe all of our other businesses have sufficient future income and therefore the related DAC was recoverable.
In the first quarter of 2012, we also wrote off $142 million of DAC associated with certain term life insurance policies under a new reinsurance treaty as part of a life block transaction. The write off was included in amortization, net of interest accretion.
The following table presents our intangible assets as of December 31:
| 2013 | 2012 | |||||||||||||||
| (Amounts in millions) |
Gross carrying amount |
Accumulated amortization |
Gross carrying amount |
Accumulated amortization |
||||||||||||
| PVFP |
$ | 2,061 | $ | (1,900 | ) | $ | 1,966 | $ | (1,849 | ) | ||||||
| Capitalized software |
704 | (545 | ) | 658 | (479 | ) | ||||||||||
| Deferred sales inducements to contractholders |
195 | (123 | ) | 137 | (99 | ) | ||||||||||
| Other |
54 | (47 | ) | 78 | (46 | ) | ||||||||||
|
|
|
|
|
|
|
|
|
|||||||||
| Total |
$ | 3,014 | $ | (2,615 | ) | $ | 2,839 | $ | (2,473 | ) | ||||||
|
|
|
|
|
|
|
|
|
|||||||||
Amortization expense related to PVFP, capitalized software and other intangible assets for the years ended December 31, 2013, 2012 and 2011 was $118 million, $104 million and $133 million, respectively. Amortization expense related to deferred sales inducements of $24 million, $29 million and $22 million, respectively, for the years ended December 31, 2013, 2012 and 2011 was included in benefits and other changes in policy reserves.
269
GENWORTH FINANCIAL, INC.
NOTES TO CONSOLIDATED FINANCIAL STATEMENTS
Years Ended December 31, 2013, 2012 and 2011
Present Value of Future Profits
The following table presents the activity in PVFP as of and for the years ended December 31:
| (Amounts in millions) |
2013 | 2012 | 2011 | |||||||||
| Unamortized balance as of January 1 |
$ | 297 | $ | 339 | $ | 430 | ||||||
| Interest accreted at 5.52%, 5.66% and 5.73% |
15 | 18 | 22 | |||||||||
| Amortization |
(66 | ) | (60 | ) | (96 | ) | ||||||
| Other (1) |
— | — | (17 | ) | ||||||||
|
|
|
|
|
|
|
|||||||
| Unamortized balance as of December 31 |
246 | 297 | 339 | |||||||||
| Accumulated effect of net unrealized investment (gains) losses |
(85 | ) | (180 | ) | (174 | ) | ||||||
|
|
|
|
|
|
|
|||||||
| Balance as of December 31 |
$ | 161 | $ | 117 | $ | 165 | ||||||
|
|
|
|
|
|
|
|||||||
| (1) | Relates to the sale of the Medicare supplement insurance business in 2011. See note 8 for additional information. |
The percentage of the December 31, 2013 PVFP balance net of interest accretion, before the effect of unrealized investment gains or losses, estimated to be amortized over each of the next five years is as follows:
| 2014 |
9.8 | % | ||
| 2015 |
10.3 | % | ||
| 2016 |
10.1 | % | ||
| 2017 |
9.2 | % | ||
| 2018 |
7.9 | % |
Amortization expense for PVFP in future periods will be affected by acquisitions, dispositions, net investment gains (losses) or other factors affecting the ultimate amount of gross profits realized from certain lines of business. Similarly, future amortization expense for other intangibles will depend on future acquisitions, dispositions and other business transactions.
270
GENWORTH FINANCIAL, INC.
NOTES TO CONSOLIDATED FINANCIAL STATEMENTS
Years Ended December 31, 2013, 2012 and 2011
Goodwill
The following is a summary of our goodwill balance by segment and Corporate and Other activities as of the dates indicated:
| (Amounts in millions) |
U.S. Life Insurance |
International Mortgage Insurance |
U.S. Mortgage Insurance |
International Protection |
Runoff | Corporate and Other |
Total | |||||||||||||||||||||
| Balance as of December 31, 2011: |
||||||||||||||||||||||||||||
| Gross goodwill |
$ | 1,034 | $ | 19 | $ | 22 | $ | 90 | $ | 70 | $ | 29 | $ | 1,264 | ||||||||||||||
| Accumulated impairment losses |
(185 | ) | — | (22 | ) | — | (70 | ) | (29 | ) | (306 | ) | ||||||||||||||||
|
|
|
|
|
|
|
|
|
|
|
|
|
|
|
|||||||||||||||
| Goodwill |
849 | 19 | — | 90 | — | — | 958 | |||||||||||||||||||||
|
|
|
|
|
|
|
|
|
|
|
|
|
|
|
|||||||||||||||
| Impairment losses |
— | — | — | (89 | ) | — | — | (89 | ) | |||||||||||||||||||
| Foreign exchange translation |
— | — | — | (1 | ) | — | — | (1 | ) | |||||||||||||||||||
|
|
|
|
|
|
|
|
|
|
|
|
|
|
|
|||||||||||||||
| Balance as of December 31, 2012: |
||||||||||||||||||||||||||||
| Gross goodwill |
1,034 | 19 | 22 | 89 | 70 | 29 | 1,263 | |||||||||||||||||||||
| Accumulated impairment losses |
(185 | ) | — | (22 | ) | (89 | ) | (70 | ) | (29 | ) | (395 | ) | |||||||||||||||
|
|
|
|
|
|
|
|
|
|
|
|
|
|
|
|||||||||||||||
| Goodwill |
849 | 19 | — | — | — | — | 868 | |||||||||||||||||||||
|
|
|
|
|
|
|
|
|
|
|
|
|
|
|
|||||||||||||||
| Foreign exchange translation |
— | (1 | ) | — | — | — | — | (1 | ) | |||||||||||||||||||
|
|
|
|
|
|
|
|
|
|
|
|
|
|
|
|||||||||||||||
| Balance as of December 31, 2013: |
||||||||||||||||||||||||||||
| Gross goodwill |
1,034 | 18 | 22 | 89 | 70 | — | 1,233 | |||||||||||||||||||||
| Accumulated impairment losses |
(185 | ) | — | (22 | ) | (89 | ) | (70 | ) | — | (366 | ) | ||||||||||||||||
|
|
|
|
|
|
|
|
|
|
|
|
|
|
|
|||||||||||||||
| Goodwill |
$ | 849 | $ | 18 | $ | — | $ | — | $ | — | $ | — | $ | 867 | ||||||||||||||
|
|
|
|
|
|
|
|
|
|
|
|
|
|
|
|||||||||||||||
Goodwill impairment losses
There were no goodwill impairment charges recorded in 2013.
During the third quarter of 2012, as part of our annual goodwill impairment analysis based on data as of July 1, 2012, we recorded a goodwill impairment of $89 million associated with our international protection reporting unit. Considering current market conditions, including the market environment in Europe and lower trading multiples of European financial services companies, and the impact of those conditions on our international protection reporting unit in a market transaction that may require a higher risk premium, we determined the fair value of the reporting unit was below book value and determined the goodwill associated with this reporting unit was not recoverable. Therefore, we recognized a goodwill impairment for all of the goodwill associated with our international protection reporting unit during the third quarter of 2012.
During the fourth quarter of 2011, as a result of our reorganized operating segments, our reverse mortgage business was newly identified as a separate reporting unit. Previously, this business was a component of the long-term care insurance reporting unit. Due to historical business performance and recent adverse developments within the industry that negatively impacted the valuation of the business, we impaired all of the goodwill related to our reverse mortgage business reported in Corporate and Other activities in the fourth quarter of 2011. The key assumptions utilized in this valuation included expected future business performance and the discount rate, both of which were adversely impacted as a result of the recent industry developments.
271
GENWORTH FINANCIAL, INC.
NOTES TO CONSOLIDATED FINANCIAL STATEMENTS
Years Ended December 31, 2013, 2012 and 2011
Deteriorating or adverse market conditions for certain businesses may have a significant impact on the fair value of our reporting units and could result in future impairments of goodwill.
Dispositions
Effective October 1, 2011, we completed the sale of our Medicare supplement insurance business for total proceeds of $276 million. The sale resulted in an after-tax gain of $36 million. Our Medicare supplement insurance business was included in our Runoff segment. The transaction included the sale of Continental Life Insurance Company of Brentwood, Tennessee and its subsidiary, American Continental Insurance Company, and the reinsurance of the Medicare supplement insurance in-force business written by other Genworth life insurance subsidiaries.
Effective April 1, 2013 (immediately prior to the holding company reorganization), Genworth Holdings completed the sale of its reverse mortgage business (which had been part of Corporate and Other activities) for total proceeds of $22 million. The gain on the sale was not significant.
We reinsure a portion of our policy risks to other insurance companies in order to reduce our ultimate losses, diversify our exposures and provide capital flexibility. We also assume certain policy risks written by other insurance companies. Reinsurance accounting is followed for assumed and ceded transactions when there is adequate risk transfer. Otherwise, the deposit method of accounting is followed.
Reinsurance does not relieve us from our obligations to policyholders. In the event that the reinsurers are unable to meet their obligations, we remain liable for the reinsured claims. We monitor both the financial condition of individual reinsurers and risk concentrations arising from similar geographic regions, activities and economic characteristics of reinsurers to lessen the risk of default by such reinsurers. Other than the relationship discussed below with Union Fidelity Life Insurance Company (“UFLIC”), we do not have significant concentrations of reinsurance with any one reinsurer that could have a material impact on our financial position.
As of December 31, 2013, the maximum amount of individual ordinary life insurance normally retained by us on any one individual life policy was $5 million.
We have several significant reinsurance transactions (“Reinsurance Transactions”) with UFLIC. In these transactions, we ceded to UFLIC in-force blocks of structured settlements issued prior to 2004, substantially all of our in-force blocks of variable annuities issued prior to 2004 and a block of long-term care insurance policies that we reinsured in 2000 from MetLife Insurance Company of Connecticut. Although we remain directly liable under these contracts and policies as the ceding insurer, the Reinsurance Transactions have the effect of transferring the financial results of the reinsured blocks to UFLIC. As of December 31, 2013 and 2012, we had a reinsurance recoverable of $14,622 million and $14,725 million, respectively, associated with those Reinsurance Transactions.
To secure the payment of its obligations to us under the reinsurance agreements governing the Reinsurance Transactions, UFLIC has established trust accounts to maintain an aggregate amount of assets with a statutory book value at least equal to the statutory general account reserves attributable to the reinsured business less an amount required to be held in certain claims paying accounts. A trustee administers the trust accounts and we are permitted to withdraw from the trust accounts amounts due to us pursuant to the terms of the reinsurance
272
GENWORTH FINANCIAL, INC.
NOTES TO CONSOLIDATED FINANCIAL STATEMENTS
Years Ended December 31, 2013, 2012 and 2011
agreements that are not otherwise paid by UFLIC. In addition, pursuant to a Capital Maintenance Agreement, General Electric Capital Corporation, an indirect subsidiary of General Electric Company (“GE”), agreed to maintain sufficient capital in UFLIC to maintain UFLIC’s risk-based capital (“RBC”) at not less than 150% of its company action level, as defined from time to time by the NAIC.
Under the terms of certain reinsurance agreements that our life insurance subsidiaries have with external parties, we pledged assets in either separate portfolios or in trust for the benefit of external reinsurers. These assets support the reserves ceded to those external reinsurers. We had pledged fixed maturity securities and commercial mortgage loans of $7,823 million and $603 million, respectively, as of December 31, 2013 and $9,313 million and $895 million, respectively, as of December 31, 2012 in connection with these reinsurance agreements. However, we maintain the ability to substitute these pledged assets for other qualified collateral, and may use, commingle, encumber or dispose of any portion of the collateral as long as there is no event of default and the remaining qualified collateral is sufficient to satisfy the collateral maintenance level.
The following table sets forth net domestic life insurance in-force as of December 31:
| (Amounts in millions) |
2013 | 2012 | 2011 | |||||||||
| Direct life insurance in-force |
$ | 708,271 | $ | 730,016 | $ | 719,094 | ||||||
| Amounts assumed from other companies |
1,070 | 1,148 | 1,239 | |||||||||
| Amounts ceded to other companies (1) |
(313,593 | ) | (331,909 | ) | (240,019 | ) | ||||||
|
|
|
|
|
|
|
|||||||
| Net life insurance in-force |
$ | 395,748 | $ | 399,255 | $ | 480,314 | ||||||
|
|
|
|
|
|
|
|||||||
| Percentage of amount assumed to net |
— | % | — | % | — | % | ||||||
|
|
|
|
|
|
|
|||||||
| (1) | Includes amounts accounted for under the deposit method. |
273
GENWORTH FINANCIAL, INC.
NOTES TO CONSOLIDATED FINANCIAL STATEMENTS
Years Ended December 31, 2013, 2012 and 2011
The following table sets forth the effects of reinsurance on premiums written and earned for the years ended December 31:
| Written | Earned | |||||||||||||||||||||||
| (Amounts in millions) |
2013 | 2012 | 2011 | 2013 | 2012 | 2011 | ||||||||||||||||||
| Direct: |
||||||||||||||||||||||||
| Life insurance |
$ | 1,199 | $ | 1,284 | $ | 1,351 | $ | 1,214 | $ | 1,304 | $ | 1,370 | ||||||||||||
| Accident and health insurance |
2,944 | 2,853 | 2,893 | 2,945 | 2,840 | 2,912 | ||||||||||||||||||
| Property and casualty insurance |
97 | 95 | 121 | 85 | 84 | 111 | ||||||||||||||||||
| Mortgage insurance |
1,682 | 1,720 | 1,599 | 1,608 | 1,645 | 1,704 | ||||||||||||||||||
|
|
|
|
|
|
|
|
|
|
|
|
|
|||||||||||||
| Total direct |
5,922 | 5,952 | 5,964 | 5,852 | 5,873 | 6,097 | ||||||||||||||||||
|
|
|
|
|
|
|
|
|
|
|
|
|
|||||||||||||
| Assumed: |
||||||||||||||||||||||||
| Life insurance |
9 | 9 | 12 | 8 | 7 | 11 | ||||||||||||||||||
| Accident and health insurance |
403 | 419 | 426 | 414 | 440 | 492 | ||||||||||||||||||
| Property and casualty insurance |
— | — | — | — | — | — | ||||||||||||||||||
| Mortgage insurance |
19 | 27 | 23 | 33 | 42 | 44 | ||||||||||||||||||
|
|
|
|
|
|
|
|
|
|
|
|
|
|||||||||||||
| Total assumed |
431 | 455 | 461 | 455 | 489 | 547 | ||||||||||||||||||
|
|
|
|
|
|
|
|
|
|
|
|
|
|||||||||||||
| Ceded: |
||||||||||||||||||||||||
| Life insurance |
(342 | ) | (528 | ) | (254 | ) | (343 | ) | (527 | ) | (254 | ) | ||||||||||||
| Accident and health insurance |
(735 | ) | (690 | ) | (549 | ) | (725 | ) | (672 | ) | (564 | ) | ||||||||||||
| Property and casualty insurance |
— | — | — | — | — | — | ||||||||||||||||||
| Mortgage insurance |
(92 | ) | (132 | ) | (143 | ) | (91 | ) | (122 | ) | (138 | ) | ||||||||||||
|
|
|
|
|
|
|
|
|
|
|
|
|
|||||||||||||
| Total ceded |
(1,169 | ) | (1,350 | ) | (946 | ) | (1,159 | ) | (1,321 | ) | (956 | ) | ||||||||||||
|
|
|
|
|
|
|
|
|
|
|
|
|
|||||||||||||
| Net premiums |
$ | 5,184 | $ | 5,057 | $ | 5,479 | $ | 5,148 | $ | 5,041 | $ | 5,688 | ||||||||||||
|
|
|
|
|
|
|
|
|
|
|
|
|
|||||||||||||
| Percentage of amount assumed to net |
9 | % | 10 | % | 10 | % | ||||||||||||||||||
|
|
|
|
|
|
|
|||||||||||||||||||
Reinsurance recoveries recognized as a reduction of benefits and other changes in policy reserves amounted to $2,645 million, $2,951 million and $2,492 million during 2013, 2012 and 2011, respectively.
274
GENWORTH FINANCIAL, INC.
NOTES TO CONSOLIDATED FINANCIAL STATEMENTS
Years Ended December 31, 2013, 2012 and 2011
Future Policy Benefits
The following table sets forth our recorded liabilities and the major assumptions underlying our future policy benefits as of December 31:
| (Amounts in millions) |
Mortality/ morbidity assumption |
Interest rate assumption |
2013 | 2012 | ||||||||||||
| Long-term care insurance contracts |
(a | ) | 3.75% - 7.5% | $ | 17,023 | $ | 16,111 | |||||||||
| Structured settlements with life contingencies |
(b | ) | 1.5% - 8.0% | 9,267 | 9,398 | |||||||||||
| Annuity contracts with life contingencies |
(b | ) | 1.5% - 8.0% | 4,425 | 4,977 | |||||||||||
| Traditional life insurance contracts |
(c | ) | 3.0% - 7.5% | 2,736 | 2,762 | |||||||||||
| Supplementary contracts with life contingencies |
(b | ) | 1.5% - 8.0% | 249 | 251 | |||||||||||
| Accident and health insurance contracts |
(d | ) | 3.5% - 7.0% | 5 | 6 | |||||||||||
|
|
|
|
|
|||||||||||||
| Total future policy benefits |
$ | 33,705 | $ | 33,505 | ||||||||||||
|
|
|
|
|
|||||||||||||
| (a) | The 1983 Individual Annuitant Mortality Table or 2000 U.S. Annuity Table, or 1983 Group Annuitant Mortality Table and the 1985 National Nursing Home Study and company experience. |
| (b) | Assumptions for limited-payment contracts come from either the U.S. Population Table, 1983 Group Annuitant Mortality Table, 1983 Individual Annuitant Mortality Table or Annuity 2000 Mortality Table. |
| (c) | Principally modifications of the Society of Actuaries 1965-70 or 1975-80 Select and Ultimate Tables, 1941, 1958, 1980 and 2001 Commissioner’s Standard Ordinary Tables, 1980 Commissioner’s Extended Term table and (IA) Standard Table 1996 (modified). |
| (d) | The 1958 and 1980 Commissioner’s Standard Ordinary Tables, or 2000 U.S. Annuity Table, or 1983 Group Annuitant Mortality. |
Assumptions as to persistency are based on company experience.
Policyholder Account Balances
The following table sets forth our recorded liabilities for policyholder account balances as of December 31:
| (Amounts in millions) |
2013 | 2012 | ||||||
| Annuity contracts |
$ | 13,730 | $ | 13,323 | ||||
| GICs, funding agreements and FABNs |
896 | 2,152 | ||||||
| Structured settlements without life contingencies |
1,956 | 2,078 | ||||||
| Supplementary contracts without life contingencies |
714 | 691 | ||||||
| Other |
34 | 36 | ||||||
|
|
|
|
|
|||||
| Total investment contracts |
17,330 | 18,280 | ||||||
| Universal life insurance contracts |
8,198 | 7,982 | ||||||
|
|
|
|
|
|||||
| Total policyholder account balances |
$ | 25,528 | $ | 26,262 | ||||
|
|
|
|
|
|||||
275
GENWORTH FINANCIAL, INC.
NOTES TO CONSOLIDATED FINANCIAL STATEMENTS
Years Ended December 31, 2013, 2012 and 2011
Certain of our U.S. life insurance companies are members of the Federal Home Loan Bank (the “FHLB”) system in their respective regions. As of December 31, 2013 and 2012, we held $70 million and $87 million, respectively, of FHLB common stock related to those memberships which was included in equity securities. We have outstanding funding agreements with the FHLBs and also have letters of credit which have not been drawn upon. The FHLBs have been granted a lien on certain of our invested assets to collateralize our obligations; however, we maintain the ability to substitute these pledged assets for other qualified collateral, and may use, commingle, encumber or dispose of any portion of the collateral as long as there is no event of default and the remaining qualified collateral is sufficient to satisfy the collateral maintenance level. Upon any event of default by us, the FHLB’s recovery on the collateral is limited to the amount of our funding agreement liabilities to the FHLB. The amount of funding agreements outstanding with the FHLB was $493 million and $696 million, respectively, as of December 31, 2013 and 2012 which was included in policyholder account balances. We had letters of credit related to the FHLB of $583 million and $483 million, respectively, as of December 31, 2013 and 2012. These funding agreements and letters of credit were collateralized by fixed maturity securities with a fair value of $1,153 million and $1,308 million, respectively, as of December 31, 2013 and 2012.
Certain Nontraditional Long-Duration Contracts
The following table sets forth information about our variable annuity products with death and living benefit guarantees as of December 31:
| (Dollar amounts in millions) |
2013 | 2012 | ||||||
| Account values with death benefit guarantees (net of reinsurance): |
||||||||
| Standard death benefits (return of net deposits) account value |
$ | 3,164 | $ | 3,059 | ||||
| Net amount at risk |
$ | 6 | $ | 17 | ||||
| Average attained age of contractholders |
72 | 71 | ||||||
| Enhanced death benefits (ratchet, rollup) account value |
$ | 3,853 | $ | 3,906 | ||||
| Net amount at risk |
$ | 114 | $ | 217 | ||||
| Average attained age of contractholders |
72 | 71 | ||||||
| Account values with living benefit guarantees: |
||||||||
| GMWBs |
$ | 4,054 | $ | 4,020 | ||||
| Guaranteed annuitization benefits |
$ | 1,508 | $ | 1,470 | ||||
Variable annuity contracts may contain more than one death or living benefit; therefore, the amounts listed above are not mutually exclusive. Substantially all of our variable annuity contracts have some form of GMDB.
As of December 31, 2013 and 2012, our total liability associated with variable annuity contracts with minimum guarantees was approximately $7,704 million and $7,790 million, respectively. The liability, net of reinsurance, for our variable annuity contracts with GMDB and guaranteed annuitization benefits was $39 million and $35 million as of December 31, 2013 and 2012, respectively.
The contracts underlying the lifetime benefits such as GMWB and guaranteed annuitization benefits are considered “in the money” if the contractholder’s benefit base, or the protected value, is greater than the account value. As of December 31, 2013 and 2012, our exposure related to GMWB and guaranteed annuitization benefit contracts that were considered “in the money” was $467 million and $902 million, respectively. For GMWBs and guaranteed annuitization benefits, the only way the contractholder can monetize the excess of the benefit base over the account value of the contract is through lifetime withdrawals or lifetime income payments after annuitization.
276
GENWORTH FINANCIAL, INC.
NOTES TO CONSOLIDATED FINANCIAL STATEMENTS
Years Ended December 31, 2013, 2012 and 2011
Account balances of variable annuity contracts with death or living benefit guarantees were invested in separate account investment options as follows as of December 31:
| (Amounts in millions) |
2013 | 2012 | ||||||
| Balanced funds |
$ | 4,327 | $ | 4,264 | ||||
| Equity funds |
1,624 | 1,497 | ||||||
| Bond funds |
931 | 1,069 | ||||||
| Money market funds |
181 | 175 | ||||||
| Other |
8 | 7 | ||||||
|
|
|
|
|
|||||
| Total |
$ | 7,071 | $ | 7,012 | ||||
|
|
|
|
|
|||||
277
GENWORTH FINANCIAL, INC.
NOTES TO CONSOLIDATED FINANCIAL STATEMENTS
Years Ended December 31, 2013, 2012 and 2011
(11) Liability for Policy and Contract Claims
The following table sets forth changes in the liability for policy and contract claims for the dates indicated:
| (Amounts in millions) |
2013 | 2012 | 2011 | |||||||||
| Beginning as of January 1 |
$ | 7,509 | $ | 7,620 | $ | 6,933 | ||||||
| Less reinsurance recoverables |
(1,722 | ) | (1,654 | ) | (1,654 | ) | ||||||
|
|
|
|
|
|
|
|||||||
| Net balance as of January 1 |
5,787 | 5,966 | 5,279 | |||||||||
|
|
|
|
|
|
|
|||||||
| Incurred related to insured events of: |
||||||||||||
| Current year (1) |
3,026 | 3,405 | 3,562 | |||||||||
| Prior years (2) |
(44 | ) | 237 | 651 | ||||||||
|
|
|
|
|
|
|
|||||||
| Total incurred |
2,982 | 3,642 | 4,213 | |||||||||
|
|
|
|
|
|
|
|||||||
| Paid related to insured events of: |
||||||||||||
| Current year |
(1,020 | ) | (1,196 | ) | (1,238 | ) | ||||||
| Prior years |
(2,526 | ) | (2,790 | ) | (2,379 | ) | ||||||
|
|
|
|
|
|
|
|||||||
| Total paid |
(3,546 | ) | (3,986 | ) | (3,617 | ) | ||||||
|
|
|
|
|
|
|
|||||||
| Interest on liability for policy and contract claims |
176 | 153 | 136 | |||||||||
| Foreign currency translation |
(30 | ) | 12 | (17 | ) | |||||||
| Other (3) |
— | — | (28 | ) | ||||||||
|
|
|
|
|
|
|
|||||||
| Net balance as of December 31 |
5,369 | 5,787 | 5,966 | |||||||||
| Add reinsurance recoverables |
1,835 | 1,722 | 1,654 | |||||||||
|
|
|
|
|
|
|
|||||||
| Balance as of December 31 |
$ | 7,204 | $ | 7,509 | $ | 7,620 | ||||||
|
|
|
|
|
|
|
|||||||
| (1) | For the year ended December 31, 2013, current year reserves related to our U.S. Mortgage Insurance segment were reduced by loss mitigation activities of $66 million, including $65 million related to workouts, loan modifications and pre-sales, and $1 million related to rescissions, net of reinstatements. For the year ended December 31, 2012, current year reserves related to our U.S. Mortgage Insurance segment were reduced by loss mitigation activities of $73 million, including $70 million related to workouts, loan modifications and pre-sales, and $3 million related to rescissions, net of reinstatements. For the year ended December 31, 2011, current year reserves related to our U.S. Mortgage Insurance segment were reduced by loss mitigation activities of $95 million, including $88 million related to workouts, loan modifications and pre-sales, and $7 million related to rescissions, net of reinstatements. |
| (2) | Loss mitigation actions related to prior year delinquencies resulted in a reduction of expected losses in prior year reserves of $497 million for the year ended December 31, 2013, including $486 million related to workouts, loan modifications and pre-sales, and $11 million related to rescissions, net of reinstatements of $13 million. Loss mitigation actions related to prior year delinquencies resulted in a reduction of expected losses in prior year reserves of $601 million for the year ended December 31, 2012, including $574 million related to workouts, loan modifications and pre-sales, and $27 million related to rescissions, net of reinstatements of $31 million. Loss mitigation actions related to prior year delinquencies resulted in a reduction of expected losses in prior year reserves of $472 million for the year ended December 31, 2011, including $434 million related to workouts, loan modifications and pre-sales, and $38 million related to rescissions, net of reinstatements of $84 million. |
| (3) | The amounts relate to the sale of our Medicare supplement insurance business in 2011. See note 8 for additional information. |
278
GENWORTH FINANCIAL, INC.
NOTES TO CONSOLIDATED FINANCIAL STATEMENTS
Years Ended December 31, 2013, 2012 and 2011
As described in note 2, we establish reserves for the ultimate cost of settling claims on reported and unreported insured events that have occurred on or before the respective reporting period. These liabilities are associated primarily with our mortgage, lifestyle protection and long-term care insurance products and represent our best estimates of the liabilities at the time based on known facts, historical trends of claim payments and other external factors, such as various trends in economic conditions, housing prices, employment rates, mortality, morbidity and medical costs.
While the liability for policy and contract claims represents our current best estimates, there may be additional adjustments to these amounts based on information and trends not presently known. Such adjustments, reflecting any variety of new and adverse or favorable trends, could possibly be significant, exceeding the currently recorded reserves by an amount that could be material to our results of operations, financial condition and liquidity.
2013
For 2013, the decrease in the ending liability for policy and contract claims was primarily related to our U.S. Mortgage Insurance segment and our International Mortgage Insurance segment, partially offset by an increase in our long-term insurance business. In 2013, the liability in our U.S. Mortgage Insurance segment decreased to $1,482 million from $2,009 million as of December 31, 2012 due to lower new delinquencies and improvements in net cures and aging on existing delinquencies in 2013. Loss mitigation actions that occurred during 2013 resulted in a reduction of expected losses of $563 million. In 2013, the liability in our International Mortgage Insurance segment decreased to $378 million from $516 million as of December 31, 2012 primarily from a prior year reserve strengthening in our Australian mortgage insurance business due to higher than anticipated frequency and severity of claims paid from later stage delinquencies that did not recur and from lower new delinquencies in 2013. Partially offsetting these decreases was an increase in the liability in our long-term care insurance business which increased to $4,999 million from $4,655 million as of December 31, 2012 largely from growth and aging of the in-force block.
We experienced lower levels of incurred losses primarily in our U.S. mortgage, international mortgage and life insurance businesses, which decreased by $313 million, $201 million and $132 million, respectively, from 2012 to 2013. Incurred losses in our U.S. mortgage insurance business have moderated due to lower new delinquencies and improvements in net cures and aging on existing delinquencies in 2013. Our international mortgage insurance business improved in Australia and Canada primarily as a result of lower new delinquencies in 2013. In Australia, the prior year reserve strengthening due to higher than anticipated frequency and severity of claims paid from later stage delinquencies did not recur. Our life insurance business improved as a result of continued mortality improvement in 2013.
During 2013, we also paid lower claims in our U.S. mortgage, life and international mortgage insurance businesses of $202 million, $196 million and $144 million, respectively. Paid claims in our U.S. mortgage insurance business have moderated due to lower new delinquencies and improvements in net cures and aging on existing delinquencies in 2013. Lower paid claims in our life insurance business were a result of continued mortality improvement in 2013 compared to 2012 and lower severity in 2013. In our international mortgage insurance business, Australia and Canada also had lower paid claims primarily as a result of a decline in the number of claims as well as the average paid claim amount in 2013. These decreases were partially offset by an increase of $111 million in paid claims of our long-term care insurance business from the aging and growth of our in-force block.
During 2013, we reduced our prior year reserves by $44 million as a result of changes in estimates related to prior year insured events and the development of information and trends not previously known when establishing
279
GENWORTH FINANCIAL, INC.
NOTES TO CONSOLIDATED FINANCIAL STATEMENTS
Years Ended December 31, 2013, 2012 and 2011
the reserves in prior periods. Of this amount, we decreased prior year claim reserves related to our U.S. Mortgage Insurance segment by $63 million from $2,009 million as of December 31, 2012 primarily from improvements in net cures in 2013. For our other businesses, the remaining unfavorable development of $19 million in 2013 related to refinements to our estimates as part of our reserving process on both reported and unreported insured events occurring in the prior year that were not significant.
2012
For 2012, the decrease in the ending liability for policy and contract claims was primarily related to our U.S. Mortgage Insurance segment and our life insurance business, partially offset by an increase in our long-term insurance business. In 2012, the liability in our U.S. Mortgage Insurance segment decreased to $2,009 million from $2,488 million as of December 31, 2011 due to lower new delinquencies in 2012, increased loss mitigation efforts and a reserve strengthening in 2011 that did not recur, partially offset by the continued aging of delinquencies. In 2012, the liability in our life insurance business decreased to $175 million from $253 million as of December 31, 2011 due primarily to lower claim frequency and severity in 2012 compared to 2011. Partially offsetting these decreases was an increase in the liability in our long-term care insurance business which increased to $4,655 million from $4,130 million as of December 31, 2011 largely from growth and aging of the in-force block, an increase in severity and duration of claims associated with observed loss development and higher average reserve costs on new claims in 2012.
During 2012, we strengthened our prior year reserves by $237 million as a result of changes in estimates related to prior year insured events and the development of information and trends not previously known when establishing the reserves in prior periods. Of this amount, we increased prior year claim reserves in our International Mortgage Insurance segment by $142 million from $553 million as of December 31, 2011. During 2012, our Australian mortgage insurance business strengthened reserves due to higher than anticipated frequency and severity of claims paid from later stage delinquencies from prior years, particularly in coastal tourism areas of Queensland as a result of regional economic pressures as well as our 2007 and 2008 vintages which have a higher concentration of self-employed borrowers. In 2012, we also increased prior year claim reserves related to our long-term care insurance business by $93 million from $4,130 million as of December 31, 2011. We experienced an increase in severity and duration of claims associated with observed loss development, particularly in older issued policies, partially offset by refinements to our estimated claim reserves. For our other businesses, the remaining unfavorable development of $2 million in 2012 related to refinements to our estimates as part of our reserving process on both reported and unreported insured events occurring in the prior year that were not significant.
2011
For 2011, the increase in the ending liability for policy and contract claims was primarily related to our long-term care insurance business due to growth and aging of the in-force block and claims experience including the severity and duration of existing claims, particularly in older issued policies. In addition, our U.S. Mortgage Insurance segment increased the ending liability due primarily to a reserve strengthening in the second quarter of 2011, partially offset by lower new delinquencies in 2011 along with stable aging of existing delinquencies in the second half of 2011. The decline in paid claims was primarily driven by lower claim counts and lower average claim payments reflecting lower loan balances, partially offset by lower benefits from our captive reinsurance arrangements.
During 2011, we strengthened our prior year reserves by $651 million as a result of changes in estimates related to prior year insured events and the development of information and trends not previously known when
280
GENWORTH FINANCIAL, INC.
NOTES TO CONSOLIDATED FINANCIAL STATEMENTS
Years Ended December 31, 2013, 2012 and 2011
establishing the reserves in prior periods. Of this amount, we increased prior year claim reserves in our U.S. Mortgage Insurance segment by $415 million from $2,282 million as of December 31, 2010. During 2011, we strengthened reserves due to worsening trends in recent experience as well as market trends in an environment of continuing weakness in the U.S. residential real estate market. These trends reflected a decline in cure rates in the second half of 2011 for delinquent loans and continued aging trends in the delinquent loan inventory. These trends were associated with a range of factors, including slow-moving pipelines of mortgages in some stage of foreclosure and delinquent loans under consideration for loan modifications. Specifically, reduced cure rates were driven by lower borrower self-cures and lower levels of lender loan modifications outside of government-sponsored modification programs. The decline in cure rates was also concentrated in earlier term delinquencies at a level higher than expected or historically experienced. In our U.S. Mortgage Insurance segment, loss mitigation actions that occurred during 2011 resulted in a reduction of expected losses of $567 million. In 2011, we also increased prior year claim reserves related to our long-term care insurance business by $232 million from $3,633 million as of December 31, 2010. We experienced an increase in severity and duration of claims associated with observed loss development, particularly in older issued policies along with refinements to our estimated claim reserves all of which contributed to the reserve increase. For our other businesses, the remaining unfavorable development of $4 million in 2011 related to refinements to our estimates as part of our reserving process on both reported and unreported insured events occurring in the prior year that were not significant.
(a) Pension and Retiree Health and Life Insurance Benefit Plans
Essentially all of our employees are enrolled in a qualified defined contribution pension plan. The plan is 100% funded by Genworth. We make annual contributions to each employee’s pension plan account based on the employee’s age, service and eligible pay. Employees are vested in the plan after three years of service. In addition, certain employees also participate in non-qualified defined contribution plans and in qualified and non-qualified defined benefit pension plans. The plan assets, projected benefit obligation and accumulated benefit obligation liabilities of these defined benefit pension plans were not material to our consolidated financial statements individually or in the aggregate. As of December 31, 2013 and 2012, we recorded a liability related to these benefits of $38 million and $69 million, respectively. In 2013, we recognized an increase of $23 million in OCI. In 2012, we recognized a decrease of $8 million in OCI related to these plans. In 2013, we also recognized a $4 million gain for the closure of the U.K. pension plan to future service accruals.
We provide retiree health benefits to domestic employees hired prior to January 1, 2005 who meet certain service requirements. Under this plan, retirees over 65 years of age receive a subsidy towards the purchase of a Medigap policy, and retirees under 65 years of age receive medical benefits similar to our employees’ medical benefits. In December 2009, we announced that eligibility for retiree medical benefits will be limited to associates who are within 10 years of retirement eligibility as of January 1, 2010. This resulted in a negative plan amendment which will be amortized over the average future service of the participants. We also provide retiree life and long-term care insurance benefits. The plans are funded as claims are incurred. As of December 31, 2013 and 2012, the accumulated postretirement benefit obligation associated with these benefits was $79 million and $88 million, respectively, which we accrued in other liabilities in the consolidated balance sheets. In 2013, we recognized an increase of $11 million in OCI. In 2012, we recognized a decrease of $3 million in OCI related to these benefits. In 2013, we also recognized a $1 million gain related to reduced benefit costs driven by fewer participants due to the sale of our wealth management and reverse mortgage businesses and an expense reduction plan announced in June 2013.
Our cost associated with our pension, retiree health and life insurance benefit plans was $22 million, $28 million and $27 million for the years ended December 31, 2013, 2012 and 2011, respectively.
281
GENWORTH FINANCIAL, INC.
NOTES TO CONSOLIDATED FINANCIAL STATEMENTS
Years Ended December 31, 2013, 2012 and 2011
(b) Savings Plans
Our domestic employees participate in qualified and non-qualified defined contribution savings plans that allow employees to contribute a portion of their pay to the plan on a pre-tax basis. We match these contributions, which vest immediately, up to 6% of the employee’s pay. Employees hired on or after January 1, 2011 will not vest immediately in Genworth matching contributions but will fully vest in the matching contributions after two complete years of service. One option available to employees in the defined contribution savings plan is the ClearCourse® variable annuity option offered by certain of our life insurance subsidiaries. The amount of deposits recorded by our life insurance subsidiaries in 2013 and 2012 in relation to this plan option was $1 million for each year. Employees also have the option of purchasing a fund which invests primarily in Genworth stock as part of the defined contribution plan. Our cost associated with these plans was $17 million, $20 million and $19 million for the years ended December 31, 2013, 2012 and 2011, respectively.
(c) Health and Welfare Benefits for Active Employees
We provide health and welfare benefits to our employees, including health, life, disability, dental and long-term care insurance. Our long-term care insurance is provided through our group long-term care insurance business. The premiums recorded by these businesses related to these benefits were insignificant during 2013, 2012 and 2011.
(13) Borrowings and Other Financings
(a) Short-Term Borrowings
Commercial Paper Facility
In the second quarter of 2013, we terminated our $1.0 billion commercial paper program. There was no amount outstanding under the commercial paper program when terminated and none outstanding since February 2009.
Revolving Credit Facility
In September 2013, Genworth Financial and Genworth Holdings entered into a Credit Agreement (the “Credit Agreement”) which provides Genworth Holdings with a $300 million multicurrency revolving credit facility, with a $100 million sublimit for letters of credit. The credit facility is available on a revolving basis until September 26, 2016, unless the commitments are terminated earlier either at the request of Genworth Holdings or by the lenders as a result of any event of default. On no more than two occasions during the term of the facility, Genworth Holdings may request each lender to extend the maturity date of its commitment for an additional one-year period. Genworth Holdings’ request will be granted if lenders (including any new lenders replacing non-consenting lenders) holding more than 50% of the commitments consent to the requested extension(s). The proceeds of the loans may be used for working capital and general corporate purposes. As of December 31, 2013, there was no amount outstanding under the credit facility. The obligations under the Credit Agreement are unsecured and payment of Genworth Holdings’ obligations is fully and unconditionally guaranteed by Genworth Financial.
Any borrowings under the revolving credit facility will bear interest at a rate per annum equal to, at the option of Genworth Holdings, (i) a rate based on the greater of JPMorgan Chase Bank N.A.’s prime rate, the federal funds rate and the one-month adjusted London interbank offered rate from time to time, or (ii) with respect to euro currency borrowings, a rate based on the London interbank offered rate from time to time, plus in
282
GENWORTH FINANCIAL, INC.
NOTES TO CONSOLIDATED FINANCIAL STATEMENTS
Years Ended December 31, 2013, 2012 and 2011
each case a margin that fluctuates based upon the ratings assigned from time to time by Moody’s Investors Service, Inc. and Standard & Poor’s Rating Group to Genworth Holdings’ senior unsecured long-term indebtedness for borrowed money that is not guaranteed by any other person other than Genworth Financial or subject to any other credit enhancement. Genworth Holdings will also pay a commitment fee at a rate that varies with Genworth Holdings’ senior unsecured long-term indebtedness ratings and that is calculated on the average daily unused amount of the commitments, payable quarterly in arrears.
The Credit Agreement contains representations, warranties, covenants, terms and conditions customary for transactions of this type. These include negative covenants limiting the ability of Genworth Holdings and its subsidiaries, to: (1) create liens other than permitted liens; (2) in the case of Genworth Holdings and Genworth Life Insurance Company (“Genworth Life”), merge into or consolidate with any other person or permit any person to merge into or consolidate with them unless Genworth Holdings or Genworth Life, as applicable, is the surviving person; (3) sell, transfer, lease, or otherwise dispose of all or substantially all of the assets of Genworth Holdings and its subsidiaries, taken as a whole, and the equity interest in or assets of Genworth Life, subject to certain excluded transactions; (4) enter into certain transactions with affiliates; and (5) enter into certain restrictive agreements. In addition, Genworth Financial agrees not to permit Priority Indebtedness (as defined in the Credit Agreement) to exceed 7.5% of its consolidated total capitalization (as defined in the Credit Agreement) as of the end of any fiscal quarter ending on and after September 30, 2013.
The Credit Agreement also contains financial covenants that require Genworth Financial not to permit (i) its capitalization ratio (as defined in the Credit Agreement) to be greater than 0.35 to 1.00, and (ii) its consolidated net worth (as defined in the Credit Agreement) to be less than the sum of $8.9 billion plus 50% of its consolidated net income (as defined in the Credit Agreement), in each case as of the end of each fiscal quarter ending on and after September 30, 2013.
The Credit Agreement contains certain customary events of default, subject to customary grace periods, including, among others: (1) failure to pay when due principal, interest or any other amounts due and payable under the Credit Agreement; (2) incorrectness in any material respect of representations and warranties when made or deemed made; (3) breach of specified covenants; (4) cross-defaults with other material indebtedness (as defined in the Credit Agreement) exceeding an aggregate principal amount of $100 million; (5) certain ERISA (Employee Retirement Income Security Act of 1974) events, (6) bankruptcy and insolvency events, (7) occurrence of a change in control of either Genworth Financial or Genworth Holdings; (8) inability to pay debts as they become due; (9) certain undischarged judgments; (10) Genworth Financial’s guarantee ceases to be valid, binding and enforceable in accordance with its terms; or (11) issuance by any insurance regulatory official of any material corrective order or initiation by any such official of any material regulatory proceeding to oversee or direct management, if such order of proceeding continues undismissed for a period of 30 days.
283
GENWORTH FINANCIAL, INC.
NOTES TO CONSOLIDATED FINANCIAL STATEMENTS
Years Ended December 31, 2013, 2012 and 2011
(b) Long-Term Borrowings
The following table sets forth total long-term borrowings as of December 31:
| (Amounts in millions) |
2013 | 2012 | ||||||
| 5.75% Senior Notes, due 2014 (1) |
$ | 485 | $ | 500 | ||||
| 4.59% Senior Notes, due 2015 (2) |
141 | 151 | ||||||
| 4.95% Senior Notes, due 2015 (1) |
— | 350 | ||||||
| 8.625% Senior Notes, due 2016 (1) |
300 | 300 | ||||||
| 6.52% Senior Notes, due 2018 (1) |
600 | 600 | ||||||
| 5.68% Senior Notes, due 2020 (2) |
258 | 276 | ||||||
| 7.70% Senior Notes, due 2020 (1) |
400 | 400 | ||||||
| 7.20% Senior Notes, due 2021 (1) |
399 | 399 | ||||||
| 7.625% Senior Notes, due 2021 (1) |
759 | 760 | ||||||
| Floating Rate Junior Notes, due 2021 (3) |
125 | 145 | ||||||
| 4.90% Senior Notes, due 2023 (1) |
399 | — | ||||||
| 4.80% Senior Notes, due 2024 (1) |
400 | — | ||||||
| 6.50% Senior Notes, due 2034 (1) |
297 | 297 | ||||||
| 6.15% Junior Notes, due 2066 |
598 | 598 | ||||||
|
|
|
|
|
|||||
| Total |
$ | 5,161 | $ | 4,776 | ||||
|
|
|
|
|
|||||
| (1) | We have the option to redeem all or a portion of the senior notes at any time with notice to the noteholders at a price equal to the greater of 100% of principal or the sum of the present value of the remaining scheduled payments of principal and interest discounted at the then-current treasury rate plus an applicable spread. |
| (2) | Senior notes issued by our majority-owned subsidiary, Genworth MI Canada Inc. (“Genworth Canada”). |
| (3) | Subordinated floating rate notes issued by our indirect wholly-owned subsidiary, Genworth Financial Mortgage Insurance Pty Limited. |
Long-Term Senior Notes
In December 2013, Genworth Holdings issued $400 million aggregate principal amount of senior notes, with an interest rate of 4.80% per year payable semi-annually, and maturing in 2024 (“2024 Notes”). The 2024 Notes are Genworth Holdings’ direct, unsecured obligations and rank equally in right of payment with all of its existing and future unsecured and unsubordinated obligations. The 2024 Notes are fully and unconditionally guaranteed on an unsecured and unsubordinated basis by Genworth Financial. With the net proceeds from the issuance of the 2024 Notes of $397 million and cash on hand, Genworth Financial contributed $100 million of the proceeds to Genworth Mortgage Insurance Corporation (“GEMICO”), our primary U.S. mortgage insurance subsidiary, with an additional $300 million contributed to a U.S. mortgage holding company to be used to satisfy all or part of the higher capital requirements expected to be imposed by the government-sponsored enterprises (“GSEs”) as part of the anticipated revisions to their asset-and capital-related requirements. We expect the $300 million contributed into our U.S. mortgage holding company will be further contributed to GEMICO, to the extent needed, for the benefit of its capital position after the changes to the asset and capital requirements in the revised GSE standards are finalized. In connection with this additional $300 million contribution to GEMICO, we will also evaluate the overall performance of our U.S. mortgage insurance business and conditions existing in the U.S. mortgage insurance industry at the time we decide to make the contribution.
In August 2013, Genworth Holdings issued $400 million aggregate principal amount of senior notes, with an interest rate of 4.90% per year payable semi-annually, and maturing in 2023 (“2023 Notes”). The 2023 Notes
284
GENWORTH FINANCIAL, INC.
NOTES TO CONSOLIDATED FINANCIAL STATEMENTS
Years Ended December 31, 2013, 2012 and 2011
are Genworth Holdings’ direct, unsecured obligations and rank equally in right of payment with all of its existing and future unsecured and unsubordinated obligations. The 2023 Notes are fully and unconditionally guaranteed on an unsecured and unsubordinated basis by Genworth Financial. The net proceeds of $396 million from the issuance of the 2023 Notes, together with cash on hand at Genworth Holdings, were used to redeem all $346 million of the remaining outstanding aggregate principal amount of Genworth Holdings’ 4.95% Senior Notes due 2015 (the “2015 Notes”) and pay accrued and unpaid interest on such notes and pay a make-whole payment of approximately $30 million pre-tax.
During 2013, Genworth Holdings repurchased $15 million aggregate principal amount of the 5.75% senior notes that mature in 2014, and paid accrued and unpaid interest thereon. In June 2013, Genworth Holdings repurchased $4 million aggregate principal amount of the 2015 Notes, and paid accrued and unpaid interest thereon.
During the fourth quarter of 2012, we completed a tender offer for up to $100 million of our 5.75% senior notes that mature in June 2014. As a result of this tender offer, we repurchased principal of approximately $100 million of these notes, plus accrued interest on the notes repurchased, for a pre-tax loss of $6 million.
We repaid $222 million of our 5.65% senior notes that matured in June 2012 (“2012 Notes”).
In March 2011, we issued senior notes having an aggregate principal amount of $400 million, with an interest rate equal to 7.625% per year payable semi-annually, and maturing in September 2021 (“September 2021 Notes”). The September 2021 Notes are Genworth Holdings’ direct, unsecured obligations and will rank equally in right of payment with all of its existing and future unsecured and unsubordinated obligations. The net proceeds of $397 million from the issuance of the September 2021 Notes were used for general corporate purposes. In March 2012, we issued $350 million aggregate principal amount of additional September 2021 Notes. These September 2021 Notes were issued at a public offering price of 103% of principal amount, with a yield to maturity of 7.184%. The net proceeds of $358 million from the issuance of these new September 2021 Notes were used for general corporate purposes, including increasing liquidity at the Genworth Holdings level.
In December 2010, our majority-owned subsidiary, Genworth Canada, issued CAD$150 million of 4.59% senior notes due 2015. The net proceeds of the offering were used to fund transactions among Genworth Canada and its wholly-owned Canadian subsidiaries. Genworth Canada used the proceeds it received from such transactions for general corporate and investment purposes, and/or to fund a distribution to, or a repurchase of common shares from, Genworth Canada’s shareholders.
In November 2010, we issued senior notes having an aggregate principal amount of $400 million, with an interest rate equal to 7.200% per year payable semi-annually, and maturing in February 2021 (“February 2021 Notes”). The February 2021 Notes are Genworth Holdings’ direct, unsecured obligations and will rank equally in right of payment with all of its existing and future unsecured and unsubordinated obligations. The net proceeds of $396 million from the issuance of the February 2021 Notes, together with cash on hand, were used to repay in full the outstanding borrowings under our two five-year revolving credit facilities.
In June 2010, we issued senior notes having an aggregate principal amount of $400 million, with an interest rate equal to 7.700% per year payable semi-annually, and maturing in June 2020 (“2020 Notes”). The 2020 Notes are Genworth Holdings’ direct, unsecured obligations and will rank equally in right of payment with all of its existing and future unsecured and unsubordinated obligations. The net proceeds of $397 million from the issuance of the 2020 Notes were used to repay $100 million of outstanding borrowings under each of our five-year revolving credit facilities and the remainder of the proceeds were used for general corporate purposes.
285
GENWORTH FINANCIAL, INC.
NOTES TO CONSOLIDATED FINANCIAL STATEMENTS
Years Ended December 31, 2013, 2012 and 2011
In June 2010, our majority-owned subsidiary, Genworth Canada, issued CAD$275 million of 5.68% senior notes due 2020. The net proceeds of the offering were used to fund transactions among Genworth Canada and its Canadian wholly-owned subsidiaries. Genworth Canada used the proceeds it received from such transactions for general corporate and investment purposes and to fund a repurchase of common shares from Genworth Canada’s shareholders.
In December 2009, we issued senior notes having an aggregate principal amount of $300 million, with an interest rate equal to 8.625% per year payable semi-annually, and maturing in December 2016 (“2016 Notes”). The 2016 Notes are Genworth Holdings’ direct, unsecured obligations and will rank equally in right of payment with all of its existing and future unsecured and unsubordinated obligations. The net proceeds of $298 million from the issuance of the 2016 Notes were used for general corporate purposes.
In May 2008, we issued senior notes having an aggregate principal amount of $600 million, with an interest rate equal to 6.515% per year payable semi-annually, and maturing in May 2018 (“2018 Notes”). The 2018 Notes are Genworth Holdings’ direct, unsecured obligations and will rank equally in right of payment with all of its existing and future unsecured and unsubordinated obligations. The net proceeds of $597 million from the issuance of the 2018 Notes were used for general corporate purposes.
In June 2007, we issued the 2012 Notes, which had an aggregate principal amount of $350 million, with an interest rate equal to 5.65% per year payable semi-annually, and matured in June 2012. The 2012 Notes were our direct, unsecured obligations and ranked equally in right of payment with all of our existing and future unsecured and unsubordinated obligations. The net proceeds of $349 million from the issuance of the 2012 Notes were used to partially repay $500 million of our senior notes which matured in June 2007, with the remainder repaid with cash on hand. During 2009, we repurchased $128 million aggregate principal amount of the 2012 Notes, plus accrued interest, for a pre-tax gain of $5 million.
In September 2005, we issued the 2015 Notes. The 2015 Notes were Genworth Holdings’ direct, unsecured obligations and ranked equally in right of payment with all of its existing and future unsecured and unsubordinated obligations. The net proceeds of $348 million from the issuance of the 2015 Notes were used to reduce our outstanding commercial paper borrowings.
In June 2004, we issued senior notes having an aggregate principal amount of $600 million maturing in 2014 and $300 million maturing in 2034. As a result of hedging arrangements entered into with respect to these securities, our effective interest rates will be 5.51% on the senior notes maturing in 2014 and 6.35% on the senior notes maturing in 2034. These senior notes are direct unsecured obligations and will rank without preference or priority among themselves and equally with all of Genworth Holdings’ existing and future unsecured and unsubordinated obligations.
In June 2001, GE Financial Assurance Holdings, Inc. issued ¥60.0 billion of unsecured senior notes through a public offering at a price of ¥59.9 billion. ¥3.0 billion of the notes were retired during 2004. We entered into arrangements to swap our obligations under these notes to a U.S. dollar obligation with a notional principal amount of $491 million and bearing interest at a rate of 4.84% per annum. We assumed this obligation under these notes in 2004 in connection with our corporation formation and IPO. During the second quarter of 2011, we repaid ¥57.0 billion of senior notes that matured in June 2011, plus accrued and unpaid interest. In addition, the arrangements to swap our obligations under these notes to a U.S. dollar obligation matured. Upon maturity of these swaps, we received $212 million from the derivative counterparty resulting in a net repayment of $491 million of principal related to these notes.
286
GENWORTH FINANCIAL, INC.
NOTES TO CONSOLIDATED FINANCIAL STATEMENTS
Years Ended December 31, 2013, 2012 and 2011
Long-Term Junior Subordinated Notes
In June 2011, our indirect wholly-owned subsidiary, Genworth Financial Mortgage Insurance Pty Limited, issued AUD$140 million of subordinated floating rate notes due 2021 with an interest rate of three-month Bank Bill Swap reference rate plus a margin of 4.75%. Genworth Financial Mortgage Insurance Pty Limited used the proceeds it received from this transaction for general corporate purposes.
In November 2006, we issued fixed-to-floating rate junior notes having an aggregate principal amount of $600 million, with an annual interest rate equal to 6.15% payable semi-annually, until November 15, 2016, at which point the annual interest rate will be equal to the three-month London Interbank Offered Rate (“LIBOR”) plus 2.0025% payable quarterly, until the notes mature in November 2066 (“2066 Notes”). Subject to certain conditions, Genworth Holdings has the right, on one or more occasions, to defer the payment of interest on the 2066 Notes during any period of up to 10 years without giving rise to an event of default and without permitting acceleration under the terms of the 2066 Notes. Genworth Holdings will not be required to settle deferred interest payments until it has deferred interest for five years or made a payment of current interest. In the event of our bankruptcy, holders will have a limited claim for deferred interest.
Genworth Holdings may redeem the 2066 Notes on November 15, 2036, the “scheduled redemption date,” but only to the extent that it has received net proceeds from the sale of certain qualifying capital securities. Genworth Holdings may redeem the 2066 Notes (i) in whole or in part, at any time on or after November 15, 2016 at their principal amount plus accrued and unpaid interest to the date of redemption or (ii) in whole or in part, prior to November 15, 2016 at their principal amount plus accrued and unpaid interest to the date of redemption or, if greater, a make-whole price.
The 2066 Notes will be subordinated to all existing and future senior, subordinated and junior subordinated debt of Genworth Holdings, except for any future debt that by its terms is not superior in right of payment, and will be effectively subordinated to all liabilities of our subsidiaries.
In connection with the issuance of the 2066 Notes, we entered into a Replacement Capital Covenant (the “Replacement Capital Covenant”), whereby we agreed, for the benefit of holders of our 6.5% Senior Notes due 2034, that Genworth Holdings will not repay, redeem or repurchase all or any part of the 2066 Notes on or before November 15, 2046, unless such repayment, redemption or repurchase is made from the proceeds of the issuance of certain replacement capital securities and pursuant to the other terms and conditions set forth in the Replacement Capital Covenant.
Mandatorily Redeemable Preferred Stock
As part of our corporate formation, we issued 5.25% Series A Preferred Stock (“Series A Preferred Stock”). On June 1, 2011, we redeemed all the remaining outstanding shares of our Series A Preferred Stock at a price of $50 per share, plus unpaid dividends accrued to the date of redemption, for $57 million.
Dividends on the Series A Preferred Stock were fixed at an annual rate equal to 5.25% of the sum of (1) the stated liquidation value of $50 per share plus (2) accumulated and unpaid dividends. Dividends were payable quarterly in arrears on March 1, June 1, September 1 and December 1 of each year. For the year ended December 31, 2011, we paid dividends of $2 million, which were recorded as interest expense in the consolidated statements of income.
287
GENWORTH FINANCIAL, INC.
NOTES TO CONSOLIDATED FINANCIAL STATEMENTS
Years Ended December 31, 2013, 2012 and 2011
(c) Non-Recourse Funding Obligations
We issued non-recourse funding obligations in connection with our capital management strategy related to our term and universal life insurance products.
The following table sets forth the non-recourse funding obligations (surplus notes) of our wholly-owned, special purpose consolidated captive insurance subsidiaries as of December 31:
| (Amounts in millions) |
||||||||
| Issuance |
2013 | 2012 | ||||||
| River Lake Insurance Company (a), due 2033 |
$ | 570 | $ | 570 | ||||
| River Lake Insurance Company (b), due 2033 |
461 | 489 | ||||||
| River Lake Insurance Company II (a), due 2035 |
192 | 192 | ||||||
| River Lake Insurance Company II (b), due 2035 |
500 | 500 | ||||||
| Rivermont Insurance Company I (a), due 2050 |
315 | 315 | ||||||
|
|
|
|
|
|||||
| Total |
$ | 2,038 | $ | 2,066 | ||||
|
|
|
|
|
|||||
| (a) | Accrual of interest based on one-month LIBOR that resets every 28 days plus a fixed margin. |
| (b) | Accrual of interest based on one-month LIBOR that resets on a specified date each month plus a contractual margin. |
The floating rate notes have been deposited into a series of trusts that have issued money market or term securities. Both principal and interest payments on the money market and term securities are guaranteed by a third-party insurance company. The holders of the money market or term securities cannot require repayment from us or any of our subsidiaries, other than the River Lake and Rivermont Insurance Companies, as applicable, the direct issuers of the notes. We have provided a limited guarantee to Rivermont Insurance Company (“Rivermont I”), where under adverse interest rate, mortality or lapse scenarios (or combination thereof), we may be required to provide additional funds to Rivermont I. Genworth Life and Annuity Insurance Company, our wholly-owned subsidiary, has agreed to indemnify the issuers and the third-party insurer for certain limited costs related to the issuance of these obligations.
Any payment of principal, including by redemption, or interest on the notes may only be made with the prior approval of the Director of Insurance of the State of South Carolina in accordance with the terms of its licensing orders and in accordance with applicable law. The holders of the notes have no rights to accelerate payment of principal of the notes under any circumstances, including without limitation, for non-payment or breach of any covenant. Each issuer reserves the right to repay the notes that it has issued at any time, subject to prior regulatory approval.
During 2013 and 2012, River Lake Insurance Company, our indirect wholly-owned subsidiary, repaid $28 million and $11 million, respectively, of its total outstanding floating rate subordinated notes due in 2033.
In December 2012, we acquired $20 million of non-recourse funding obligations issued by River Lake Insurance Company II (“River Lake II”), our indirect wholly-owned subsidiary, resulting in a U.S. GAAP pre-tax gain of $4 million. We accounted for these transactions as redemptions of our non-recourse funding obligations.
On March 26, 2012, River Lake Insurance Company IV Limited (“River Lake IV”) repaid $3 million of its total outstanding $8 million Class B Floating Rate Subordinated Notes due May 25, 2028 following an early
288
GENWORTH FINANCIAL, INC.
NOTES TO CONSOLIDATED FINANCIAL STATEMENTS
Years Ended December 31, 2013, 2012 and 2011
redemption event, in accordance with the priority of payments. During the three months ended September 30, 2012, as part of a life block transaction, we acquired $270 million of non-recourse funding obligations issued by River Lake IV, which were accounted for as redemptions of our non-recourse funding obligations and resulted in a U.S. GAAP after-tax gain of approximately $21 million. The life block transaction also resulted in higher after-tax DAC amortization of $25 million reflecting loss recognition associated with a third-party reinsurance treaty plus additional expenses. The combined transactions resulted in a U.S. GAAP after-tax loss of $6 million in the three months ended September 30, 2012 which was included in our U.S. Life Insurance segment. In December 2012, we repaid the remaining outstanding non-recourse funding obligations issued by River Lake IV of $235 million.
In January 2012, as part of a life block transaction, we acquired $475 million of our non-recourse funding obligations issued by River Lake Insurance Company III (“River Lake III”), our indirect wholly-owned subsidiary, which were accounted for as redemptions of our non-recourse funding obligations and resulted in a U.S. GAAP after-tax gain of approximately $52 million. In connection with the life block transaction, we ceded certain term life insurance policies to a third-party reinsurer resulting in a U.S. GAAP after-tax loss, net of DAC amortization, of $93 million. The combined transactions resulted in a U.S. GAAP after-tax loss of approximately $41 million in the three months ended March 31, 2012 which was included in our U.S. Life Insurance segment. In February and March 2012, we repaid the remaining outstanding non-recourse funding obligations issued by River Lake III of $176 million.
During 2011, we acquired $175 million aggregate principal amount of notes issued by River Lake II, River Lake III and River Lake IV secured by our non-recourse funding obligations, plus accrued interest, for a pre-tax gain of $48 million. We accounted for these transactions as redemptions of our non-recourse funding obligations.
On March 25, 2011, River Lake IV repaid $6 million of its total outstanding $22 million Class B Floating Rate Subordinated Notes due May 25, 2028 following an early redemption event, in accordance with the priority of payments.
The weighted-average interest rates on the non-recourse funding obligations as of December 31, 2013 and 2012 were 1.50% and 1.54%, respectively.
(d) Liquidity
Principal amounts under our long-term borrowings (including senior notes) and non-recourse funding obligations by maturity were as follows as of December 31, 2013:
| (Amounts in millions) |
Amount | |||
| 2014 |
$ | 485 | ||
| 2015 |
146 | |||
| 2016 |
300 | |||
| 2017 |
— | |||
| 2018 and thereafter (1) |
6,285 | |||
|
|
|
|||
| Total |
$ | 7,216 | ||
|
|
|
|||
| (1) | Repayment of $2.0 billion of our non-recourse funding obligations requires regulatory approval. |
Our liquidity requirements are principally met through cash flows from operations.
289
GENWORTH FINANCIAL, INC.
NOTES TO CONSOLIDATED FINANCIAL STATEMENTS
Years Ended December 31, 2013, 2012 and 2011
Income from continuing operations before income taxes included the following components for the years ended December 31:
| (Amounts in millions) |
2013 | 2012 | 2011 | |||||||||
| Domestic |
$ | 294 | $ | (73 | ) | $ | (690 | ) | ||||
| Foreign |
756 | 679 | 820 | |||||||||
|
|
|
|
|
|
|
|||||||
| Income from continuing operations before income taxes |
$ | 1,050 | $ | 606 | $ | 130 | ||||||
|
|
|
|
|
|
|
|||||||
The total provision (benefit) for income taxes was as follows for the years ended December 31:
| (Amounts in millions) |
2013 | 2012 | 2011 | |||||||||
| Current federal income taxes |
$ | (18 | ) | $ | (68 | ) | $ | (4 | ) | |||
| Deferred federal income taxes |
160 | 36 | (251 | ) | ||||||||
|
|
|
|
|
|
|
|||||||
| Total federal income taxes |
142 | (32 | ) | (255 | ) | |||||||
|
|
|
|
|
|
|
|||||||
| Current state income taxes |
(1 | ) | (16 | ) | 5 | |||||||
| Deferred state income taxes |
(9 | ) | (9 | ) | (8 | ) | ||||||
|
|
|
|
|
|
|
|||||||
| Total state income taxes |
(10 | ) | (25 | ) | (3 | ) | ||||||
|
|
|
|
|
|
|
|||||||
| Current foreign income taxes |
422 | 138 | 329 | |||||||||
| Deferred foreign income taxes |
(230 | ) | 57 | (82 | ) | |||||||
|
|
|
|
|
|
|
|||||||
| Total foreign income taxes |
192 | 195 | 247 | |||||||||
|
|
|
|
|
|
|
|||||||
| Total provision (benefit) for income taxes |
$ | 324 | $ | 138 | $ | (11 | ) | |||||
|
|
|
|
|
|
|
|||||||
Our current income tax payable was $132 million as of December 31, 2013 and our current income tax receivable was $99 million as of December 31, 2012.
The reconciliation of the federal statutory tax rate to the effective income tax rate was as follows for the years ended December 31:
| (Amounts in millions) |
2013 | 2012 | 2011 | |||||||||||||||||||||
| Pre-tax income (loss) |
$ | 1,050 | $ | 606 | $ | 130 | ||||||||||||||||||
|
|
|
|
|
|
|
|||||||||||||||||||
| Statutory U.S. federal income tax rate |
$ | 368 | 35.0 | % | $ | 212 | 35.0 | % | $ | 46 | 35.0 | % | ||||||||||||
| Increase (reduction) in rate resulting from: |
||||||||||||||||||||||||
| State income tax, net of federal income tax effect |
(2 | ) | (0.2 | ) | (16 | ) | (2.7 | ) | (1 | ) | (1.1 | ) | ||||||||||||
| Benefit on tax favored investments |
(18 | ) | (1.7 | ) | (9 | ) | (1.4 | ) | (26 | ) | (20.3 | ) | ||||||||||||
| Effect of foreign operations |
(75 | ) | (7.1 | ) | (66 | ) | (10.9 | ) | (48 | ) | (36.7 | ) | ||||||||||||
| Interest on uncertain tax positions |
(1 | ) | (0.1 | ) | (3 | ) | (0.6 | ) | — | (0.1 | ) | |||||||||||||
| Non-deductible expenses |
2 | 0.2 | 3 | 0.5 | (1 | ) | (0.5 | ) | ||||||||||||||||
| Non-deductible goodwill related to sale of subsidiary |
— | — | — | — | 16 | 12.4 | ||||||||||||||||||
| Non-deductible goodwill |
— | — | 19 | 3.1 | — | — | ||||||||||||||||||
| Valuation allowance |
16 | 1.5 | — | — | — | — | ||||||||||||||||||
| Stock-based compensation |
25 | 2.4 | — | — | — | — | ||||||||||||||||||
| Other, net |
9 | 0.9 | (2 | ) | (0.2 | ) | 3 | 2.8 | ||||||||||||||||
|
|
|
|
|
|
|
|
|
|
|
|
|
|||||||||||||
| Effective rate |
$ | 324 | 30.9 | % | $ | 138 | 22.8 | % | $ | (11 | ) | (8.5 | )% | |||||||||||
|
|
|
|
|
|
|
|
|
|
|
|
|
|||||||||||||
290
GENWORTH FINANCIAL, INC.
NOTES TO CONSOLIDATED FINANCIAL STATEMENTS
Years Ended December 31, 2013, 2012 and 2011
For the year ended December 31, 2013, the increase in the effective tax rate was primarily attributable to additional tax expense of $25 million, including $13 million from a correction of prior years, related to non-deductible stock compensation expense resulting from cancellations recorded in 2013. The increase in the effective tax rate was also attributable to a valuation allowance on a deferred tax asset on a specific separate tax return net operating loss that is no longer expected to be realized, state income taxes and the proportion of lower taxed foreign income to pre-tax earnings in 2013 compared to 2012, partially offset by a non-deductible goodwill impairment in 2012.
For the year ended December 31, 2012, the increase in the effective tax rate was primarily attributable to lower tax favored investments in 2012, the proportion of lower taxed foreign income to pre-tax earnings in 2012 compared to 2011 and a goodwill impairment in 2012, partially offset by a smaller impact from the sale of a subsidiary in 2011.
The components of the net deferred income tax liability were as follows as of December 31:
| (Amounts in millions) |
2013 | 2012 | ||||||
| Assets: |
||||||||
| Foreign tax credit carryforwards |
$ | 432 | $ | 243 | ||||
| Accrued commission and general expenses |
300 | 316 | ||||||
| State income taxes |
279 | 268 | ||||||
| Net operating loss carryforwards |
1,762 | 1,732 | ||||||
| Net unrealized losses on derivatives |
160 | — | ||||||
| Other |
292 | 197 | ||||||
|
|
|
|
|
|||||
| Gross deferred income tax assets |
3,225 | 2,756 | ||||||
| Valuation allowance |
(312 | ) | (268 | ) | ||||
|
|
|
|
|
|||||
| Total deferred income tax assets |
2,913 | 2,488 | ||||||
|
|
|
|
|
|||||
| Liabilities: |
||||||||
| Investments |
$ | 229 | $ | 166 | ||||
| Net unrealized gains on investment securities |
454 | 1,380 | ||||||
| Net unrealized gains on derivatives |
— | 152 | ||||||
| Insurance reserves |
1,149 | 1,010 | ||||||
| DAC |
1,149 | 1,157 | ||||||
| PVFP and other intangibles |
49 | 34 | ||||||
| Other |
89 | 96 | ||||||
|
|
|
|
|
|||||
| Total deferred income tax liabilities |
3,119 | 3,995 | ||||||
|
|
|
|
|
|||||
| Net deferred income tax liability |
$ | 206 | $ | 1,507 | ||||
|
|
|
|
|
|||||
The above valuation allowances of $312 million and $268 million, respectively, related to state deferred tax assets, foreign net operating losses and a specific federal separate tax return net operating loss deferred tax asset as of December 31, 2013 and 2012, respectively. The state deferred tax assets related primarily to the future deductions associated with the Section 338 elections and non-insurance net operating loss (“NOL”) carryforwards. Based on our analysis, we believe it is more likely than not that the results of future operations and the implementations of tax planning strategies will generate sufficient taxable income to enable us to realize the deferred tax assets for which we have not established valuation allowances.
291
GENWORTH FINANCIAL, INC.
NOTES TO CONSOLIDATED FINANCIAL STATEMENTS
Years Ended December 31, 2013, 2012 and 2011
NOL carryforwards amounted to $5,059 million as of December 31, 2013, and, if unused, will expire beginning in 2021. Of this amount, $24 million will result in a benefit recorded in APIC when realized. Foreign tax credit carryforwards amounted to $432 million as of December 31, 2013, and, if unused will begin to expire in 2014.
As a consequence of our separation from GE, and our joint election with GE to treat that separation as an asset sale under Section 338 of the Internal Revenue Code, we became entitled to additional tax deductions in post IPO periods. As of December 31, 2013 and 2012, we have recorded in our consolidated balance sheets our estimates of the remaining deferred tax benefits associated with these deductions of $599 million. We are obligated, pursuant to our Tax Matters Agreement with GE, to make fixed payments to GE, over the next 10 years, on an after-tax basis and subject to a cumulative maximum of $640 million, which is 80% of the projected tax savings associated with the Section 338 deductions. We recorded net interest expense of $15 million, $17 million and $18 million for the years ended December 31, 2013, 2012 and 2011, respectively, reflecting accretion of our liability at the Tax Matters Agreement rate of 5.72%. As of December 31, 2013 and 2012, we have recorded the estimated present value of our remaining obligation to GE of $245 million and $279 million, respectively, as a liability in our consolidated balance sheets. Both our IPO-related deferred tax assets and our obligation to GE are estimates that are subject to change.
In 2012, we increased our deferred tax liability by $36 million, with an offset to additional paid-in capital related to an unsupported tax balance that arose prior to our IPO. In 2013, we identified further adjustments to our deferred tax liability that arose prior to our IPO and increased it by an additional $17 million, with an offset to additional paid-in capital.
U.S. deferred income taxes are not provided on unremitted foreign income that is considered permanently reinvested, which as of December 31, 2013, amounted to approximately $3,019 million. It is not practicable to determine the income tax liability that might be incurred if all such income was remitted to the United States. Our international businesses held cash and short-term investments of $464 million related to the unremitted earnings of foreign operations considered to be permanently reinvested as of December 31, 2013.
A reconciliation of the beginning and ending amount of unrecognized tax benefits was as follows:
| (Amounts in millions) |
2013 | 2012 | 2011 | |||||||||
| Balance as of January 1 |
$ | 55 | $ | 226 | $ | 193 | ||||||
| Tax positions related to the current period: |
||||||||||||
| Gross additions |
3 | 14 | 19 | |||||||||
| Tax positions related to the prior years: |
||||||||||||
| Gross additions |
4 | — | 28 | |||||||||
| Gross reductions |
(21 | ) | (131 | ) | (14 | ) | ||||||
| Settlements |
— | (54 | ) | — | ||||||||
|
|
|
|
|
|
|
|||||||
| Balance as of December 31 |
$ | 41 | $ | 55 | $ | 226 | ||||||
|
|
|
|
|
|
|
|||||||
The total amount of unrecognized tax benefits was $41 million as of December 31, 2013, of which $34 million, if recognized, would affect the effective rate on continuing operations. These unrecognized tax benefits included the impact of foreign currency translation from our international operations.
We recognize accrued interest and penalties related to unrecognized tax benefits as components of income tax expense. We recorded $1 million and $5 million, respectively, of benefits related to interest and penalties
292
GENWORTH FINANCIAL, INC.
NOTES TO CONSOLIDATED FINANCIAL STATEMENTS
Years Ended December 31, 2013, 2012 and 2011
during 2013 and 2012. We recorded no benefits related to interest and penalties during 2011. We had approximately $3 million and $4 million of interest and penalties accrued as of December 31, 2013 and 2012, respectively.
For tax years prior to 2011, we filed U.S. separate non-life consolidated, life consolidated Federal income tax returns, several separate non-life and life returns and various state and local tax returns. For tax years beginning in 2011 and thereafter, we have elected to file a life/non-life consolidated return for U.S. federal income tax purposes. With possible exceptions, we are no longer subject to U.S. Federal tax examinations for years through 2009. Any exposure with respect to these pre-2010 years has been sufficiently recorded in the financial statements. Potential state and local examinations for those years are generally restricted to results that are based on closed U.S. Federal examinations. For our life and non-life consolidated company federal income tax returns, all tax years prior to 2010 have been examined or reviewed. Several of our companies were included in a consolidated return with our former parent, GE, for pre-2005 tax years before our IPO. The Internal Revenue Service completed its examination of these GE consolidated returns in 2010, and the appropriate adjustments under the Tax Matters Agreement and other tax sharing arrangements with GE were settled and finalized during the year ended December 31, 2012. We are also responsible for any tax liability of any separate U.S. Federal and state pre-disposition period returns of former life insurance and non-insurance subsidiaries sold in the years 2011 to 2013. With respect to our foreign affiliates, there are various examinations ongoing by foreign jurisdictions with any material exposure liability related thereto being duly recorded in the financial statements.
We believe it is reasonably possible that in 2014 as a result of our open audits and appeals, up to approximately $14 million of unrecognized tax benefits will be recognized. These tax benefits are related to certain insurance tax attributes in the United States and in foreign jurisdictions.
(15) Supplemental Cash Flow Information
Net cash paid for taxes was $146 million, $287 million and $194 million and cash paid for interest was $453 million, $465 million and $444 million for the years ended December 31, 2013, 2012 and 2011, respectively.
The following table details non-cash items for the years ended December 31:
| (Amounts in millions) |
2013 | 2012 | 2011 | |||||||||
| Supplemental schedule of non-cash investing and financing activities: |
||||||||||||
| Change in collateral for securities lending transactions |
$ | — | $ | — | $ | (285 | ) | |||||
|
|
|
|
|
|
|
|||||||
| Total non-cash transactions |
$ | — | $ | — | $ | (285 | ) | |||||
|
|
|
|
|
|
|
|||||||
Prior to the second quarter of 2011, we recorded non-cash collateral related to the securities lending program in Canada in other invested assets with a corresponding liability in other liabilities representing our obligation to return the non-cash collateral. Since we do not have rights to sell or pledge the non-cash collateral, we determined the gross presentation of these amounts were not required and changed our presentation of these amounts, resulting in the reduction of the non-cash collateral balance during the year ended December 31, 2011.
Prior to May 2012, we granted share-based awards to employees and directors, including stock options, stock appreciation rights (“SARs”), restricted stock units (“RSUs”) and deferred stock units (“DSUs”) under the
293
GENWORTH FINANCIAL, INC.
NOTES TO CONSOLIDATED FINANCIAL STATEMENTS
Years Ended December 31, 2013, 2012 and 2011
2004 Genworth Financial, Inc. Omnibus Incentive Plan (the “2004 Omnibus Incentive Plan”). In May 2012, the 2012 Genworth Financial, Inc. Omnibus Incentive Plan (the “2012 Omnibus Incentive Plan,” together with the 2004 Omnibus Incentive Plan, the “Omnibus Incentive Plans”) was approved by stockholders. Under the 2012 Omnibus Incentive Plan, we are authorized to grant 16 million equity awards, plus a number of additional shares not to exceed 25 million underlying awards outstanding under the prior Plan. From and after May 2012, no further awards have been or will be granted under the 2004 Omnibus Incentive Plan and the 2004 Omnibus Incentive Plan will remain in effect only as long as awards granted thereunder remain outstanding.
We recorded stock-based compensation expense under the Omnibus Incentive Plans of $30 million, $23 million and $32 million, respectively, for the years ended December 31, 2013, 2012 and 2011. For awards issued prior to January 1, 2006, stock-based compensation expense was recognized on a graded vesting attribution method over the awards’ respective vesting schedule. For awards issued after January 1, 2006, stock-based compensation expense was recognized evenly on a straight-line attribution method over the awards’ respective vesting period.
For purposes of determining the fair value of stock-based payment awards on the date of grant, we typically use the Black-Scholes Model. The Black-Scholes Model requires the input of certain assumptions that involve judgment. Management periodically evaluates the assumptions and methodologies used to calculate fair value of share-based compensation. Circumstances may change and additional data may become available over time, which could result in changes to these assumptions and methodologies.
The following table contains the stock option and SAR weighted-average grant date fair value information and related valuation assumptions for the years ended December 31:
| Stock Options and SARs | ||||||||||||||||
| 2013 | 2012 | 2011 | ||||||||||||||
| Black-Scholes Model |
Monte-Carlo Simulation (1) |
Black-Scholes Model |
Black-Scholes Model |
|||||||||||||
| Awards granted (in thousands) |
3,404 | 1,200 | 5,085 | 2,730 | ||||||||||||
| Maximum share value at exercise of SARs |
$ | 75.00 | $ | 75.00 | $ | 75.00 | $ | 75.00 | ||||||||
| Fair value per options and SARs |
$ | 2.53 | $ | 5.88 | $ | 2.34 | $ | 3.19 | ||||||||
| Valuation assumptions: |
||||||||||||||||
| Expected term (years) |
5.9 | NA | 6.0 | 6.0 | ||||||||||||
| Expected volatility |
100.7 | % | 102.5 | % | 100.7 | % | 95.3 | % | ||||||||
| Expected dividend yield |
0.5 | % | 0.5 | % | 0.5 | % | 0.5 | % | ||||||||
| Risk-free interest rate |
1.1 | % | 1.1 | % | 1.1 | % | 2.9 | % | ||||||||
| (1) | For purposes of determining the fair value of 1.2 million shares of performance-accelerated SARs that were issued in January 2013, we used a Monte-Carlo Simulation technique. Monte-Carlo Simulation is a method used to simulate future stock price movements in order to determine the fair value due to unique vesting and exercising provisions. The performance-accelerated SARs have a derived service period of one year on average and have a grant price of $7.90. The performance-accelerated SARs vest on the third anniversary of the grant date but are subject to earlier vesting on or after the one year anniversary of the grant date based on the closing price of our Class A Common Stock exceeding certain specified amounts ($12.00, $16.00 and $20.00, respectively) for 45 consecutive trading days. Based on the closing price of our Class A Common Stock, the first tranche at $12.00 vested in January 2014. |
During 2013 and 2012, we granted SARs with exercise prices ranging from $7.90 to $9.06 and $4.48 to $8.88, respectively. These SARs have a feature that places a cap on the amount of gain that can be recognized
294
GENWORTH FINANCIAL, INC.
NOTES TO CONSOLIDATED FINANCIAL STATEMENTS
Years Ended December 31, 2013, 2012 and 2011
upon exercise of the SARs. Specifically, if the price of our Class A Common Stock reaches $75.00, any vested portion of the SAR will be automatically exercised. During 2011, we granted stock options with exercise prices ranging from $12.75 to $13.50. We did not grant stock options during 2013 or 2012. The stock option and SAR grant prices equaled the closing market prices of our Class A Common Stock on the date of grant and the awards have an exercise term of 10 years. The SARs granted in 2013 and 2012 have average vesting periods of four years in annual increments commencing on the first anniversary of the grant date. Additionally, during 2013 and 2012, we issued RSUs with average restriction periods of four years and a fair value of $7.90 to $15.40 and $4.48 to $9.10, respectively, which were measured at the market price of a share of our Class A Common Stock on the grant date.
The following table summarizes stock option activity as of December 31, 2013 and 2012:
| (Shares in thousands) |
Shares subject to option |
Weighted-average exercise price |
||||||
| Balance as of January 1, 2012 |
7,965 | $ | 12.70 | |||||
| Granted |
— | $ | — | |||||
| Exercised |
(311 | ) | $ | 2.79 | ||||
| Forfeited |
(1,545 | ) | $ | 18.40 | ||||
| Expired |
— | $ | — | |||||
|
|
|
|||||||
| Balance as of January 1, 2013 |
6,109 | $ | 11.77 | |||||
| Granted |
— | $ | — | |||||
| Exercised |
(1,440 | ) | $ | 6.20 | ||||
| Forfeited |
(359 | ) | $ | 17.26 | ||||
| Expired |
— | $ | — | |||||
|
|
|
|||||||
| Balance as of December 31, 2013 |
4,310 | $ | 13.17 | |||||
|
|
|
|||||||
| Exercisable as of December 31, 2013 |
4,009 | $ | 13.09 | |||||
|
|
|
|||||||
The following table summarizes information about stock options outstanding as of December 31, 2013:
| Outstanding | Exercisable | |||||||||||||||||||||||
| Exercise price range |
Shares in thousands |
Average life (1) |
Average exercise price |
Shares in thousands |
Average life (1) |
Average exercise price |
||||||||||||||||||
| $2.00 – $2.46 (2) |
574 | 4.63 | $ | 2.44 | 574 | 4.62 | $ | 2.44 | ||||||||||||||||
| $5.30 – $7.80 (3) |
1,111 | 2.26 | $ | 7.78 | 1,111 | 2.26 | $ | 7.78 | ||||||||||||||||
| $9.10 – $14.18 (4) |
1,460 | 5.63 | $ | 14.15 | 1,159 | 5.50 | $ | 14.15 | ||||||||||||||||
| $14.92 – $19.50 |
818 | 0.48 | $ | 19.43 | 818 | 0.48 | $ | 19.43 | ||||||||||||||||
| $21.41 – $34.13 |
347 | 2.86 | $ | 29.23 | 347 | 2.86 | $ | 29.23 | ||||||||||||||||
|
|
|
|
|
|||||||||||||||||||||
| 4,310 | $ | 13.17 | 4,009 | $ | 13.09 | |||||||||||||||||||
|
|
|
|
|
|||||||||||||||||||||
| (1) | Average contractual life remaining in years. |
| (2) | These shares have an aggregate intrinsic value for total options and exercisable options of $8 million each. |
| (3) | These shares have an aggregate intrinsic value for total options and exercisable options of $9 million each. |
| (4) | These shares have an aggregate intrinsic value for total options and exercisable options of $2 million each. |
295
GENWORTH FINANCIAL, INC.
NOTES TO CONSOLIDATED FINANCIAL STATEMENTS
Years Ended December 31, 2013, 2012 and 2011
The following table summarizes the status of our other equity-based awards as of December 31, 2013 and 2012:
| RSUs | DSUs | SARs | ||||||||||||||||||||||
| (Awards in thousands) |
Number of awards |
Weighted- average grant date fair value |
Number of awards |
Weighted- average fair value |
Number of awards |
Weighted- average grant date fair value |
||||||||||||||||||
| Balance as of January 1, 2012 |
2,532 | $ | 16.65 | 538 | $ | 9.46 | 10,474 | $ | 6.42 | |||||||||||||||
| Granted |
1,087 | $ | 8.22 | 162 | $ | 6.47 | 5,085 | $ | 2.34 | |||||||||||||||
| Exercised |
(1,103 | ) | $ | 14.16 | (10 | ) | $ | 2.14 | (51 | ) | $ | 1.28 | ||||||||||||
| Terminated |
(236 | ) | $ | 17.97 | — | $ | — | (5,149 | ) | $ | 6.52 | |||||||||||||
|
|
|
|
|
|
|
|||||||||||||||||||
| Balance as of January 1, 2013 |
2,280 | $ | 12.97 | 690 | $ | 8.74 | 10,359 | $ | 4.44 | |||||||||||||||
| Granted |
2,018 | $ | 9.27 | 98 | $ | 12.17 | 4,604 | $ | 3.40 | |||||||||||||||
| Exercised |
(985 | ) | $ | 14.75 | (209 | ) | $ | 4.73 | (1,618 | ) | $ | 5.97 | ||||||||||||
| Terminated |
(426 | ) | $ | 10.01 | — | $ | — | (980 | ) | $ | 2.91 | |||||||||||||
|
|
|
|
|
|
|
|||||||||||||||||||
| Balance as of December 31, 2013 |
2,887 | $ | 10.21 | 579 | $ | 9.25 | 12,365 | $ | 4.00 | |||||||||||||||
|
|
|
|
|
|
|
|||||||||||||||||||
As of December 31, 2013 and 2012, total unrecognized stock-based compensation expense related to non-vested awards not yet recognized was $30 million and $32 million, respectively. This expense is expected to be recognized over a weighted-average period of two years.
There was $19 million and $1 million in cash received from stock options exercised in 2013 and 2012, respectively. New shares were issued to settle all exercised awards. The actual tax benefit realized for the tax deductions from the exercise of share-based awards was $10 million and $3 million as of December 31, 2013 and 2012, respectively.
In connection with the IPO of Genworth Canada in July 2009, our indirect subsidiary, Genworth Canada, granted stock options and other equity-based awards to its Canadian employees. As of December 31, 2013, Genworth Canada had outstanding 986,908 of stock options and 176,852 of RSUs and performance stock units (“PSUs”) and 44,736 of DSUs, all of which were vested. Genworth Canada also granted 20,153 executive deferred stock units (“EDSUs”) during 2013, all of which were outstanding as of December 31, 2013. The EDSUs were introduced as part of a share-based compensation plan intended for executive level employees entitling them to receive an amount equal to the fair value of Genworth Canada stock. As of December 31, 2012, Genworth Canada had outstanding 1,027,130 of stock options and 142,972 of RSUs and PSUs and 34,412 of DSUs, all of which were vested. For the years ended December 31, 2013 and 2012, we recorded stock-based compensation expense of $11 million and $3 million, respectively. For the year ended December 31, 2011, we recorded a benefit from stock-based compensation of $1 million. For the years ended December 31, 2013, 2012 and 2011, we estimated total unrecognized expense of $3 million, $1 million and $1 million, respectively, related to these awards.
(17) Fair Value of Financial Instruments
Assets and liabilities that are reflected in the accompanying consolidated financial statements at fair value are not included in the following disclosure of fair value. Such items include cash and cash equivalents, investment securities, separate accounts, securities held as collateral and derivative instruments. Other financial assets and liabilities—those not carried at fair value—are discussed below. Apart from certain of our borrowings and certain marketable securities, few of the instruments discussed below are actively traded and their fair values
296
GENWORTH FINANCIAL, INC.
NOTES TO CONSOLIDATED FINANCIAL STATEMENTS
Years Ended December 31, 2013, 2012 and 2011
must often be determined using models. The fair value estimates are made at a specific point in time, based upon available market information and judgments about the financial instruments, including estimates of the timing and amount of expected future cash flows and the credit standing of counterparties. Such estimates do not reflect any premium or discount that could result from offering for sale at one time our entire holdings of a particular financial instrument, nor do they consider the tax impact of the realization of unrealized gains or losses. In many cases, the fair value estimates cannot be substantiated by comparison to independent markets.
The basis on which we estimate fair value is as follows:
Commercial mortgage loans. Based on recent transactions and/or discounted future cash flows, using current market rates. Given the limited availability of data related to transactions for similar instruments, we typically classify these loans as Level 3.
Restricted commercial mortgage loans. Based on recent transactions and/or discounted future cash flows, using current market rates. Given the limited availability of data related to transactions for similar instruments, we typically classify these loans as Level 3.
Other invested assets. Limited partnerships are valued based on comparable market transactions, discounted future cash flows, quoted market prices and/or estimates using the most recent data available for the underlying instrument. Primarily represents short-term investments and limited partnerships accounted for under the cost method. The fair value of short-term investments typically does not include significant unobservable inputs and approximate our amortized cost basis. As a result, short-term investments are classified as Level 2. Cost method limited partnerships typically include significant unobservable inputs as a result of being relatively illiquid with limited market activity for similar instruments and are classified as Level 3.
Long-term borrowings. We utilize available market data when determining fair value of long-term borrowings issued in the United States and Canada, which includes data on recent trades for the same or similar financial instruments. Accordingly, these instruments are classified as Level 2 measurements. In cases where market data is not available such as our Australian borrowings, we use broker quotes for which we consider the valuation methodology utilized by the third party, but the valuation typically includes significant unobservable inputs. Accordingly, we classify these borrowings where fair value is based on our consideration of broker quotes as Level 3 measurements.
Non-recourse funding obligations. We use an internal model to determine fair value using the current floating rate coupon and expected life/final maturity of the instrument discounted using the floating rate index and current market spread assumption, which is estimated based on recent transactions for these instruments or similar instruments as well as other market information or broker provided data. Given these instruments are private and very little market activity exists, our current market spread assumption is considered to have significant unobservable inputs in calculating fair value and, therefore, results in the fair value of these instruments being classified as Level 3.
Borrowings related to securitization entities. Based on market quotes or comparable market transactions. Some of these borrowings are publicly traded debt securities and are classified as Level 2. Certain borrowings are not publicly traded and are classified as Level 3.
Investment contracts. Based on expected future cash flows, discounted at current market rates for annuity contracts or institutional products. Given the significant unobservable inputs associated with policyholder behavior and current market rate assumptions used to discount the expected future cash flows, we classify these
297
GENWORTH FINANCIAL, INC.
NOTES TO CONSOLIDATED FINANCIAL STATEMENTS
Years Ended December 31, 2013, 2012 and 2011
instruments as Level 3 except for certain funding agreement-backed notes that are traded in the marketplace as a security and are classified as Level 2.
The following represents our estimated fair value of financial assets and liabilities that are not required to be carried at fair value as of December 31:
| 2013 | ||||||||||||||||||||||||
| (Amounts in millions) |
Notional amount |
Carrying amount |
Fair value | |||||||||||||||||||||
| Total | Level 1 | Level 2 | Level 3 | |||||||||||||||||||||
| Assets: |
||||||||||||||||||||||||
| Commercial mortgage loans |
$ | (1) | $ | 5,899 | $ | 6,137 | $ | — | $ | — | $ | 6,137 | ||||||||||||
| Restricted commercial mortgage loans (2) |
(1) | 233 | 258 | — | — | 258 | ||||||||||||||||||
| Other invested assets |
(1) | 307 | 311 | — | 221 | 90 | ||||||||||||||||||
| Liabilities: |
||||||||||||||||||||||||
| Long-term borrowings (3) |
(1) | 5,161 | 5,590 | — | 5,460 | 130 | ||||||||||||||||||
| Non-recourse funding obligations (3) |
(1) | 2,038 | 1,459 | — | — | 1,459 | ||||||||||||||||||
| Borrowings related to securitization entities (2) |
(1) | 167 | 182 | — | 182 | — | ||||||||||||||||||
| Investment contracts |
(1) | 17,330 | 17,827 | — | 86 | 17,741 | ||||||||||||||||||
| Other firm commitments: |
||||||||||||||||||||||||
| Commitments to fund limited partnerships |
65 | — | — | — | — | — | ||||||||||||||||||
| Ordinary course of business lending commitments |
138 | — | — | — | — | — | ||||||||||||||||||
| 2012 | ||||||||||||||||||||||||
| (Amounts in millions) |
Notional amount |
Carrying amount |
Fair value | |||||||||||||||||||||
| Total | Level 1 | Level 2 | Level 3 | |||||||||||||||||||||
| Assets: |
||||||||||||||||||||||||
| Commercial mortgage loans |
$ | (1) | $ | 5,872 | $ | 6,378 | $ | — | $ | — | $ | 6,378 | ||||||||||||
| Restricted commercial mortgage loans (2) |
(1) | 341 | 389 | — | — | 389 | ||||||||||||||||||
| Other invested assets |
(1) | 380 | 389 | — | 265 | 124 | ||||||||||||||||||
| Liabilities: |
||||||||||||||||||||||||
| Long-term borrowings (3) |
(1) | 4,776 | 4,950 | — | 4,800 | 150 | ||||||||||||||||||
| Non-recourse funding obligations (3) |
(1) | 2,066 | 1,462 | — | — | 1,462 | ||||||||||||||||||
| Borrowings related to securitization entities (2) |
(1) | 274 | 303 | — | 238 | 65 | ||||||||||||||||||
| Investment contracts |
(1) | 18,280 | 19,526 | — | 1,009 | 18,517 | ||||||||||||||||||
| Other firm commitments: |
||||||||||||||||||||||||
| Commitments to fund limited partnerships |
64 | — | — | — | — | — | ||||||||||||||||||
| Ordinary course of business lending commitments |
44 | — | — | — | — | — | ||||||||||||||||||
| (1) | These financial instruments do not have notional amounts. |
| (2) | See note 18 for additional information related to consolidated securitization entities. |
| (3) | See note 13 for additional information related to borrowings. |
Recurring Fair Value Measurements
We have fixed maturity, equity and trading securities, derivatives, embedded derivatives, securities held as collateral, separate account assets and certain other financial instruments, which are carried at fair value. Below
298
GENWORTH FINANCIAL, INC.
NOTES TO CONSOLIDATED FINANCIAL STATEMENTS
Years Ended December 31, 2013, 2012 and 2011
is a description of the valuation techniques and inputs used to determine fair value by class of instrument.
Fixed maturity, equity and trading securities
The valuations of fixed maturity, equity and trading securities are determined using a market approach, income approach or a combination of the market and income approach depending on the type of instrument and availability of information. For all exchange-traded equity securities, the valuations are classified as Level 1.
We utilize certain third-party data providers when determining fair value. We consider information obtained from third-party pricing services (“pricing services”) as well as third-party broker provided prices, or broker quotes, in our determination of fair value. Additionally, we utilize internal models to determine the valuation of securities using an income approach where the inputs are based on third-party provided market inputs. While we consider the valuations provided by pricing services and broker quotes to be of high quality, management determines the fair value of our investment securities after considering all relevant and available information. We also use various methods to obtain an understanding of the valuation methodologies and procedures used by third-party data providers to ensure sufficient understanding to evaluate the valuation data received, including an understanding of the assumptions and inputs utilized to determine the appropriate fair value. For pricing services, we analyze the prices provided by our primary pricing services to other readily available pricing services and perform a detailed review of the assumptions and inputs from each pricing service to determine the appropriate fair value when pricing differences exceed certain thresholds. We also evaluate changes in fair value that are greater than 10% each month to further aid in our review of the accuracy of fair value measurements and our understanding of changes in fair value, with more detailed reviews performed by the asset managers responsible for the related asset class associated with the security being reviewed.
In general, we first obtain valuations from pricing services. If a price is not supplied by a pricing service, we will typically seek a broker quote for public or private fixed maturity securities. In certain instances, we utilize price caps for broker quoted securities where the estimated market yield results in a valuation that may exceed the amount that would be received in a market transaction. For certain private fixed maturity securities where we do not obtain valuations from pricing services, we utilize an internal model to determine fair value since transactions for identical securities are not readily observable and these securities are not typically valued by pricing services. For all securities, excluding certain private fixed maturity securities, if neither a pricing service nor broker quotes valuation is available, we determine fair value using internal models.
For pricing services, we obtain an understanding of the pricing methodologies and procedures for each type of instrument. Additionally, on a monthly basis we review a sample of securities, examining the pricing service’s assumptions to determine if we agree with the service’s derived price. In general, a pricing service does not provide a price for a security if sufficient information is not readily available to determine fair value or if such security is not in the specific sector or class covered by a particular pricing service. Given our understanding of the pricing methodologies and procedures of pricing services, the securities valued by pricing services are typically classified as Level 2 unless we determine the valuation process for a security or group of securities utilizes significant unobservable inputs, which would result in the valuation being classified as Level 3.
For private fixed maturity securities, we utilize an internal model to determine fair value and utilize public bond spreads by sector, rating and maturity to develop the market rate that would be utilized for a similar public bond. We then add an additional premium, which represents an unobservable input, to the public bond spread to adjust for the liquidity and other features of our private placements. We utilize the estimated market yield to discount the expected cash flows of the security to determine fair value. In certain instances, we utilize price caps
299
GENWORTH FINANCIAL, INC.
NOTES TO CONSOLIDATED FINANCIAL STATEMENTS
Years Ended December 31, 2013, 2012 and 2011
for securities where the estimated market yield results in a valuation that may exceed the amount that would be received in a market transaction. When a security does not have an external rating, we assign the security an internal rating to determine the appropriate public bond spread that should be utilized in the valuation. While we generally consider the public bond spreads by sector and maturity to be observable inputs, we evaluate the similarities of our private placement with the public bonds, any price caps utilized, liquidity premiums applied, and whether external ratings are available for our private placement to determine whether the spreads utilized would be considered observable inputs. During the second quarter of 2012, we began classifying private securities without an external rating and public bond spread as Level 3. In general, increases (decreases) in credit spreads will decrease (increase) the fair value for our fixed maturity securities.
For broker quotes, we consider the valuation methodology utilized by the third party, but the valuation typically includes significant unobservable inputs. Accordingly, we classify the securities where fair value is based on our consideration of broker quotes as Level 3 measurements.
For remaining securities priced using internal models, we maximize the use of observable inputs but typically utilize significant unobservable inputs to determine fair value. Accordingly, the valuations are typically classified as Level 3.
Restricted other invested assets related to securitization entities
We have trading securities related to securitization entities that are classified as restricted other invested assets and are carried at fair value. The trading securities represent asset-backed securities. The valuation for trading securities is determined using a market approach and/or an income approach depending on the availability of information. For certain highly rated asset-backed securities, there is observable market information for transactions of the same or similar instruments, which is provided to us by a third-party pricing service and is classified as Level 2. For certain securities that are not actively traded, we determine fair value after considering third-party broker provided prices or discounted expected cash flows using current yields for similar securities and classify these valuations as Level 3.
Securities lending and derivative counterparty collateral
The fair value of securities held as collateral is primarily based on Level 2 inputs from market information for the collateral that is held on our behalf by the custodian. We determine fair value after considering prices obtained by third-party pricing services.
Contingent consideration
We have certain contingent purchase price payments and receivables related to acquisitions and sales that are recorded at fair value each period. Fair value is determined using an income approach whereby we project the expected performance of the business and compare our projections of the relevant performance metric to the thresholds established in the purchase or sale agreement to determine our expected payments or receipts. We then discount these expected amounts to calculate the fair value as of the valuation date. We evaluate the underlying projections used in determining fair value each period and update these underlying projections when there have been significant changes in our expectations of the future business performance. The inputs used to determine the discount rate and expected payments or receipts are primarily based on significant unobservable inputs and result in the fair value of the contingent consideration being classified as Level 3. An increase in the discount rate or a decrease in expected payments or receipts will result in a decrease in the fair value of contingent consideration.
300
GENWORTH FINANCIAL, INC.
NOTES TO CONSOLIDATED FINANCIAL STATEMENTS
Years Ended December 31, 2013, 2012 and 2011
Separate account assets
The fair value of separate account assets is based on the quoted prices of the underlying fund investments and, therefore, represents Level 1 pricing.
Derivatives
We consider counterparty collateral arrangements and rights of set-off when evaluating our net credit risk exposure to our derivative counterparties. Accordingly, we are permitted to include consideration of these arrangements when determining whether any incremental adjustment should be made for both the counterparty’s and our non-performance risk in measuring fair value for our derivative instruments. As a result of these counterparty arrangements, we determined that any adjustment for credit risk would not be material and we do not record any incremental adjustment for our non-performance risk or the non-performance risk of the derivative counterparty for our derivative assets or liabilities. We determine fair value for our derivatives using an income approach with internal models based on relevant market inputs for each derivative instrument. We also compare the fair value determined using our internal model to the valuations provided by our derivative counterparties with any significant differences or changes in valuation being evaluated further by our derivatives professionals that are familiar with the instrument and market inputs used in the valuation.
Interest rate swaps. The valuation of interest rate swaps is determined using an income approach. The primary input into the valuation represents the forward interest rate swap curve, which is generally considered an observable input, and results in the derivative being classified as Level 2. For certain interest rate swaps, the inputs into the valuation also include the total returns of certain bonds that would primarily be considered an observable input and result in the derivative being classified as Level 2. For certain other swaps, there are features that provide an option to the counterparty to terminate the swap at specified dates. The interest rate volatility input used to value these options would be considered a significant unobservable input and results in the fair value measurement of the derivative being classified as Level 3. These options to terminate the swap by the counterparty are based on forward interest rate swap curves and volatility. As interest rate volatility increases, our valuation of the derivative changes unfavorably.
Interest rate swaps related to securitization entities. The valuation of interest rate swaps related to securitization entities is determined using an income approach. The primary input into the valuation represents the forward interest rate swap curve, which is generally considered an observable input, and results in the derivative being classified as Level 2.
Inflation indexed swaps. The valuation of inflation indexed swaps is determined using an income approach. The primary inputs into the valuation represent the forward interest rate swap curve, the current consumer price index and the forward consumer price index curve, which are generally considered observable inputs, and results in the derivative being classified as Level 2.
Foreign currency swaps. The valuation of foreign currency swaps is determined using an income approach. The primary inputs into the valuation represent the forward interest rate swap curve and foreign currency exchange rates, both of which are considered an observable input, and results in the derivative being classified as Level 2.
Credit default swaps. We have both single name credit default swaps and index tranche credit default swaps. For single name credit default swaps, we utilize an income approach to determine fair value based on using current market information for the credit spreads of the reference entity, which is considered observable inputs
301
GENWORTH FINANCIAL, INC.
NOTES TO CONSOLIDATED FINANCIAL STATEMENTS
Years Ended December 31, 2013, 2012 and 2011
based on the reference entities of our derivatives and results in these derivatives being classified as Level 2. For index tranche credit default swaps, we utilize an income approach that utilizes current market information related to credit spreads and expected defaults and losses associated with the reference entities that comprise the respective index associated with each derivative. There are significant unobservable inputs associated with the timing and amount of losses from the reference entities as well as the timing or amount of losses, if any, that will be absorbed by our tranche. Accordingly, the index tranche credit default swaps are classified as Level 3. As credit spreads widen for the underlying issuers comprising the index, the change in our valuation of these credit default swaps will be unfavorable.
Credit default swaps related to securitization entities. Credit default swaps related to securitization entities represent customized index tranche credit default swaps and are valued using a similar methodology as described above for index tranche credit default swaps. We determine fair value of these credit default swaps after considering both the valuation methodology described above as well as the valuation provided by the derivative counterparty. In addition to the valuation methodology and inputs described for index tranche credit default swaps, these customized credit default swaps contain a feature that permits the securitization entity to provide the par value of underlying assets in the securitization entity to settle any losses under the credit default swap. The valuation of this settlement feature is dependent upon the valuation of the underlying assets and the timing and amount of any expected loss on the credit default swap, which is considered a significant unobservable input. Accordingly, these customized index tranche credit default swaps related to securitization entities are classified as Level 3. As credit spreads widen for the underlying issuers comprising the customized index, the change in our valuation of these credit default swaps will be unfavorable.
Equity index options. We have equity index options associated with various equity indices. The valuation of equity index options is determined using an income approach. The primary inputs into the valuation represent forward interest rate volatility and time value component associated with the optionality in the derivative, which are considered significant unobservable inputs in most instances. The equity index volatility surface is determined based on market information that is not readily observable and is developed based upon inputs received from several third-party sources. Accordingly, these options are classified as Level 3. As equity index volatility increases, our valuation of these options changes favorably.
Financial futures. The fair value of financial futures is based on the closing exchange prices. Accordingly, these financial futures are classified as Level 1. The period end valuation is zero as a result of settling the margins on these contracts on a daily basis.
Equity return swaps. The valuation of equity return swaps is determined using an income approach. The primary inputs into the valuation represent the forward interest rate swap curve and underlying equity index values, which are generally considered observable inputs, and results in the derivative being classified as Level 2.
Forward bond purchase commitments. The valuation of forward bond purchase commitments is determined using an income approach. The primary input into the valuation represents the current bond prices and interest rates, which are generally considered an observable input, and results in the derivative being classified as Level 2.
Other foreign currency contracts. We have certain foreign currency options classified as other foreign currency contracts. The valuation of foreign currency options is determined using an income approach. The primary inputs into the valuation represent the forward interest rate swap curve, foreign currency exchange rates, forward interest rate, foreign currency exchange rate volatility, foreign equity index volatility and time value
302
GENWORTH FINANCIAL, INC.
NOTES TO CONSOLIDATED FINANCIAL STATEMENTS
Years Ended December 31, 2013, 2012 and 2011
component associated with the optionality in the derivative. As a result of the significant unobservable inputs associated with the forward interest rate, foreign currency exchange rate volatility and foreign equity index volatility inputs, the derivative is classified as Level 3. As foreign currency exchange rate volatility and foreign equity index volatility increases, the change in our valuation of these options will be favorable for purchase options and unfavorable for options sold. We also have foreign currency forward contracts where the valuation is determined using an income approach. The primary inputs into the valuation represent the forward foreign currency exchange rates, which are generally considered observable inputs and results in the derivative being classified as Level 2.
GMWB embedded derivatives
We are required to bifurcate an embedded derivative for certain features associated with annuity products and related reinsurance agreements where we provide a GMWB to the policyholder and are required to record the GMWB embedded derivative at fair value. The valuation of our GMWB embedded derivative is based on an income approach that incorporates inputs such as forward interest rates, equity index volatility, equity index and fund correlation, and policyholder assumptions such as utilization, lapse and mortality. In addition to these inputs, we also consider risk and expense margins when determining the projected cash flows that would be determined by another market participant. While the risk and expense margins are considered in determining fair value, these inputs do not have a significant impact on the valuation. We determine fair value using an internal model based on the various inputs noted above. The resulting fair value measurement from the model is reviewed by the product actuarial, risk and finance professionals each reporting period with changes in fair value also being compared to changes in derivatives and other instruments used to mitigate changes in fair value from certain market risks, such as equity index volatility and interest rates.
For GMWB liabilities, non-performance risk is integrated into the discount rate. Our discount rate used to determine fair value of our GMWB liabilities includes market credit spreads above U.S. Treasury rates to reflect an adjustment for the non-performance risk of the GMWB liabilities. As of December 31, 2013 and 2012, the impact of non-performance risk resulted in a lower fair value of our GMWB liabilities of $46 million and $89 million, respectively.
To determine the appropriate discount rate to reflect the non-performance risk of the GMWB liabilities, we evaluate the non-performance risk in our liabilities based on a hypothetical exit market transaction as there is no exit market for these types of liabilities. A hypothetical exit market can be viewed as a hypothetical transfer of the liability to another similarly rated insurance company which would closely resemble a reinsurance transaction. Another hypothetical exit market transaction can be viewed as a hypothetical transaction from the perspective of the GMWB policyholder. In determining the appropriate discount rate to incorporate non-performance risk of the GMWB liabilities, we also considered the impacts of state guarantees embedded in the related insurance product as a form of inseparable third-party guarantee. We believe that a hypothetical exit market participant would use a similar discount rate as described above to value the liabilities.
For equity index volatility, we determine the projected equity market volatility using both historical volatility and projected equity market volatility with more significance being placed on projected near-term volatility and recent historical data. Given the different attributes and market characteristics of GMWB liabilities compared to equity index options in the derivative market, the equity index volatility assumption for GMWB liabilities may be different from the volatility assumption for equity index options, especially for the longer dated points on the curve.
Equity index and fund correlations are determined based on historical price observations for the fund and equity index.
303
GENWORTH FINANCIAL, INC.
NOTES TO CONSOLIDATED FINANCIAL STATEMENTS
Years Ended December 31, 2013, 2012 and 2011
For policyholder assumptions, we use our expected lapse, mortality and utilization assumptions and update these assumptions for our actual experience, as necessary. For our lapse assumption, we adjust our base lapse assumption by policy based on a combination of the policyholder’s current account value and GMWB benefit.
We classify the GMWB valuation as Level 3 based on having significant unobservable inputs, with equity index volatility and non-performance risk being considered the more significant unobservable inputs. As equity index volatility increases, the fair value of the GMWB liabilities will increase. Any increase in non-performance risk would increase the discount rate and would decrease the fair value of the GMWB liability. Additionally, we consider lapse and utilization assumptions to be significant unobservable inputs. An increase in our lapse assumption would decrease the fair value of the GMWB liability, whereas an increase in our utilization rate would increase the fair value.
Fixed index annuity embedded derivatives
We offer fixed indexed annuity products where interest is credited to the policyholder’s account balance based on equity index changes. This feature is required to be bifurcated as an embedded derivative and recorded at fair value. Fair value is determined using an income approach where the present value of the excess cash flows above the guaranteed cash flows is used to determine the value attributed to the equity index feature. The inputs used in determining the fair value include policyholder behavior (lapses and withdrawals), near-term equity index volatility, expected future interest credited, forward interest rates and an adjustment to the discount rate to incorporate non-performance risk and risk margins. As a result of our assumptions for policyholder behavior and expected future interest credited being considered significant unobservable inputs, we classify these instruments as Level 3. As lapses and withdrawals increase, the value of our embedded derivative liability will decrease. As expected future interest credited decreases, the value of our embedded derivative liability will decrease.
Borrowings related to securitization entities
We record certain borrowings related to securitization entities at fair value. The fair value of these borrowings is determined using either a market approach or income approach, depending on the instrument and availability of market information. Given the unique characteristics of the securitization entities that issued these borrowings as well as the lack of comparable instruments, we determine fair value considering the valuation of the underlying assets held by the securitization entities and any derivatives, as well as any unique characteristics of the borrowings that may impact the valuation. After considering all relevant inputs, we determine fair value of the borrowings using the net valuation of the underlying assets and derivatives that are backing the borrowings. Accordingly, these instruments are classified as Level 3. Increases in the valuation of the underlying assets or decreases in the derivative liabilities will result in an increase in the fair value of these borrowings.
304
GENWORTH FINANCIAL, INC.
NOTES TO CONSOLIDATED FINANCIAL STATEMENTS
Years Ended December 31, 2013, 2012 and 2011
The following tables set forth our assets and liabilities by class of instrument that are measured at fair value on a recurring basis as of December 31:
| 2013 | ||||||||||||||||
| (Amounts in millions) |
Total | Level 1 | Level 2 | Level 3 | ||||||||||||
| Assets |
||||||||||||||||
| Investments: |
||||||||||||||||
| Fixed maturity securities: |
||||||||||||||||
| U.S. government, agencies and government-sponsored enterprises |
$ | 4,810 | $ | — | $ | 4,805 | $ | 5 | ||||||||
| Tax-exempt |
295 | — | 295 | — | ||||||||||||
| Government—non-U.S. |
2,146 | — | 2,123 | 23 | ||||||||||||
| U.S. corporate |
25,035 | — | 22,635 | 2,400 | ||||||||||||
| Corporate—non-U.S. |
15,071 | — | 13,252 | 1,819 | ||||||||||||
| Residential mortgage-backed |
5,225 | — | 5,120 | 105 | ||||||||||||
| Commercial mortgage-backed |
2,898 | — | 2,892 | 6 | ||||||||||||
| Other asset-backed |
3,149 | — | 1,983 | 1,166 | ||||||||||||
|
|
|
|
|
|
|
|
|
|||||||||
| Total fixed maturity securities |
58,629 | — | 53,105 | 5,524 | ||||||||||||
|
|
|
|
|
|
|
|
|
|||||||||
| Equity securities |
341 | 256 | 7 | 78 | ||||||||||||
|
|
|
|
|
|
|
|
|
|||||||||
| Other invested assets: |
||||||||||||||||
| Trading securities |
239 | — | 205 | 34 | ||||||||||||
| Derivative assets: |
||||||||||||||||
| Interest rate swaps |
436 | — | 436 | — | ||||||||||||
| Foreign currency swaps |
4 | — | 4 | — | ||||||||||||
| Credit default swaps |
11 | — | 1 | 10 | ||||||||||||
| Equity index options |
12 | — | — | 12 | ||||||||||||
| Other foreign currency contracts |
8 | — | 5 | 3 | ||||||||||||
|
|
|
|
|
|
|
|
|
|||||||||
| Total derivative assets |
471 | — | 446 | 25 | ||||||||||||
|
|
|
|
|
|
|
|
|
|||||||||
| Securities lending collateral |
187 | — | 187 | — | ||||||||||||
| Derivatives counterparty collateral |
70 | — | 70 | — | ||||||||||||
|
|
|
|
|
|
|
|
|
|||||||||
| Total other invested assets |
967 | — | 908 | 59 | ||||||||||||
|
|
|
|
|
|
|
|
|
|||||||||
| Restricted other invested assets related to securitization entities (1) |
391 | — | 180 | 211 | ||||||||||||
| Reinsurance recoverable (2) |
(1 | ) | — | — | (1 | ) | ||||||||||
| Separate account assets |
10,138 | 10,138 | — | — | ||||||||||||
|
|
|
|
|
|
|
|
|
|||||||||
| Total assets |
$ | 70,465 | $ | 10,394 | $ | 54,200 | $ | 5,871 | ||||||||
|
|
|
|
|
|
|
|
|
|||||||||
| Liabilities |
||||||||||||||||
| Policyholder account balances: |
||||||||||||||||
| GMWB embedded derivatives (3) |
$ | 96 | $ | — | $ | — | $ | 96 | ||||||||
| Fixed index annuity embedded derivatives |
143 | — | — | 143 | ||||||||||||
|
|
|
|
|
|
|
|
|
|||||||||
| Total policyholder account balances |
239 | — | — | 239 | ||||||||||||
|
|
|
|
|
|
|
|
|
|||||||||
| Derivative liabilities: |
||||||||||||||||
| Interest rate swaps |
575 | — | 575 | — | ||||||||||||
| Interest rate swaps related to securitization entities (1) |
16 | — | 16 | — | ||||||||||||
| Inflation indexed swaps |
60 | — | 60 | — | ||||||||||||
| Foreign currency swaps |
2 | — | 2 | — | ||||||||||||
| Credit default swaps related to securitization entities (1) |
32 | — | — | 32 | ||||||||||||
| Equity return swaps |
1 | — | 1 | — | ||||||||||||
| Forward bond purchase commitments |
13 | — | 13 | — | ||||||||||||
| Other foreign currency contracts |
4 | — | 3 | 1 | ||||||||||||
|
|
|
|
|
|
|
|
|
|||||||||
| Total derivative liabilities |
703 | — | 670 | 33 | ||||||||||||
|
|
|
|
|
|
|
|
|
|||||||||
| Borrowings related to securitization entities (1) |
75 | — | — | 75 | ||||||||||||
|
|
|
|
|
|
|
|
|
|||||||||
| Total liabilities |
$ | 1,017 | $ | — | $ | 670 | $ | 347 | ||||||||
|
|
|
|
|
|
|
|
|
|||||||||
| (1) | See note 18 for additional information related to consolidated securitization entities. |
| (2) | Represents embedded derivatives associated with the reinsured portion of our GMWB liabilities. |
| (3) | Represents embedded derivatives associated with our GMWB liabilities, excluding the impact of reinsurance. |
305
GENWORTH FINANCIAL, INC.
NOTES TO CONSOLIDATED FINANCIAL STATEMENTS
Years Ended December 31, 2013, 2012 and 2011
| 2012 | ||||||||||||||||
| (Amounts in millions) |
Total | Level 1 | Level 2 | Level 3 | ||||||||||||
| Assets |
||||||||||||||||
| Investments: |
||||||||||||||||
| Fixed maturity securities: |
||||||||||||||||
| U.S. government, agencies and government-sponsored enterprises |
$ | 5,491 | $ | — | $ | 5,482 | $ | 9 | ||||||||
| Tax-exempt |
294 | — | 294 | — | ||||||||||||
| Government—non-U.S. |
2,422 | — | 2,413 | 9 | ||||||||||||
| U.S. corporate |
26,105 | — | 23,422 | 2,683 | ||||||||||||
| Corporate—non-U.S. |
15,792 | — | 13,809 | 1,983 | ||||||||||||
| Residential mortgage-backed |
6,081 | — | 5,924 | 157 | ||||||||||||
| Commercial mortgage-backed |
3,333 | — | 3,298 | 35 | ||||||||||||
| Other asset-backed |
2,643 | — | 1,779 | 864 | ||||||||||||
|
|
|
|
|
|
|
|
|
|||||||||
| Total fixed maturity securities |
62,161 | — | 56,421 | 5,740 | ||||||||||||
|
|
|
|
|
|
|
|
|
|||||||||
| Equity securities |
518 | 417 | 2 | 99 | ||||||||||||
|
|
|
|
|
|
|
|
|
|||||||||
| Other invested assets: |
||||||||||||||||
| Trading securities |
556 | — | 480 | 76 | ||||||||||||
| Derivative assets: |
||||||||||||||||
| Interest rate swaps |
1,029 | — | 1,027 | 2 | ||||||||||||
| Foreign currency swaps |
34 | — | 34 | — | ||||||||||||
| Credit default swaps |
8 | — | 1 | 7 | ||||||||||||
| Equity index options |
25 | — | — | 25 | ||||||||||||
| Forward bond purchase commitments |
53 | — | 53 | — | ||||||||||||
|
|
|
|
|
|
|
|
|
|||||||||
| Total derivative assets |
1,149 | — | 1,115 | 34 | ||||||||||||
|
|
|
|
|
|
|
|
|
|||||||||
| Securities lending collateral |
187 | — | 187 | — | ||||||||||||
| Derivatives counterparty collateral |
261 | — | 261 | — | ||||||||||||
|
|
|
|
|
|
|
|
|
|||||||||
| Total other invested assets |
2,153 | — | 2,043 | 110 | ||||||||||||
|
|
|
|
|
|
|
|
|
|||||||||
| Restricted other invested assets related to securitization entities (1) |
393 | — | 199 | 194 | ||||||||||||
| Other assets (2) |
9 | — | — | 9 | ||||||||||||
| Reinsurance recoverable (3) |
10 | — | — | 10 | ||||||||||||
| Separate account assets |
9,937 | 9,937 | — | — | ||||||||||||
|
|
|
|
|
|
|
|
|
|||||||||
| Total assets |
$ | 75,181 | $ | 10,354 | $ | 58,665 | $ | 6,162 | ||||||||
|
|
|
|
|
|
|
|
|
|||||||||
| Liabilities |
||||||||||||||||
| Policyholder account balances: |
||||||||||||||||
| GMWB embedded derivatives (4) |
$ | 350 | $ | — | $ | — | $ | 350 | ||||||||
| Fixed index annuity embedded derivatives |
27 | — | — | 27 | ||||||||||||
|
|
|
|
|
|
|
|
|
|||||||||
| Total policyholder account balances |
377 | — | — | 377 | ||||||||||||
|
|
|
|
|
|
|
|
|
|||||||||
| Derivative liabilities: |
||||||||||||||||
| Interest rate swaps |
307 | — | 307 | — | ||||||||||||
| Interest rate swaps related to securitization entities (1) |
27 | — | 27 | — | ||||||||||||
| Inflation indexed swaps |
105 | — | 105 | — | ||||||||||||
| Foreign currency swaps |
1 | — | 1 | — | ||||||||||||
| Credit default swaps |
1 | — | — | 1 | ||||||||||||
| Credit default swaps related to securitization entities (1) |
104 | — | — | 104 | ||||||||||||
| Equity return swaps |
8 | — | 8 | — | ||||||||||||
|
|
|
|
|
|
|
|
|
|||||||||
| Total derivative liabilities |
553 | — | 448 | 105 | ||||||||||||
|
|
|
|
|
|
|
|
|
|||||||||
| Borrowings related to securitization entities (1) |
62 | — | — | 62 | ||||||||||||
|
|
|
|
|
|
|
|
|
|||||||||
| Total liabilities |
$ | 992 | $ | — | $ | 448 | $ | 544 | ||||||||
|
|
|
|
|
|
|
|
|
|||||||||
| (1) | See note 18 for additional information related to consolidated securitization entities. |
| (2) | Represents contingent receivables associated with recent business dispositions. |
| (3) | Represents embedded derivatives associated with the reinsured portion of our GMWB liabilities. |
| (4) | Represents embedded derivatives associated with our GMWB liabilities, excluding the impact of reinsurance. |
306
GENWORTH FINANCIAL, INC.
NOTES TO CONSOLIDATED FINANCIAL STATEMENTS
Years Ended December 31, 2013, 2012 and 2011
We review the fair value hierarchy classifications each reporting period. Changes in the observability of the valuation attributes may result in a reclassification of certain financial assets or liabilities. Such reclassifications are reported as transfers between levels at the beginning fair value for the reporting period in which the changes occur. Given the types of assets classified as Level 1, which primarily represents mutual fund investments, we typically do not have any transfers between Level 1 and Level 2 measurement categories and did not have any such transfers during any period presented.
Our assessment of whether or not there were significant unobservable inputs related to fixed maturity securities was based on our observations obtained through the course of managing our investment portfolio, including interaction with other market participants, observations related to the availability and consistency of pricing and/or rating, and understanding of general market activity such as new issuance and the level of secondary market trading for a class of securities. Additionally, we considered data obtained from third-party pricing sources to determine whether our estimated values incorporate significant unobservable inputs that would result in the valuation being classified as Level 3.
307
GENWORTH FINANCIAL, INC.
NOTES TO CONSOLIDATED FINANCIAL STATEMENTS
Years Ended December 31, 2013, 2012 and 2011
The following tables present additional information about assets measured at fair value on a recurring basis and for which we have utilized significant unobservable (Level 3) inputs to determine fair value as of or for the dates indicated:
| Beginning balance as of January 1, 2013 |
Total realized and unrealized gains (losses) |
Purchases | Sales | Issuances | Settlements | Transfer into Level 3 |
Transfer out of Level 3 |
Ending balance as of December 31, 2013 |
Total
gains (losses) included in net income attributable to assets still held |
|||||||||||||||||||||||||||||||||||
| (Amounts in millions) |
Included in net income |
Included in OCI |
||||||||||||||||||||||||||||||||||||||||||
| Fixed maturity securities: |
||||||||||||||||||||||||||||||||||||||||||||
| U.S. government, agencies and government-sponsored enterprises |
$ | 9 | $ | — | $ | — | $ | — | $ | — | $ | — | $ | (4 | ) | $ | — | $ | — | $ | 5 | $ | — | |||||||||||||||||||||
| Government—non-U.S. |
9 | — | 1 | — | — | — | (3 | ) | 16 | — | 23 | — | ||||||||||||||||||||||||||||||||
| U.S. corporate (1) |
2,683 | 18 | (15 | ) | 178 | (151 | ) | — | (349 | ) | 195 | (159 | ) | 2,400 | 13 | |||||||||||||||||||||||||||||
| Corporate—non-U.S. (1) |
1,983 | 4 | (24 | ) | 120 | (33 | ) | — | (220 | ) | 76 | (87 | ) | 1,819 | 2 | |||||||||||||||||||||||||||||
| Residential mortgage-backed |
157 | (9 | ) | 7 | — | (8 | ) | — | (29 | ) | 14 | (27 | ) | 105 | — | |||||||||||||||||||||||||||||
| Commercial mortgage- backed |
35 | (5 | ) | (1 | ) | — | — | — | (32 | ) | 11 | (2 | ) | 6 | (4 | ) | ||||||||||||||||||||||||||||
| Other asset-backed (1) |
864 | 4 | 10 | 200 | (49 | ) | — | (89 | ) | 246 | (20 | ) | 1,166 | 4 | ||||||||||||||||||||||||||||||
|
|
|
|
|
|
|
|
|
|
|
|
|
|
|
|
|
|
|
|
|
|
|
|||||||||||||||||||||||
| Total fixed maturity securities |
5,740 | 12 | (22 | ) | 498 | (241 | ) | — | (726 | ) | 558 | (295 | ) | 5,524 | 15 | |||||||||||||||||||||||||||||
|
|
|
|
|
|
|
|
|
|
|
|
|
|
|
|
|
|
|
|
|
|
|
|||||||||||||||||||||||
| Equity securities |
99 | 2 | — | 1 | (24 | ) | — | — | — | — | 78 | — | ||||||||||||||||||||||||||||||||
|
|
|
|
|
|
|
|
|
|
|
|
|
|
|
|
|
|
|
|
|
|
|
|||||||||||||||||||||||
| Other invested assets: |
||||||||||||||||||||||||||||||||||||||||||||
| Trading securities |
76 | 7 | — | — | (40 | ) | — | (9 | ) | — | — | 34 | 2 | |||||||||||||||||||||||||||||||
| Derivative assets: |
||||||||||||||||||||||||||||||||||||||||||||
| Interest rate swaps |
2 | (1 | ) | — | — | — | — | (1 | ) | — | — | — | (1 | ) | ||||||||||||||||||||||||||||||
| Credit default swaps |
7 | 12 | — | — | — | — | (9 | ) | — | — | 10 | 6 | ||||||||||||||||||||||||||||||||
| Equity index options |
25 | (43 | ) | — | 39 | — | — | (9 | ) | — | — | 12 | (40 | ) | ||||||||||||||||||||||||||||||
| Other foreign currency contracts |
— | (1 | ) | — | 4 | — | — | — | — | — | 3 | (1 | ) | |||||||||||||||||||||||||||||||
|
|
|
|
|
|
|
|
|
|
|
|
|
|
|
|
|
|
|
|
|
|
|
|||||||||||||||||||||||
| Total derivative assets |
34 | (33 | ) | — | 43 | — | — | (19 | ) | — | — | 25 | (36 | ) | ||||||||||||||||||||||||||||||
|
|
|
|
|
|
|
|
|
|
|
|
|
|
|
|
|
|
|
|
|
|
|
|||||||||||||||||||||||
| Total other invested assets |
110 | (26 | ) | — | 43 | (40 | ) | — | (28 | ) | — | — | 59 | (34 | ) | |||||||||||||||||||||||||||||
|
|
|
|
|
|
|
|
|
|
|
|
|
|
|
|
|
|
|
|
|
|
|
|||||||||||||||||||||||
| Restricted other invested assets related to securitization entities (2) |
194 | (1 | ) | — | 19 | — | — | (20 | ) | 19 | — | 211 | (1 | ) | ||||||||||||||||||||||||||||||
| Other assets (3) |
9 | — | — | — | — | — | (9 | ) | — | — | — | — | ||||||||||||||||||||||||||||||||
| Reinsurance recoverable (4) |
10 | (14 | ) | — | — | — | 3 | — | — | — | (1 | ) | (14 | ) | ||||||||||||||||||||||||||||||
|
|
|
|
|
|
|
|
|
|
|
|
|
|
|
|
|
|
|
|
|
|
|
|||||||||||||||||||||||
| Total Level 3 assets |
$ | 6,162 | $ | (27 | ) | $ | (22 | ) | $ | 561 | $ | (305 | ) | $ | 3 | $ | (783 | ) | $ | 577 | $ | (295 | ) | $ | 5,871 | $ | (34 | ) | ||||||||||||||||
|
|
|
|
|
|
|
|
|
|
|
|
|
|
|
|
|
|
|
|
|
|
|
|||||||||||||||||||||||
| (1) | The transfers into and out of Level 3 for fixed maturity securities were related to changes in the primary pricing source and changes in the observability of external information used in determining the fair value, such as external ratings or credits spreads. |
| (2) | See note 18 for additional information related to consolidated securitization entities. |
| (3) | Represents contingent receivables associated with recent business dispositions. |
| (4) | Represents embedded derivatives associated with the reinsured portion of our GMWB liabilities. |
308
GENWORTH FINANCIAL, INC.
NOTES TO CONSOLIDATED FINANCIAL STATEMENTS
Years Ended December 31, 2013, 2012 and 2011
| Beginning balance as of January 1, 2012 |
Total realized and unrealized gains (losses) |
Purchases | Sales | Issuances | Settlements | Transfer into Level 3 |
Transfer out of Level 3 |
Ending balance as of December 31, 2012 |
Total
gains (losses) included in net income attributable to assets still held |
|||||||||||||||||||||||||||||||||||
| (Amounts in millions) |
Included in net income |
Included in OCI |
||||||||||||||||||||||||||||||||||||||||||
| Fixed maturity securities: |
||||||||||||||||||||||||||||||||||||||||||||
| U.S. government, agencies and government-sponsored enterprises |
$ | 13 | $ | — | $ | — | $ | — | $ | — | $ | — | $ | — | $ | 9 | $ | (13 | ) | $ | 9 | $ | — | |||||||||||||||||||||
| Government—non-U.S. |
10 | — | — | — | — | — | (1 | ) | — | — | 9 | — | ||||||||||||||||||||||||||||||||
| U.S. corporate (1) |
2,511 | 12 | 118 | 147 | (122 | ) | — | (214 | ) | 726 | (495 | ) | 2,683 | 14 | ||||||||||||||||||||||||||||||
| Corporate—non-U.S. (1) |
1,284 | 3 | 92 | 269 | (29 | ) | — | (186 | ) | 711 | (161 | ) | 1,983 | 2 | ||||||||||||||||||||||||||||||
| Residential mortgage-backed (1) |
95 | (7 | ) | 14 | 20 | (17 | ) | — | (31 | ) | 86 | (3 | ) | 157 | (7 | ) | ||||||||||||||||||||||||||||
| Commercial mortgage-backed |
39 | (2 | ) | 5 | — | (1 | ) | — | (2 | ) | 3 | (7 | ) | 35 | (1 | ) | ||||||||||||||||||||||||||||
| Other asset-backed (1) |
271 | (2 | ) | 45 | 350 | (46 | ) | — | (94 | ) | 369 | (29 | ) | 864 | 2 | |||||||||||||||||||||||||||||
|
|
|
|
|
|
|
|
|
|
|
|
|
|
|
|
|
|
|
|
|
|
|
|||||||||||||||||||||||
| Total fixed maturity securities |
4,223 | 4 | 274 | 786 | (215 | ) | — | (528 | ) | 1,904 | (708 | ) | 5,740 | 10 | ||||||||||||||||||||||||||||||
|
|
|
|
|
|
|
|
|
|
|
|
|
|
|
|
|
|
|
|
|
|
|
|||||||||||||||||||||||
| Equity securities |
98 | 1 | (2 | ) | 10 | (8 | ) | — | — | — | — | 99 | — | |||||||||||||||||||||||||||||||
|
|
|
|
|
|
|
|
|
|
|
|
|
|
|
|
|
|
|
|
|
|
|
|||||||||||||||||||||||
| Other invested assets: |
||||||||||||||||||||||||||||||||||||||||||||
| Trading securities |
264 | 13 | — | 24 | (72 | ) | — | (125 | ) | 4 | (32 | ) | 76 | 15 | ||||||||||||||||||||||||||||||
| Derivative assets: |
||||||||||||||||||||||||||||||||||||||||||||
| Interest rate swaps |
5 | — | — | — | — | — | (3 | ) | — | — | 2 | — | ||||||||||||||||||||||||||||||||
| Credit default swaps |
— | 12 | — | — | — | — | (5 | ) | — | — | 7 | 12 | ||||||||||||||||||||||||||||||||
| Equity index options |
39 | (59 | ) | — | 55 | — | — | (10 | ) | — | — | 25 | (42 | ) | ||||||||||||||||||||||||||||||
| Other foreign currency options |
9 | (11 | ) | — | 3 | — | — | (1 | ) | — | — | — | (11 | ) | ||||||||||||||||||||||||||||||
|
|
|
|
|
|
|
|
|
|
|
|
|
|
|
|
|
|
|
|
|
|
|
|||||||||||||||||||||||
| Total derivative assets |
53 | (58 | ) | — | 58 | — | — | (19 | ) | — | — | 34 | (41 | ) | ||||||||||||||||||||||||||||||
|
|
|
|
|
|
|
|
|
|
|
|
|
|
|
|
|
|
|
|
|
|
|
|||||||||||||||||||||||
| Total other invested assets |
317 | (45 | ) | — | 82 | (72 | ) | — | (144 | ) | 4 | (32 | ) | 110 | (26 | ) | ||||||||||||||||||||||||||||
|
|
|
|
|
|
|
|
|
|
|
|
|
|
|
|
|
|
|
|
|
|
|
|||||||||||||||||||||||
| Restricted other invested assets related to securitization entities (2) |
176 | 18 | — | 100 | (100 | ) | — | — | — | — | 194 | 13 | ||||||||||||||||||||||||||||||||
| Other assets (3) |
— | (7 | ) | — | — | — | 16 | — | — | — | 9 | (7 | ) | |||||||||||||||||||||||||||||||
| Reinsurance recoverable (4) |
16 | (9 | ) | — | — | — | 3 | — | — | — | 10 | (9 | ) | |||||||||||||||||||||||||||||||
|
|
|
|
|
|
|
|
|
|
|
|
|
|
|
|
|
|
|
|
|
|
|
|||||||||||||||||||||||
| Total Level 3 assets |
$ | 4,830 | $ | (38 | ) | $ | 272 | $ | 978 | $ | (395 | ) | $ | 19 | $ | (672 | ) | $ | 1,908 | $ | (740 | ) | $ | 6,162 | $ | (19 | ) | |||||||||||||||||
|
|
|
|
|
|
|
|
|
|
|
|
|
|
|
|
|
|
|
|
|
|
|
|||||||||||||||||||||||
| (1) | The transfers into and out of Level 3 were primarily related to private fixed rate U.S. corporate and corporate—non-U.S. securities and resulted from a change in the observability of the additional premium to the public bond spread to adjust for the liquidity and other features of our private placements and resulted in unobservable inputs having a significant impact on certain valuations for transfers in or no longer having significant impact on certain valuations for transfers out. During the second quarter of 2012, we began classifying private securities without an external rating as Level 3, which resulted in a significant number of securities being transferred into Level 3. The transfers into Level 3 for structured securities primarily related to securities that were recently purchased and initially classified as Level 2 based on market data that existed at the time of purchase and subsequent valuation included significant unobservable inputs. |
| (2) | See note 18 for additional information related to consolidated securitization entities. |
| (3) | Represents contingent receivables associated with recent business dispositions. |
| (4) | Represents embedded derivatives associated with the reinsured portion of our GMWB liabilities. |
309
GENWORTH FINANCIAL, INC.
NOTES TO CONSOLIDATED FINANCIAL STATEMENTS
Years Ended December 31, 2013, 2012 and 2011
| Beginning balance as of January 1, 2011 |
Total realized and unrealized gains (losses) |
Purchases | Sales | Issuances | Settlements | Transfer into Level 3 |
Transfer out of Level 3 |
Ending balance as of December 31, 2011 |
Total
gains (losses) included in net income attributable to assets still held |
|||||||||||||||||||||||||||||||||||
| (Amounts in millions) |
Included in net income |
Included in OCI |
||||||||||||||||||||||||||||||||||||||||||
| Fixed maturity securities: |
||||||||||||||||||||||||||||||||||||||||||||
| U.S. government, agencies and government-sponsored enterprises |
$ | 11 | $ | — | $ | — | $ | — | $ | — | $ | — | $ | — | $ | 24 | $ | (22 | ) | $ | 13 | $ | — | |||||||||||||||||||||
| Government—non-U.S. |
1 | — | — | — | — | — | — | 9 | — | 10 | — | |||||||||||||||||||||||||||||||||
| U.S. corporate (1) |
1,100 | (8 | ) | 72 | 113 | (25 | ) | — | (105 | ) | 1,790 | (426 | ) | 2,511 | (8 | ) | ||||||||||||||||||||||||||||
| Corporate—non-U.S. (1) |
368 | (26 | ) | 11 | 103 | (71 | ) | — | (13 | ) | 1,132 | (220 | ) | 1,284 | (26 | ) | ||||||||||||||||||||||||||||
| Residential mortgage- backed |
143 | (1 | ) | (11 | ) | 3 | (15 | ) | — | (30 | ) | 9 | (3 | ) | 95 | (1 | ) | |||||||||||||||||||||||||||
| Commercial mortgage- backed |
50 | (2 | ) | 2 | — | (1 | ) | — | (11 | ) | 1 | — | 39 | (2 | ) | |||||||||||||||||||||||||||||
| Other asset-backed |
268 | — | — | 8 | (8 | ) | — | (43 | ) | 46 | — | 271 | — | |||||||||||||||||||||||||||||||
|
|
|
|
|
|
|
|
|
|
|
|
|
|
|
|
|
|
|
|
|
|
|
|||||||||||||||||||||||
| Total fixed maturity securities |
1,941 | (37 | ) | 74 | 227 | (120 | ) | — | (202 | ) | 3,011 | (671 | ) | 4,223 | (37 | ) | ||||||||||||||||||||||||||||
|
|
|
|
|
|
|
|
|
|
|
|
|
|
|
|
|
|
|
|
|
|
|
|||||||||||||||||||||||
| Equity securities |
87 | 1 | 1 | 24 | (13 | ) | — | (2 | ) | — | — | 98 | — | |||||||||||||||||||||||||||||||
|
|
|
|
|
|
|
|
|
|
|
|
|
|
|
|
|
|
|
|
|
|
|
|||||||||||||||||||||||
| Other invested assets: |
||||||||||||||||||||||||||||||||||||||||||||
| Trading securities |
329 | (1 | ) | — | 5 | (41 | ) | — | (28 | ) | — | — | 264 | (1 | ) | |||||||||||||||||||||||||||||
| Derivative assets: |
||||||||||||||||||||||||||||||||||||||||||||
| Interest rate swaps |
5 | 1 | — | — | — | — | (1 | ) | — | — | 5 | 1 | ||||||||||||||||||||||||||||||||
| Credit default swaps |
6 | (6 | ) | — | — | — | — | — | — | — | — | (6 | ) | |||||||||||||||||||||||||||||||
| Equity index options |
33 | 7 | — | 44 | — | — | (45 | ) | — | — | 39 | 7 | ||||||||||||||||||||||||||||||||
| Other foreign currency contracts |
— | (1 | ) | — | 10 | — | — | — | — | — | 9 | (1 | ) | |||||||||||||||||||||||||||||||
|
|
|
|
|
|
|
|
|
|
|
|
|
|
|
|
|
|
|
|
|
|
|
|||||||||||||||||||||||
| Total derivative assets |
44 | 1 | — | 54 | — | — | (46 | ) | — | — | 53 | 1 | ||||||||||||||||||||||||||||||||
|
|
|
|
|
|
|
|
|
|
|
|
|
|
|
|
|
|
|
|
|
|
|
|||||||||||||||||||||||
| Total other invested assets |
373 | — | — | 59 | (41 | ) | — | (74 | ) | — | — | 317 | — | |||||||||||||||||||||||||||||||
|
|
|
|
|
|
|
|
|
|
|
|
|
|
|
|
|
|
|
|
|
|
|
|||||||||||||||||||||||
| Restricted other invested assets related to securitization entities (2) |
171 | 5 | — | — | — | — | — | — | — | 176 | 5 | |||||||||||||||||||||||||||||||||
| Reinsurance recoverable (3) |
(5 | ) | 18 | — | — | — | 3 | — | — | — | 16 | 18 | ||||||||||||||||||||||||||||||||
|
|
|
|
|
|
|
|
|
|
|
|
|
|
|
|
|
|
|
|
|
|
|
|||||||||||||||||||||||
| Total Level 3 assets |
$ | 2,567 | $ | (13 | ) | $ | 75 | $ | 310 | $ | (174 | ) | $ | 3 | $ | (278 | ) | $ | 3,011 | $ | (671 | ) | $ | 4,830 | $ | (14 | ) | |||||||||||||||||
|
|
|
|
|
|
|
|
|
|
|
|
|
|
|
|
|
|
|
|
|
|
|
|||||||||||||||||||||||
| (1) | The majority of the transfers into Level 3 during the fourth quarter of 2011 related to a reclassification of certain private securities valued using internal models which previously had not been identified as having significant unobservable inputs. Prior to the fourth quarter of 2011, these securities had been misclassified as Level 2. The remaining transfers into and out of Level 3 were primarily related to private fixed rate U.S. and non-U.S. corporate securities and resulted from a change in the observability of the additional premium to the public bond spread to adjust for the liquidity and other features of our private placements and resulted in unobservable inputs having a significant impact on certain valuations for transfers in or no longer having significant impact on certain valuations for transfers out. |
| (2) | See note 18 for additional information related to consolidated securitization entities. |
| (3) | Represents embedded derivatives associated with the reinsured portion of our GMWB liabilities. |
310
GENWORTH FINANCIAL, INC.
NOTES TO CONSOLIDATED FINANCIAL STATEMENTS
Years Ended December 31, 2013, 2012 and 2011
The following table presents the gains and losses included in net income from assets measured at fair value on a recurring basis and for which we have utilized significant unobservable (Level 3) inputs to determine fair value and the related income statement line item in which these gains and losses were presented for the years ended December 31:
| (Amounts in millions) |
2013 | 2012 | 2011 | |||||||||
| Total realized and unrealized gains (losses) included in net income: |
||||||||||||
| Net investment income |
$ | 35 | $ | 32 | $ | 24 | ||||||
| Net investment gains (losses) |
(62 | ) | (70 | ) | (37 | ) | ||||||
|
|
|
|
|
|
|
|||||||
| Total |
$ | (27 | ) | $ | (38 | ) | $ | (13 | ) | |||
|
|
|
|
|
|
|
|||||||
| Total gains (losses) included in net income attributable to assets still held: |
||||||||||||
| Net investment income |
$ | 33 | $ | 25 | $ | 25 | ||||||
| Net investment gains (losses) |
(67 | ) | (44 | ) | (39 | ) | ||||||
|
|
|
|
|
|
|
|||||||
| Total |
$ | (34 | ) | $ | (19 | ) | $ | (14 | ) | |||
|
|
|
|
|
|
|
|||||||
The amount presented for unrealized gains (losses) included in net income for available-for-sale securities represents impairments and accretion on certain fixed maturity securities.
311
GENWORTH FINANCIAL, INC.
NOTES TO CONSOLIDATED FINANCIAL STATEMENTS
Years Ended December 31, 2013, 2012 and 2011
The following tables present additional information about liabilities measured at fair value on a recurring basis and for which we have utilized significant unobservable (Level 3) inputs to determine fair value as of or for the dates indicated:
| (Amounts in millions) |
Beginning balance as of January 1, 2013 |
Total realized and unrealized (gains) losses |
Purchases | Sales | Issuances | Settlements | Transfer into Level 3 |
Transfer out of Level 3 |
Ending balance as of December 31, 2013 |
Total
(gains) losses included in net (income) attributable to liabilities still held |
||||||||||||||||||||||||||||||||||
| Included in net (income) |
Included in OCI |
|||||||||||||||||||||||||||||||||||||||||||
| Policyholder account balances: |
||||||||||||||||||||||||||||||||||||||||||||
| GMWB embedded derivatives (1) |
$ | 350 | $ | (291 | ) | $ | — | $ | — | $ | — | $ | 37 | $ | — | $ | — | $ | — | $ | 96 | $ | (289 | ) | ||||||||||||||||||||
| Fixed index annuity embedded derivatives |
27 | 18 | — | — | — | 98 | — | — | — | 143 | 18 | |||||||||||||||||||||||||||||||||
|
|
|
|
|
|
|
|
|
|
|
|
|
|
|
|
|
|
|
|
|
|
|
|||||||||||||||||||||||
| Total policyholder account balances |
377 | (273 | ) | — | — | — | 135 | — | — | — | 239 | (271 | ) | |||||||||||||||||||||||||||||||
|
|
|
|
|
|
|
|
|
|
|
|
|
|
|
|
|
|
|
|
|
|
|
|||||||||||||||||||||||
| Derivative liabilities: |
||||||||||||||||||||||||||||||||||||||||||||
| Credit default swaps |
1 | (1 | ) | — | — | — | — | — | — | — | — | (1 | ) | |||||||||||||||||||||||||||||||
| Credit default swaps related to securitization entities (2) |
104 | (77 | ) | — | 5 | — | — | — | — | — | 32 | (77 | ) | |||||||||||||||||||||||||||||||
| Equity index options |
— | 1 | — | — | — | — | (1 | ) | — | — | — | 1 | ||||||||||||||||||||||||||||||||
| Other foreign currency contracts |
— | (2 | ) | — | 3 | — | — | — | — | — | 1 | (2 | ) | |||||||||||||||||||||||||||||||
|
|
|
|
|
|
|
|
|
|
|
|
|
|
|
|
|
|
|
|
|
|
|
|||||||||||||||||||||||
| Total derivative liabilities |
105 | (79 | ) | — | 8 | — | — | (1 | ) | — | — | 33 | (79 | ) | ||||||||||||||||||||||||||||||
|
|
|
|
|
|
|
|
|
|
|
|
|
|
|
|
|
|
|
|
|
|
|
|||||||||||||||||||||||
| Borrowings related to securitization entities (2) |
62 | 13 | — | — | — | — | — | — | — | 75 | 13 | |||||||||||||||||||||||||||||||||
|
|
|
|
|
|
|
|
|
|
|
|
|
|
|
|
|
|
|
|
|
|
|
|||||||||||||||||||||||
| Total Level 3 liabilities |
$ | 544 | $ | (339 | ) | $ | — | $ | 8 | $ | — | $ | 135 | $ | (1 | ) | $ | — | $ | — | $ | 347 | $ | (337 | ) | |||||||||||||||||||
|
|
|
|
|
|
|
|
|
|
|
|
|
|
|
|
|
|
|
|
|
|
|
|||||||||||||||||||||||
| (1) | Represents embedded derivatives associated with our GMWB liabilities, excluding the impact of reinsurance. |
| (2) | See note 18 for additional information related to consolidated securitization entities. |
312
GENWORTH FINANCIAL, INC.
NOTES TO CONSOLIDATED FINANCIAL STATEMENTS
Years Ended December 31, 2013, 2012 and 2011
| (Amounts in millions) |
Beginning balance as of January 1, 2012 |
Total realized and unrealized (gains) losses |
Purchases | Sales | Issuances | Settlements | Transfer into Level 3 |
Transfer out of Level 3 |
Ending balance as of December 31, 2012 |
Total (gains) losses included in net (income) attributable to liabilities still held |
||||||||||||||||||||||||||||||||||
| Included in net (income) |
Included in OCI |
|||||||||||||||||||||||||||||||||||||||||||
| Policyholder account balances: |
||||||||||||||||||||||||||||||||||||||||||||
| GMWB embedded derivatives (1) |
$ | 492 | $ | (179 | ) | $ | — | $ | — | $ | — | $ | 37 | $ | — | $ | — | $ | — | $ | 350 | $ | (175 | ) | ||||||||||||||||||||
| Fixed index annuity embedded derivatives |
4 | 1 | — | — | — | 22 | — | — | — | 27 | 1 | |||||||||||||||||||||||||||||||||
|
|
|
|
|
|
|
|
|
|
|
|
|
|
|
|
|
|
|
|
|
|
|
|||||||||||||||||||||||
| Total policyholder account balances |
496 | (178 | ) | — | — | — | 59 | — | — | — | 377 | (174 | ) | |||||||||||||||||||||||||||||||
|
|
|
|
|
|
|
|
|
|
|
|
|
|
|
|
|
|
|
|
|
|
|
|||||||||||||||||||||||
| Derivative liabilities: |
||||||||||||||||||||||||||||||||||||||||||||
| Credit default swaps |
57 | (43 | ) | — | 2 | — | — | (15 | ) | — | — | 1 | (40 | ) | ||||||||||||||||||||||||||||||
| Credit default swaps related to securitization entities (2) |
177 | (76 | ) | — | 3 | — | — | — | — | — | 104 | (76 | ) | |||||||||||||||||||||||||||||||
|
|
|
|
|
|
|
|
|
|
|
|
|
|
|
|
|
|
|
|
|
|
|
|||||||||||||||||||||||
| Total derivative liabilities |
234 | (119 | ) | — | 5 | — | — | (15 | ) | — | — | 105 | (116 | ) | ||||||||||||||||||||||||||||||
|
|
|
|
|
|
|
|
|
|
|
|
|
|
|
|
|
|
|
|
|
|
|
|||||||||||||||||||||||
| Borrowings related to securitization entities (2) |
48 | 14 | — | — | — | — | — | — | — | 62 | 14 | |||||||||||||||||||||||||||||||||
|
|
|
|
|
|
|
|
|
|
|
|
|
|
|
|
|
|
|
|
|
|
|
|||||||||||||||||||||||
| Total Level 3 liabilities |
$ | 778 | $ | (283 | ) | $ | — | $ | 5 | $ | — | $ | 59 | $ | (15 | ) | $ | — | $ | — | $ | 544 | $ | (276 | ) | |||||||||||||||||||
|
|
|
|
|
|
|
|
|
|
|
|
|
|
|
|
|
|
|
|
|
|
|
|||||||||||||||||||||||
| (1) | Represents embedded derivatives associated with our GMWB liabilities, excluding the impact of reinsurance. |
| (2) | See note 18 for additional information related to consolidated securitization entities. |
313
GENWORTH FINANCIAL, INC.
NOTES TO CONSOLIDATED FINANCIAL STATEMENTS
Years Ended December 31, 2013, 2012 and 2011
| (Amounts in millions) |
Beginning balance as of January 1, 2011 |
Total realized and unrealized (gains) losses |
Purchases | Sales | Issuances | Settlements | Transfer into Level 3 |
Transfer out of Level 3 |
Ending balance as of December 31, 2011 |
Total (gains) losses included in net (income) attributable to liabilities still held |
||||||||||||||||||||||||||||||||||
| Included in net (income) |
Included in OCI |
|||||||||||||||||||||||||||||||||||||||||||
| Policyholder account balances: |
||||||||||||||||||||||||||||||||||||||||||||
| GMWB embedded |
$ | 121 | $ | 334 | $ | — | $ | — | $ | — | $ | 37 | $ | — | $ | — | $ | — | $ | 492 | $ | 338 | ||||||||||||||||||||||
| Fixed index annuity embedded derivatives |
5 | (1 | ) | — | — | — | — | — | — | — | 4 | (1 | ) | |||||||||||||||||||||||||||||||
|
|
|
|
|
|
|
|
|
|
|
|
|
|
|
|
|
|
|
|
|
|
|
|||||||||||||||||||||||
| Total policyholder account balances |
126 | 333 | — | — | — | 37 | — | — | — | 496 | 337 | |||||||||||||||||||||||||||||||||
|
|
|
|
|
|
|
|
|
|
|
|
|
|
|
|
|
|
|
|
|
|
|
|||||||||||||||||||||||
| Derivative liabilities: |
||||||||||||||||||||||||||||||||||||||||||||
| Credit default swaps |
7 | 48 | — | 3 | — | — | (1 | ) | — | — | 57 | 48 | ||||||||||||||||||||||||||||||||
| Credit default swaps related to securitization entities (2) |
129 | 48 | — | — | — | — | — | — | — | 177 | 48 | |||||||||||||||||||||||||||||||||
| Equity index options |
3 | — | — | — | — | — | (3 | ) | — | — | — | — | ||||||||||||||||||||||||||||||||
|
|
|
|
|
|
|
|
|
|
|
|
|
|
|
|
|
|
|
|
|
|
|
|||||||||||||||||||||||
| Total derivative liabilities |
139 | 96 | — | 3 | — | — | (4 | ) | — | — | 234 | 96 | ||||||||||||||||||||||||||||||||
|
|
|
|
|
|
|
|
|
|
|
|
|
|
|
|
|
|
|
|
|
|
|
|||||||||||||||||||||||
| Borrowings related to securitization entities (2) |
51 | (3 | ) | — | — | — | — | — | — | — | 48 | (2 | ) | |||||||||||||||||||||||||||||||
|
|
|
|
|
|
|
|
|
|
|
|
|
|
|
|
|
|
|
|
|
|
|
|||||||||||||||||||||||
| Total Level 3 liabilities |
$ | 316 | $ | 426 | $ | — | $ | 3 | $ | — | $ | 37 | $ | (4 | ) | $ | — | $ | — | $ | 778 | $ | 431 | |||||||||||||||||||||
|
|
|
|
|
|
|
|
|
|
|
|
|
|
|
|
|
|
|
|
|
|
|
|||||||||||||||||||||||
| (1) | Represents embedded derivatives associated with our GMWB liabilities, excluding the impact of reinsurance. |
| (2) | See note 18 for additional information related to consolidated securitization entities. |
The following table presents the gains and losses included in net (income) from liabilities measured at fair value on a recurring basis and for which we have utilized significant unobservable (Level 3) inputs to determine fair value and the related income statement line item in which these gains and losses were presented for the years ended December 31:
| (Amounts in millions) |
2013 | 2012 | 2011 | |||||||||
| Total realized and unrealized (gains) losses included in net (income): |
||||||||||||
| Net investment income |
$ | — | $ | — | $ | — | ||||||
| Net investment (gains) losses |
(339 | ) | (283 | ) | 426 | |||||||
|
|
|
|
|
|
|
|||||||
| Total |
$ | (339 | ) | $ | (283 | ) | $ | 426 | ||||
|
|
|
|
|
|
|
|||||||
| Total (gains) losses included in net (income) attributable to liabilities still held: |
||||||||||||
| Net investment income |
$ | — | $ | — | $ | — | ||||||
| Net investment (gains) losses |
(337 | ) | (276 | ) | 431 | |||||||
|
|
|
|
|
|
|
|||||||
| Total |
$ | (337 | ) | $ | (276 | ) | $ | 431 | ||||
|
|
|
|
|
|
|
|||||||
314
GENWORTH FINANCIAL, INC.
NOTES TO CONSOLIDATED FINANCIAL STATEMENTS
Years Ended December 31, 2013, 2012 and 2011
Purchases, sales, issuances and settlements represent the activity that occurred during the period that results in a change of the asset or liability but does not represent changes in fair value for the instruments held at the beginning of the period. Such activity primarily consists of purchases, sales and settlements of fixed maturity, equity and trading securities and purchases, issuances and settlements of derivative instruments.
Issuances and settlements presented for policyholder account balances represent the issuances and settlements of embedded derivatives associated with our GMWB liabilities where: issuances are characterized as the change in fair value associated with the product fees recognized that are attributed to the embedded derivative to equal the expected future benefit costs upon issuance and settlements are characterized as the change in fair value upon exercising the embedded derivative instrument, effectively representing a settlement of the embedded derivative instrument. We have shown these changes in fair value separately based on the classification of this activity as effectively issuing and settling the embedded derivative instrument with all remaining changes in the fair value of these embedded derivative instruments being shown separately in the category labeled “included in net (income)” in the tables presented above.
Certain classes of instruments classified as Level 3 are excluded below as a result of not being material or due to limitations in being able to obtain the underlying inputs used by certain third-party sources, such as broker quotes, used as an input in determining fair value. The following table presents a summary of the significant unobservable inputs used for certain fair value measurements that are based on internal models and classified as Level 3 as of December 31, 2013:
| (Amounts in millions) |
Valuation technique |
Fair value | Unobservable input |
Range (weighted-average) | ||||||
| Assets |
||||||||||
| Fixed maturity securities: |
||||||||||
| U.S. corporate |
Internal models | $ | 2,243 | Credit spreads | 56bps-539bps (184bps) | |||||
| Corporate—non-U.S. |
Internal models | 1,556 | Credit spreads | 81bps-323bps (171bps) | ||||||
| Derivative assets: |
||||||||||
| Credit default swaps (1) |
Discounted cash flows | 10 | Credit spreads | 3bps-18bps (10bps) | ||||||
| Equity index options |
Discounted cash flows | 12 | Equity index volatility | 13%-24%(21%) | ||||||
| Other foreign currency contracts |
Discounted cash flows | 3 | Foreign exchange rate volatility | 31% | ||||||
| Liabilities |
||||||||||
| Policyholder account balances: |
||||||||||
| Withdrawal utilization rate | —%-98% | |||||||||
| Lapse rate | —%-15% | |||||||||
| Non-performance risk (credit spreads) | 50bps-90bps (77bps) | |||||||||
| GMWB embedded derivatives (2) |
Stochastic cash flow model | 96 | Equity index volatility | 15%-24% (21%) | ||||||
| Fixed index annuity embedded derivatives |
Option budget method | 143 | Expected future interest credited | 1%-4% (2%) | ||||||
| Derivative liabilities: |
||||||||||
| Other foreign currency contracts |
Discounted cash flows | 1 | Foreign exchange rate volatility |
36% | ||||||
| (1) | Unobservable input valuation based on the current market credit default swap premium. |
| (2) | Represents embedded derivatives associated with our GMWB liabilities, excluding the impact of reinsurance. |
315
GENWORTH FINANCIAL, INC.
NOTES TO CONSOLIDATED FINANCIAL STATEMENTS
Years Ended December 31, 2013, 2012 and 2011
(18) Variable Interest and Securitization Entities
VIEs are generally entities that have either a total equity investment that is insufficient to permit the entity to finance its activities without additional subordinated financial support or whose equity investors lack the characteristics of a controlling financial interest. We evaluate VIEs to determine whether we are the primary beneficiary and are required to consolidate the assets and liabilities of the entity. The determination of the primary beneficiary for a VIE can be complex and requires management judgment regarding the expected results of the entity and who directs the activities of the entity that most significantly impact the economic results of the VIE.
(a) Asset Securitizations
We have used former affiliates and third-party entities to facilitate asset securitizations. Disclosure requirements related to off-balance sheet arrangements encompass a broader array of arrangements than those at risk for consolidation. These arrangements include transactions with term securitization entities, as well as transactions with conduits that are sponsored by third parties.
The following table summarizes the total securitized assets as of December 31:
| (Amounts in millions) |
2013 | 2012 | ||||||
| Receivables secured by: |
||||||||
| Other assets |
$ | 147 | $ | 151 | ||||
|
|
|
|
|
|||||
| Total securitized assets not required to be consolidated |
147 | 151 | ||||||
|
|
|
|
|
|||||
| Total securitized assets required to be consolidated |
314 | 424 | ||||||
|
|
|
|
|
|||||
| Total securitized assets |
$ | 461 | $ | 575 | ||||
|
|
|
|
|
|||||
We previously provided limited recourse for a maximum of $40 million of credit losses related to one of our commercial mortgage loan entities that was required to be consolidated. As a result of a clean up call being exercised on this securitization entity during the fourth quarter of 2013, we effectively no longer have any limited recourse outstanding as of December 31, 2013.
There has been no new asset securitization activity in 2013 or 2012.
(b) Securitization and Variable Interest Entities Required To Be Consolidated
For VIEs related to asset securitization transactions, we consolidate three securitization entities as a result of our involvement in the entities’ design or having certain decision making ability regarding the assets held by the securitization entity. These securitization entities were designed to have significant limitations on the types of assets owned and the types and extent of permitted activities and decision making rights. The three securitization entities that were consolidated are comprised of two securitization entities backed by commercial mortgage loans and one backed by residual interests in certain policy loan securitization entities.
For one of our commercial mortgage loan securitization entities, our primary economic interest represents the excess interest received on the loans compared to the interest paid on the entity’s obligation. During the fourth quarter of 2013, we exercised a clean up call to repurchase the loans and repay the outstanding debt. These loans are now included in commercial mortgage loans and are no longer restricted. For the other commercial
316
GENWORTH FINANCIAL, INC.
NOTES TO CONSOLIDATED FINANCIAL STATEMENTS
Years Ended December 31, 2013, 2012 and 2011
mortgage loan securitization entity, our primary economic interest represents the excess interest of the commercial mortgage loans and the subordinated notes of the securitization entity.
Our primary economic interest in the policy loan securitization entity represents the excess interest received from the residual interest in certain policy loan securitization entities and the floating rate obligation issued by the securitization entity, where our economic interest is not expected to be material in any future years. Upon consolidation, we elected fair value option for the assets and liabilities for the securitization entity.
For VIEs related to certain investments, we were required to consolidate three securitization entities as a result of having certain decision making rights related to instruments held by the entities. Upon consolidation, we elected fair value option for the assets and liabilities for the securitization entity.
The following table shows the assets and liabilities that were recorded for the consolidated securitization entities as of December 31:
| (Amounts in millions) |
2013 | 2012 | ||||||
| Assets |
||||||||
| Investments: |
||||||||
| Restricted commercial mortgage loans |
$ | 233 | $ | 341 | ||||
| Restricted other invested assets: |
||||||||
| Trading securities |
391 | 393 | ||||||
|
|
|
|
|
|||||
| Total restricted other invested assets |
391 | 393 | ||||||
|
|
|
|
|
|||||
| Total investments |
624 | 734 | ||||||
| Cash and cash equivalents |
1 | 1 | ||||||
| Accrued investment income |
1 | 2 | ||||||
|
|
|
|
|
|||||
| Total assets |
$ | 626 | $ | 737 | ||||
|
|
|
|
|
|||||
| Liabilities |
||||||||
| Other liabilities: |
||||||||
| Derivative liabilities |
$ | 48 | $ | 131 | ||||
| Other liabilities |
2 | 2 | ||||||
|
|
|
|
|
|||||
| Total other liabilities |
50 | 133 | ||||||
| Borrowings related to securitization entities |
242 | 336 | ||||||
|
|
|
|
|
|||||
| Total liabilities |
$ | 292 | $ | 469 | ||||
|
|
|
|
|
|||||
The assets and other instruments held by the securitization entities are restricted and can only be used to fulfill the obligations of the securitization entity. Additionally, the obligations of the securitization entities do not have any recourse to the general credit of any other consolidated subsidiaries.
317
GENWORTH FINANCIAL, INC.
NOTES TO CONSOLIDATED FINANCIAL STATEMENTS
Years Ended December 31, 2013, 2012 and 2011
The following table shows the activity presented in our consolidated statement of income related to the consolidated securitization entities for the years ended December 31:
| (Amounts in millions) |
2013 | 2012 | 2011 | |||||||||
| Revenues: |
||||||||||||
| Net investment income: |
||||||||||||
| Restricted commercial mortgage loans |
$ | 23 | $ | 29 | $ | 40 | ||||||
| Restricted other invested assets |
4 | 4 | — | |||||||||
|
|
|
|
|
|
|
|||||||
| Total net investment income |
27 | 33 | 40 | |||||||||
|
|
|
|
|
|
|
|||||||
| Net investment gains (losses): |
||||||||||||
| Trading securities |
(4 | ) | 23 | 12 | ||||||||
| Derivatives |
86 | 72 | (62 | ) | ||||||||
| Borrowings related to securitization entities recorded at fair value |
(13 | ) | (14 | ) | 3 | |||||||
|
|
|
|
|
|
|
|||||||
| Total net investment gains (losses) |
69 | 81 | (47 | ) | ||||||||
|
|
|
|
|
|
|
|||||||
| Other income |
— | 1 | — | |||||||||
|
|
|
|
|
|
|
|||||||
| Total revenues |
96 | 115 | (7 | ) | ||||||||
|
|
|
|
|
|
|
|||||||
| Expenses: |
||||||||||||
| Interest expense |
16 | 21 | 26 | |||||||||
| Acquisition and operating expenses |
— | 1 | 1 | |||||||||
|
|
|
|
|
|
|
|||||||
| Total expenses |
16 | 22 | 27 | |||||||||
|
|
|
|
|
|
|
|||||||
| Income (loss) before income taxes |
80 | 93 | (34 | ) | ||||||||
| Provision (benefit) for income taxes |
27 | 33 | (12 | ) | ||||||||
|
|
|
|
|
|
|
|||||||
| Net income (loss) |
$ | 53 | $ | 60 | $ | (22 | ) | |||||
|
|
|
|
|
|
|
|||||||
(d) Borrowings Related To Consolidated Securitization Entities
Borrowings related to securitization entities were as follows as of December 31:
| 2013 | 2012 | |||||||||||||||
| (Amounts in millions) |
Principal amount |
Carrying value |
Principal amount |
Carrying value |
||||||||||||
| GFCM LLC, due 2035, 5.2541% |
$ | 54 | $ | 54 | $ | 97 | $ | 97 | ||||||||
| GFCM LLC, due 2035, 5.7426% |
113 | 113 | 113 | 113 | ||||||||||||
| Genworth Special Purpose Two, LLC, due 2023, 6.0175% |
— | — | 65 | 65 | ||||||||||||
| Marvel Finance 2007-4 LLC, due 2017 (1), (3) |
12 | 12 | 12 | 7 | ||||||||||||
| Genworth Special Purpose Five, LLC, due 2040 (1), (3) |
NA | (2) | 63 | NA | (2) | 54 | ||||||||||
|
|
|
|
|
|
|
|
|
|||||||||
| Total |
$ | 179 | $ | 242 | $ | 287 | $ | 336 | ||||||||
|
|
|
|
|
|
|
|
|
|||||||||
| (1) | Accrual of interest based on three-month LIBOR that resets every three months plus a fixed margin. |
| (2) | Principal amount not applicable. Notional balance was $115 million and $117 million as of December 31, 2013 and 2012, respectively. |
| (3) | Carrying value represents fair value as a result of electing fair value option for these liabilities. |
318
GENWORTH FINANCIAL, INC.
NOTES TO CONSOLIDATED FINANCIAL STATEMENTS
Years Ended December 31, 2013, 2012 and 2011
These borrowings are required to be paid down as principal is collected on the restricted investments held by the securitization entities and accordingly the repayment of these borrowings follows the maturity or prepayment, as permitted, of the restricted investments.
(19) Insurance Subsidiary Financial Information and Regulatory Matters
Our insurance company subsidiaries are restricted by state and foreign laws and regulations as to the amount of dividends they may pay to their parent without regulatory approval in any year, the purpose of which is to protect affected insurance policyholders or contractholders, not stockholders. Any dividends in excess of limits are deemed “extraordinary” and require approval. Based on estimated statutory results as of December 31, 2013, in accordance with applicable dividend restrictions, our subsidiaries could pay dividends of approximately $1.0 billion to us in 2014 without obtaining regulatory approval, and the remaining net assets are considered restricted. While the $1.0 billion is unrestricted, we do not expect our insurance subsidiaries to pay dividends to us in 2014 at this level as they retain capital for growth and to meet capital requirements and desired thresholds. As of December 31, 2013, Genworth Financial’s and Genworth Holdings’ subsidiaries had restricted net assets of $13.4 billion and $13.9 billion, respectively. There are no regulatory restrictions on the ability of Genworth Financial to pay dividends. Our Board of Directors has suspended the payment of dividends on our common stock indefinitely. The declaration and payment of future dividends to holders of our common stock will be at the discretion of our Board of Directors and will be dependent on many factors including the receipt of dividends from our operating subsidiaries, our financial condition and operating results, the capital requirements of our subsidiaries, legal requirements, regulatory constraints, our credit and financial strength ratings and such other factors as the Board of Directors deems relevant.
Our domestic insurance subsidiaries paid dividends of $418 million (none of which were deemed “extraordinary”), $374 million ($175 million of which were deemed “extraordinary”), and $12 million (none of which were deemed “extraordinary”) during 2013, 2012 and 2011, respectively. Our international insurance subsidiaries paid dividends of $317 million, $240 million and $414 million during 2013, 2012 and 2011, respectively.
In addition to the guarantees discussed in notes 18 and 22, we have provided guarantees to third parties for the performance of certain obligations of our subsidiaries. We estimate that our potential obligations under such guarantees, other than the Rivermont I guarantee, were $30 million and $65 million as of December 31, 2013 and 2012, respectively. We provide a limited guarantee to Rivermont I, an indirect subsidiary, which is accounted for as a derivative carried at fair value and is eliminated in consolidation. As of December 31, 2013, the fair value of this derivative was zero. As of December 31, 2012, the fair value of this derivative was $1 million. We also provide an unlimited guarantee for the benefit of policyholders for the payment of valid claims by our mortgage insurance subsidiary located in the United Kingdom. However, based on risk in-force as of December 31, 2013, we believe our mortgage insurance subsidiary has sufficient reserves and capital to cover its policyholder obligations.
Our U.S. domiciled insurance subsidiaries file financial statements with state insurance regulatory authorities and the NAIC that are prepared on an accounting basis prescribed or permitted by such authorities. Statutory accounting practices differ from U.S. GAAP in several respects, causing differences in reported net income and stockholders’ equity.
Permitted statutory accounting practices encompass all accounting practices not so prescribed but that have been specifically allowed by state insurance authorities. Our U.S. domiciled insurance subsidiaries have no material permitted accounting practices, except for River Lake Insurance Company VI (“River Lake VI”), River Lake Insurance Company VII (“River Lake VII”), River Lake Insurance Company VIII (“River Lake VIII”),
319
GENWORTH FINANCIAL, INC.
NOTES TO CONSOLIDATED FINANCIAL STATEMENTS
Years Ended December 31, 2013, 2012 and 2011
River Lake Insurance Company IX ((“River Lake IX”), River Lake Insurance Company X ((“River Lake X”) together with River Lake VI, River Lake VII, River Lake VIII and River Lake IX, the “SPFCs”) and Genworth Life Insurance Company of New York (“GLICNY”). The permitted practices of the SPFCs were an essential element of their design and were expressly included in their plans of operation and in the licensing orders issued by their domiciliary state regulators. Accordingly, we believe that the permitted practices will remain in effect for so long as we maintain the SPFCs. The permitted practices were as follows:
| • | River Lake IX and River Lake X were granted a permitted accounting practice from the state of Vermont to carry its excess of loss reinsurance agreement with Brookfield Life and Annuity Insurance Company, and Hannover Life Reassurance Company Of America, respectively, as an admitted asset. |
| • | River Lake VII and River Lake VIII were granted a permitted accounting practice from the state of Vermont to carry their reserves on a basis similar to U.S. GAAP. |
| • | River Lake VI was granted a permitted accounting practice from the state of Delaware to record a portion of the undrawn amount of its existing letter of credit and any additional letters of credit as gross paid-in and contributed surplus, thereby including such amounts in its statutory surplus. The amount of the letters of credit recorded as gross paid-in and contributed surplus is equal to the excess of statutory reserves less the economic reserves. Effective November 1, 2013, this permitted accounting practice was discontinued and River Lake VI was granted a permitted accounting practice from the State of Delaware to carry its excess of loss reinsurance agreement with The Canada Life Assurance Company as an admitted asset. |
| • | GLICNY received a permitted practice from New York to exempt certain of its investments from a NAIC structured security valuation and ratings process. |
The impact of these permitted practices on our combined U.S. domiciled life insurance subsidiaries’ statutory capital and surplus was $450 million and $598 million as of December 31, 2013 and 2012, respectively. If they had not used a permitted practice, no regulatory event would have been triggered.
The tables below include the combined statutory net loss and statutory capital and surplus for our U.S. domiciled insurance subsidiaries:
| Years ended December 31, |
||||||||||||
| (Amounts in millions) |
2013 | 2012 | 2011 | |||||||||
| Combined statutory net income (loss): |
||||||||||||
| Life insurance subsidiaries, excluding captive life reinsurance subsidiaries |
$ | 359 | $ | 378 | $ | (69 | ) | |||||
| Mortgage insurance subsidiaries |
85 | (137 | ) | (684 | ) | |||||||
|
|
|
|
|
|
|
|||||||
| Combined statutory net income (loss), excluding captive reinsurance subsidiaries |
444 | 241 | (753 | ) | ||||||||
| Captive life insurance subsidiaries |
(102 | ) | (478 | ) | (146 | ) | ||||||
|
|
|
|
|
|
|
|||||||
| Combined statutory net income (loss) |
$ | 342 | $ | (237 | ) | $ | (899 | ) | ||||
|
|
|
|
|
|
|
|||||||
| As of December 31, |
||||||||
| (Amounts in millions) |
2013 | 2012 | ||||||
| Combined statutory capital and surplus: |
||||||||
| Life insurance subsidiaries, excluding captive life reinsurance subsidiaries |
$ | 2,777 | $ | 2,550 | ||||
| Mortgage insurance subsidiaries |
1,226 | 735 | ||||||
|
|
|
|
|
|||||
| Combined statutory capital and surplus |
$ | 4,003 | $ | 3,285 | ||||
|
|
|
|
|
|||||
320
GENWORTH FINANCIAL, INC.
NOTES TO CONSOLIDATED FINANCIAL STATEMENTS
Years Ended December 31, 2013, 2012 and 2011
The statutory net income (loss) from our captive life reinsurance subsidiaries relates to the reinsurance of term and universal life insurance statutory reserves assumed from our U.S. domiciled life insurance companies. These reserves are, in turn, funded through the issuance of surplus notes (non-recourse funding obligations) to third parties or secured by a third-party letter of credit or excess of loss reinsurance treaties with third parties. Accordingly, the life insurance subsidiaries’ combined statutory net income (loss) and distributable income are not affected by the statutory net income (loss) of the captives, except to the extent dividends are received from the captives. The combined statutory capital and surplus of our life insurance subsidiaries does not include the capital and surplus of our captive life reinsurance subsidiaries of $1,101 million and $1,204 million as of December 31, 2013 and 2012, respectively. Capital and surplus of our captive life reinsurance subsidiaries, excluding River Lake VI, River Lake VII, River Lake VIII and River Lake IX, include surplus notes (non-recourse funding obligations) as further described in note 13.
The NAIC has adopted RBC requirements to evaluate the adequacy of statutory capital and surplus in relation to risks associated with: (i) asset risk; (ii) insurance risk; (iii) interest rate and equity market risk; and (iv) business risk. The RBC formula is designated as an early warning tool for the states to identify possible undercapitalized companies for the purpose of initiating regulatory action. In the course of operations, we periodically monitor the RBC level of each of our life insurance subsidiaries. As of December 31, 2013 and 2012, each of our life insurance subsidiaries exceeded the minimum required RBC levels. The consolidated RBC ratio of our U.S. domiciled life insurance subsidiaries was approximately 485% and 430% of the company action level as of December 31, 2013 and 2012, respectively.
The NAIC adopted revised statutory reserving requirements for new and in-force secondary guarantee universal life business subject to Actuarial Guideline 38 (more commonly known as “AG 38”) provisions, effective December 31, 2012. These requirements reflected an agreement reached and developed by a NAIC Joint Working Group which included regulators from several states, including New York. The financial impact related to the revised statutory reserving requirements on our in-force reserves subject to the new guidance was not significant as of December 31, 2012. On September 11, 2013, the New York Department of Financial Services (the “NYDFS”) announced that it no longer supported the agreement reached by the NAIC Working Group and that it would require New York licensed companies to use an alternative interpretation of AG 38 for universal life insurance products with secondary guarantees. We have been in discussions with the NYDFS about its alternative interpretation and recorded $80 million of additional statutory reserves as of December 31, 2013. We continue to work with the NYDFS to determine potential future impacts, if any. The NYDFS has not finalized a permanent update to the regulation.
For regulatory purposes, our U.S. mortgage insurance subsidiaries are required to maintain a statutory contingency reserve. Annual additions to the statutory contingency reserve must equal the greater of: (i) 50% of earned premiums or (ii) the required level of policyholders position, as defined by state insurance laws. These contingency reserves generally are held until the earlier of: (i) the time that loss ratios exceed 35% or (ii) 10 years. The statutory contingency reserves for our U.S. mortgage insurance subsidiaries were approximately $59 million and $6 million, respectively, as of December 31, 2013 and 2012 and, are included in the table above containing combined statutory capital and surplus balances.
Mortgage insurers are not subject to the NAIC’s RBC requirements but certain states and other regulators impose another form of capital requirement on mortgage insurers requiring maintenance of a risk-to-capital ratio not to exceed 25:1. As of December 31, 2013, the risk-to-capital ratio of GEMICO, our primary U.S. mortgage insurance subsidiary, was 19.3:1, which was below the maximum risk-to-capital ratio of 25:1 established under North Carolina law and enforced by the North Carolina Department of Insurance (“NCDOI”), which is
321
GENWORTH FINANCIAL, INC.
NOTES TO CONSOLIDATED FINANCIAL STATEMENTS
Years Ended December 31, 2013, 2012 and 2011
GEMICO’s domestic insurance regulator, compared with a risk- to-capital ratio of 36.9:1 as of December 31, 2012. Fifteen other states maintain similar risk-to-capital requirements. GEMICO was not required by the NCDOI to refile its prior statutory annual statements as a result of the correction of the premium refund accrual error; therefore, the risk-to-capital ratio has accordingly not been restated, and was presented as filed. Had we been required to refile our statutory annual statements, GEMICO’s risk-to-capital ratio would have been approximately five points higher as of December 31, 2012.
We provided additional capital support and other benefits to our U.S. mortgage insurance business through our previously announced capital plan for the U.S. mortgage insurance business (the “Capital Plan”) that was completed on April 1, 2013. The Capital Plan consisted of the following actions: (i) transferring ownership of the European mortgage insurance subsidiaries to GEMICO, which was effective on January 31, 2013; (ii) enabling the future option, under certain adverse conditions, should they occur, to implement a “NewCo” type structure, for the continued writing of new business in all 50 states; and (iii) implementing an internal legal entity reorganization which created a new holding company structure that removed the U.S. mortgage insurance subsidiaries from the companies covered by the indenture governing Genworth Holdings’ senior notes. On April 1, 2013 (immediately prior to the reorganization), as part of the Capital Plan, Genworth Holdings also contributed $100 million to GEMICO. In addition, in December 2013, GEMICO also received a capital contribution of $100 million from the proceeds of Genworth Holdings’ $400 million senior note issuance in anticipation of them being used to satisfy all or part of the expected increased capital requirements of the revised GSE asset-and capital-related standards.
GEMICO initially returned to compliance with maximum state regulatory risk-to-capital ratios of 25:1 as of April 30, 2013, and because it remains below the maximum risk-to-capital requirements, GEMICO does not currently face the associated limitations on its ability to write new business. As of January 20, 2014, all new business is being written out of GEMICO. Previously, beginning in 2010 through April 2013, GEMICO had exceeded its regulatory risk-to-capital levels and operated pursuant to regulatory forbearance (typically in the form of a waiver or the regulatory equivalent thereof) or we instead operated through affiliated insurers that met applicable state regulatory requirements and where we had obtained GSE approval of the affiliates as eligible insurers (subject to specified conditions). In Florida, we had been using an affiliated insurer because the state suspended GEMICO’s authority to write business there due to non-compliance with applicable risk-to-capital standards, but during the fourth quarter of 2013, the suspension was lifted and we obtained reauthorization of GEMICO’s authority to write business in Florida. Of the waivers and required approvals previously relied upon by GEMICO, four state waivers (one of which is North Carolina, which permits us to write in other states with no explicit risk-to-capital requirements so long as North Carolina, as our domiciliary regulator, permits us to write) do not expire until July 31, 2014 (although the company plans to allow those waiver to expire pursuant to their terms in 2014); two state waivers expired by their terms on December 31, 2013; and each GSE’s approval in connection with the use of an alternative affiliated insurer (and the limitations imposed on the business contained therein) expired by their respective terms on December 31, 2013.
While it is our expectation that our U.S. mortgage insurance subsidiaries will continue to meet their regulatory capital requirements should GEMICO in the future exceed required risk-to-capital levels, we would pursue required regulatory and GSE forbearance and approvals or pursue approval for the utilization of alternative insurance vehicles. However, there can be no assurance if, and on what terms, such forbearance and approvals may be obtained.
On January 31, 2013, our European mortgage insurance subsidiaries received a $21 million cash capital contribution. We then subsequently contributed the shares of our European mortgage insurance subsidiaries with
322
GENWORTH FINANCIAL, INC.
NOTES TO CONSOLIDATED FINANCIAL STATEMENTS
Years Ended December 31, 2013, 2012 and 2011
an estimated value of $230 million to our U.S. mortgage insurance subsidiaries to increase the statutory capital in those companies as part of the Capital Plan for our U.S. mortgage insurance subsidiaries.
Our international insurance subsidiaries also prepare financial statements in accordance with local regulatory requirements. As of December 31, 2013 and 2012, combined local statutory capital and surplus for our international insurance subsidiaries was $8,248 million and $8,076 million, respectively. Combined local statutory net income for our international insurance subsidiaries was $605 million, $1,190 million and $1,194 million for the years ended December 31, 2013, 2012 and 2011, respectively. The regulatory authorities in these international jurisdictions generally establish supervisory solvency requirements. Our international insurance subsidiaries had combined surplus levels that exceeded local solvency requirements by $3,435 million and $3,755 million as of December 31, 2013 and 2012, respectively.
Our international insurance subsidiaries do not have any material accounting practices that differ from local regulatory requirements other than one of our insurance subsidiaries domiciled in Bermuda, which was granted approval from the Bermuda Monetary Authority to record a parental guarantee as statutory capital related to an internal reinsurance agreement. The amount recorded as statutory capital is equal to the excess of NAIC statutory reserves less the economic reserves up to the amount of the guarantee resulting in an increase in statutory capital of $359 million and $338 million as of December 31, 2013 and 2012, respectively.
Certain of our insurance subsidiaries have securities on deposit with various state or foreign government insurance departments in order to comply with relevant insurance regulations. See note 4(d) for additional information related to these deposits. Additionally, under the terms of certain reinsurance agreements that our life insurance subsidiaries have with external parties, we pledged assets in either separate portfolios or in trust for the benefit of external reinsurers. These assets support the reserves ceded to those external reinsurers. See note 9 for additional information related to these pledged assets under reinsurance agreements. Certain of our U.S. life insurance subsidiaries are also members of regional FHLBs and the FHLBs have been granted a lien on certain of our invested assets to collateralize our obligations. See note 10 for additional information related to these pledged assets with the FHLBs.
Our insurance subsidiary domiciled in Canada had an agreement with the Canadian government (the “Government Guarantee Agreement”) under which it guarantees the benefits payable under a mortgage insurance policy, less 10% of the original principal amount of an insured loan, in the event that we fail to make claim payments with respect to that loan because of insolvency. On January 1, 2013, the Protection of Residential Mortgage or Hypothecary Insurance Act (Canada) (“PRMHIA”) came into force. Under PRMHIA, the Canadian government will continue to provide the same level of guarantee that the government previously provided under the Government Guarantee Agreement and all mortgages that were previously insured and covered by the Government Guarantee Agreement will continue to be covered by PRMHIA. As of January 1, 2013, the Government Guarantee Agreement and all obligations under it, including the requirement for the Canadian government guarantee fund, were terminated. The amount held in the Canadian government guarantee fund of $985 million as of December 31, 2012 reverted back to us on January 1, 2013. We previously paid the Canadian government a risk premium for this guarantee and made other payments to a reserve fund in respect of the government’s obligation. As a result of the elimination of the guarantee fund, we are required to hold higher regulatory capital under PRMHIA and the Insurance Companies Act of Canada.
323
GENWORTH FINANCIAL, INC.
NOTES TO CONSOLIDATED FINANCIAL STATEMENTS
Years Ended December 31, 2013, 2012 and 2011
(a) Operating Segment Information
We operate through three divisions: U.S. Life Insurance, Global Mortgage Insurance and Corporate and Other. Under these divisions, there are five operating business segments. The U.S. Life Insurance Division includes the U.S. Life Insurance segment. The Global Mortgage Insurance Division includes the International Mortgage Insurance and U.S. Mortgage Insurance segments. The Corporate and Other Division includes the International Protection and Runoff segments and Corporate and Other activities. Our operating business segments are as follows: (1) U.S. Life Insurance, which includes our life insurance, long-term care insurance and fixed annuities businesses; (2) International Mortgage Insurance, which includes mortgage insurance-related products and services; (3) U.S. Mortgage Insurance, which includes mortgage insurance-related products and services; (4) International Protection Insurance, which includes our lifestyle protection insurance business; and (5) Runoff, which includes the results of non-strategic products which are no longer actively sold. Our non-strategic products primarily include our variable annuity, variable life insurance, institutional, corporate-owned life insurance and other accident and health insurance products. Institutional products consist of: funding agreements, FABNs and GICs.
We also have Corporate and Other activities which include debt financing expenses that are incurred at the Genworth Holdings level, unallocated corporate income and expenses, eliminations of inter-segment transactions and the results of other businesses that are managed outside of our operating segments, including discontinued operations.
We use the same accounting policies and procedures to measure segment income (loss) and assets as our consolidated net income (loss) and assets. Our chief operating decision maker evaluates segment performance and allocates resources on the basis of “net operating income (loss).” We define net operating income (loss) as income (loss) from continuing operations excluding the after-tax effects of income attributable to noncontrolling interests, net investment gains (losses), goodwill impairments, gains (losses) on the sale of businesses, gains (losses) on the early extinguishment of debt, gains (losses) on insurance block transactions and infrequent or unusual non-operating items. Gains (losses) on insurance block transactions are defined as gains (losses) on the early extinguishment of non-recourse funding obligations, early termination fees for other financing restructuring and/or resulting gains (losses) on reinsurance restructuring for certain blocks of business. We exclude net investment gains (losses) and infrequent or unusual non-operating items because we do not consider them to be related to the operating performance of our segments and Corporate and Other activities. A component of our net investment gains (losses) is the result of impairments, the size and timing of which can vary significantly depending on market credit cycles. In addition, the size and timing of other investment gains (losses) can be subject to our discretion and are influenced by market opportunities, as well as asset-liability matching considerations. Goodwill impairments and gains (losses) on the sale of businesses, the early extinguishment of debt and insurance block transactions are also excluded from net operating income (loss) because in our opinion, they are not indicative of overall operating trends. Other non-operating items are also excluded from net operating income (loss) if, in our opinion, they are not indicative of overall operating trends.
In the fourth quarter of 2013, we revised our definition of net operating income (loss) to exclude gains (losses) on the early extinguishment of debt and gains (losses) on insurance block transactions to better reflect the basis on which the performance of our business is internally assessed and to reflect management’s opinion that they are not indicative of overall operating trends. All prior periods have been re-presented to reflect this new definition.
324
GENWORTH FINANCIAL, INC.
NOTES TO CONSOLIDATED FINANCIAL STATEMENTS
Years Ended December 31, 2013, 2012 and 2011
Based on the revised definition of net operating income (loss), the following transactions were excluded from net operating income (loss) for the periods presented. In the third quarter of 2013, we paid an after-tax make-whole expense of approximately $20 million related to the early redemption of Genworth Holdings’ 2015 Notes. In the fourth quarter of 2012, we repurchased principal of approximately $100 million of Genworth Holdings’ notes that mature in June 2014 for an after-tax loss of $4 million. In the fourth quarter of 2012, we also repurchased $20 million of non-recourse funding obligations resulting in an after-tax gain of approximately $3 million. During 2011, we acquired $175 million aggregate principal amount of our non-recourse funding obligations, plus accrued interest, for an after-tax gain of $31 million. In the third quarter of 2012, we completed a life block transaction resulting in an after-tax loss of $6 million. In January 2012, we also completed a life block transaction resulting in an after-tax loss of approximately $41 million.
We recorded after-tax goodwill impairments of $86 million related to our lifestyle protection insurance business in the third quarter of 2012 and $19 million related to our reverse mortgage business recorded in the fourth quarter of 2011. There was a $36 million gain related to the sale of our Medicare supplement insurance business recorded in the fourth quarter of 2011.
There were no infrequent or unusual items excluded from net operating income (loss) during the periods presented other than a $13 million after-tax expense recorded in the second quarter of 2013 related to restructuring costs. In June 2013, we announced an expense reduction plan as we continue to work on improving the operating performance of our businesses resulting in a pre-tax non-operating charge of $20 million reflecting severance, outplacement and other associated costs. This plan eliminated approximately 400 positions, including 150 open positions that will not be filled, and has, and will, reduce related information technology and program spend.
While some of these items may be significant components of net income (loss) available to Genworth Financial, Inc.’s common stockholders in accordance with U.S. GAAP, we believe that net operating income (loss), and measures that are derived from or incorporate net operating income (loss), are appropriate measures that are useful to investors because they identify the income (loss) attributable to the ongoing operations of the business. Management also uses net operating income (loss) as a basis for determining awards and compensation for senior management and to evaluate performance on a basis comparable to that used by analysts. However, the items excluded from net operating income (loss) have occurred in the past and could, and in some cases will, recur in the future. Net operating income (loss) is not a substitute for net income (loss) available to Genworth Financial, Inc.’s common stockholders determined in accordance with U.S. GAAP. In addition, our definition of net operating income (loss) may differ from the definitions used by other companies.
325
GENWORTH FINANCIAL, INC.
NOTES TO CONSOLIDATED FINANCIAL STATEMENTS
Years Ended December 31, 2013, 2012 and 2011
The following is a summary of our segments and Corporate and Other activities as of or for the years ended December 31:
| 2013 |
U.S. Life Insurance |
International Mortgage Insurance |
U.S. Mortgage Insurance |
International Protection |
Runoff | Corporate and Other |
Total | |||||||||||||||||||||
| (Amounts in millions) |
||||||||||||||||||||||||||||
| Premiums |
$ | 2,957 | $ | 996 | $ | 554 | $ | 636 | $ | 5 | $ | — | $ | 5,148 | ||||||||||||||
| Net investment income |
2,621 | 333 | 60 | 119 | 139 | (1 | ) | 3,271 | ||||||||||||||||||||
| Net investment gains (losses) |
(3 | ) | 32 | — | 27 | (58 | ) | (35 | ) | (37 | ) | |||||||||||||||||
| Insurance and investment product fees and other |
755 | — | 2 | 4 | 216 | 44 | 1,021 | |||||||||||||||||||||
|
|
|
|
|
|
|
|
|
|
|
|
|
|
|
|||||||||||||||
| Total revenues |
6,330 | 1,361 | 616 | 786 | 302 | 8 | 9,403 | |||||||||||||||||||||
|
|
|
|
|
|
|
|
|
|
|
|
|
|
|
|||||||||||||||
| Benefits and other changes in policy reserves |
3,975 | 317 | 412 | 159 | 32 | — | 4,895 | |||||||||||||||||||||
| Interest credited |
619 | — | — | — | 119 | — | 738 | |||||||||||||||||||||
| Acquisition and operating expenses, net of deferrals |
658 | 241 | 144 | 433 | 81 | 102 | 1,659 | |||||||||||||||||||||
| Amortization of deferred acquisition costs and intangibles |
384 | 60 | 6 | 106 | 6 | 7 | 569 | |||||||||||||||||||||
| Interest expense |
97 | 33 | — | 42 | 2 | 318 | 492 | |||||||||||||||||||||
|
|
|
|
|
|
|
|
|
|
|
|
|
|
|
|||||||||||||||
| Total benefits and expenses |
5,733 | 651 | 562 | 740 | 240 | 427 | 8,353 | |||||||||||||||||||||
|
|
|
|
|
|
|
|
|
|
|
|
|
|
|
|||||||||||||||
| Income (loss) from continuing operations before income taxes |
597 | 710 | 54 | 46 | 62 | (419 | ) | 1,050 | ||||||||||||||||||||
| Provision (benefit) for income taxes |
213 | 184 | 17 | 7 | 13 | (110 | ) | 324 | ||||||||||||||||||||
|
|
|
|
|
|
|
|
|
|
|
|
|
|
|
|||||||||||||||
| Income (loss) from continuing operations |
384 | 526 | 37 | 39 | 49 | (309 | ) | 726 | ||||||||||||||||||||
| Loss from discontinued operations, net of taxes |
— | — | — | — | — | (12 | ) | (12 | ) | |||||||||||||||||||
|
|
|
|
|
|
|
|
|
|
|
|
|
|
|
|||||||||||||||
| Net income (loss) |
384 | 526 | 37 | 39 | 49 | (321 | ) | 714 | ||||||||||||||||||||
| Less: net income attributable to noncontrolling interests |
— | 154 | — | — | — | — | 154 | |||||||||||||||||||||
|
|
|
|
|
|
|
|
|
|
|
|
|
|
|
|||||||||||||||
| Net income (loss) available to Genworth Financial, Inc.’s common stockholders |
$ | 384 | $ | 372 | $ | 37 | $ | 39 | $ | 49 | $ | (321 | ) | $ | 560 | |||||||||||||
|
|
|
|
|
|
|
|
|
|
|
|
|
|
|
|||||||||||||||
| Total assets |
$ | 77,261 | $ | 9,194 | $ | 2,361 | $ | 2,061 | $ | 14,062 | $ | 3,106 | $ | 108,045 | ||||||||||||||
|
|
|
|
|
|
|
|
|
|
|
|
|
|
|
|||||||||||||||
326
GENWORTH FINANCIAL, INC.
NOTES TO CONSOLIDATED FINANCIAL STATEMENTS
Years Ended December 31, 2013, 2012 and 2011
| 2012 |
U.S. Life Insurance |
International Mortgage Insurance |
U.S. Mortgage Insurance |
International Protection |
Runoff | Corporate and Other |
Total | |||||||||||||||||||||
| (Amounts in millions) |
||||||||||||||||||||||||||||
| Premiums |
$ | 2,789 | $ | 1,016 | $ | 549 | $ | 682 | $ | 5 | $ | — | $ | 5,041 | ||||||||||||||
| Net investment income |
2,594 | 375 | 68 | 131 | 145 | 30 | 3,343 | |||||||||||||||||||||
| Net investment gains (losses) |
(8 | ) | 16 | 36 | 6 | 24 | (47 | ) | 27 | |||||||||||||||||||
| Insurance and investment product fees and other |
875 | 1 | 23 | 3 | 207 | 120 | 1,229 | |||||||||||||||||||||
|
|
|
|
|
|
|
|
|
|
|
|
|
|
|
|||||||||||||||
| Total revenues |
6,250 | 1,408 | 676 | 822 | 381 | 103 | 9,640 | |||||||||||||||||||||
|
|
|
|
|
|
|
|
|
|
|
|
|
|
|
|||||||||||||||
| Benefits and other changes in policy reserves |
3,950 | 516 | 725 | 150 | 37 | — | 5,378 | |||||||||||||||||||||
| Interest credited |
643 | — | — | — | 132 | — | 775 | |||||||||||||||||||||
| Acquisition and operating expenses, net of deferrals |
677 | 55 | 143 | 483 | 79 | 157 | 1,594 | |||||||||||||||||||||
| Amortization of deferred acquisition costs and intangibles |
477 | 64 | 5 | 113 | 51 | 12 | 722 | |||||||||||||||||||||
| Goodwill impairment |
— | — | — | 89 | — | — | 89 | |||||||||||||||||||||
| Interest expense |
86 | 36 | — | 45 | 1 | 308 | 476 | |||||||||||||||||||||
|
|
|
|
|
|
|
|
|
|
|
|
|
|
|
|||||||||||||||
| Total benefits and expenses |
5,833 | 671 | 873 | 880 | 300 | 477 | 9,034 | |||||||||||||||||||||
|
|
|
|
|
|
|
|
|
|
|
|
|
|
|
|||||||||||||||
| Income (loss) from continuing operations before income taxes |
417 | 737 | (197 | ) | (58 | ) | 81 | (374 | ) | 606 | ||||||||||||||||||
| Provision (benefit) for income taxes |
143 | 188 | (83 | ) | 1 | 23 | (134 | ) | 138 | |||||||||||||||||||
|
|
|
|
|
|
|
|
|
|
|
|
|
|
|
|||||||||||||||
| Income (loss) from continuing operations |
274 | 549 | (114 | ) | (59 | ) | 58 | (240 | ) | 468 | ||||||||||||||||||
| Income from discontinued operations, net of taxes |
— | — | — | — | — | 57 | 57 | |||||||||||||||||||||
|
|
|
|
|
|
|
|
|
|
|
|
|
|
|
|||||||||||||||
| Net income (loss) |
274 | 549 | (114 | ) | (59 | ) | 58 | (183 | ) | 525 | ||||||||||||||||||
| Less: net income attributable to noncontrolling interests |
— | 200 | — | — | — | — | 200 | |||||||||||||||||||||
|
|
|
|
|
|
|
|
|
|
|
|
|
|
|
|||||||||||||||
| Net income (loss) available to Genworth Financial, Inc.’s common stockholders |
$ | 274 | $ | 349 | $ | (114 | ) | $ | (59 | ) | $ | 58 | $ | (183 | ) | $ | 325 | |||||||||||
|
|
|
|
|
|
|
|
|
|
|
|
|
|
|
|||||||||||||||
| Segment assets |
$ | 79,214 | $ | 10,063 | $ | 2,357 | $ | 2,145 | $ | 15,308 | $ | 3,786 | $ | 112,873 | ||||||||||||||
| Assets associated with discontinued operations |
— | — | — | — | — | 439 | 439 | |||||||||||||||||||||
|
|
|
|
|
|
|
|
|
|
|
|
|
|
|
|||||||||||||||
| Total assets |
$ | 79,214 | $ | 10,063 | $ | 2,357 | $ | 2,145 | $ | 15,308 | $ | 4,225 | $ | 113,312 | ||||||||||||||
|
|
|
|
|
|
|
|
|
|
|
|
|
|
|
|||||||||||||||
327
GENWORTH FINANCIAL, INC.
NOTES TO CONSOLIDATED FINANCIAL STATEMENTS
Years Ended December 31, 2013, 2012 and 2011
| 2011 |
U.S. Life Insurance |
International Mortgage Insurance |
U.S. Mortgage Insurance |
International Protection |
Runoff | Corporate and Other |
Total | |||||||||||||||||||||
| (Amounts in millions) |
||||||||||||||||||||||||||||
| Premiums |
$ | 2,979 | $ | 1,063 | $ | 547 | $ | 839 | $ | 260 | $ | — | $ | 5,688 | ||||||||||||||
| Net investment income |
2,538 | 393 | 104 | 173 | 140 | 32 | 3,380 | |||||||||||||||||||||
| Net investment gains (losses) |
(73 | ) | 42 | 46 | (1 | ) | (174 | ) | (35 | ) | (195 | ) | ||||||||||||||||
| Insurance and investment product fees and other |
686 | 9 | 5 | 11 | 299 | 40 | 1,050 | |||||||||||||||||||||
|
|
|
|
|
|
|
|
|
|
|
|
|
|
|
|||||||||||||||
| Total revenues |
6,130 | 1,507 | 702 | 1,022 | 525 | 37 | 9,923 | |||||||||||||||||||||
|
|
|
|
|
|
|
|
|
|
|
|
|
|
|
|||||||||||||||
| Benefits and other changes in policy reserves |
3,789 | 458 | 1,325 | 135 | 234 | — | 5,941 | |||||||||||||||||||||
| Interest credited |
659 | — | — | — | 135 | — | 794 | |||||||||||||||||||||
| Acquisition and operating expenses, net of deferrals |
736 | 248 | 156 | 590 | 142 | 58 | 1,930 | |||||||||||||||||||||
| Amortization of deferred acquisition costs and intangibles |
297 | 66 | 5 | 143 | 70 | 12 | 593 | |||||||||||||||||||||
| Goodwill impairment |
— | — | — | — | — | 29 | 29 | |||||||||||||||||||||
| Interest expense |
104 | 31 | — | 38 | 2 | 331 | 506 | |||||||||||||||||||||
|
|
|
|
|
|
|
|
|
|
|
|
|
|
|
|||||||||||||||
| Total benefits and expenses |
5,585 | 803 | 1,486 | 906 | 583 | 430 | 9,793 | |||||||||||||||||||||
|
|
|
|
|
|
|
|
|
|
|
|
|
|
|
|||||||||||||||
| Income (loss) from continuing operations before income taxes |
545 | 704 | (784 | ) | 116 | (58 | ) | (393 | ) | 130 | ||||||||||||||||||
| Provision (benefit) for income taxes |
189 | 212 | (290 | ) | 26 | (21 | ) | (127 | ) | (11 | ) | |||||||||||||||||
|
|
|
|
|
|
|
|
|
|
|
|
|
|
|
|||||||||||||||
| Income (loss) from continuing operations |
356 | 492 | (494 | ) | 90 | (37 | ) | (266 | ) | 141 | ||||||||||||||||||
| Income from discontinued operations, net of taxes |
— | — | — | — | — | 36 | 36 | |||||||||||||||||||||
|
|
|
|
|
|
|
|
|
|
|
|
|
|
|
|||||||||||||||
| Net income (loss) |
356 | 492 | (494 | ) | 90 | (37 | ) | (230 | ) | 177 | ||||||||||||||||||
| Less: net income attributable to noncontrolling interests |
— | 139 | — | — | — | — | 139 | |||||||||||||||||||||
|
|
|
|
|
|
|
|
|
|
|
|
|
|
|
|||||||||||||||
| Net income (loss) available to Genworth Financial, Inc.’s common stockholders |
$ | 356 | $ | 353 | $ | (494 | ) | $ | 90 | $ | (37 | ) | $ | (230 | ) | $ | 38 | |||||||||||
|
|
|
|
|
|
|
|
|
|
|
|
|
|
|
|||||||||||||||
328
GENWORTH FINANCIAL, INC.
NOTES TO CONSOLIDATED FINANCIAL STATEMENTS
Years Ended December 31, 2013, 2012 and 2011
(b) Revenues of Major Product Groups
The following is a summary of revenues of major product groups for our segments and Corporate and Other activities for the years ended December 31:
| (Amounts in millions) |
2013 | 2012 | 2011 | |||||||||
| Revenues: |
||||||||||||
| U.S. Life Insurance segment: |
||||||||||||
| Life insurance |
$ | 1,982 | $ | 1,926 | $ | 2,042 | ||||||
| Long-term care insurance |
3,316 | 3,207 | 3,002 | |||||||||
| Fixed annuities |
1,032 | 1,117 | 1,086 | |||||||||
|
|
|
|
|
|
|
|||||||
| U.S. Life Insurance segment’s revenues |
6,330 | 6,250 | 6,130 | |||||||||
|
|
|
|
|
|
|
|||||||
| International Mortgage Insurance segment: |
||||||||||||
| Canada |
760 | 786 | 823 | |||||||||
| Australia |
555 | 567 | 612 | |||||||||
| Other Countries |
46 | 55 | 72 | |||||||||
|
|
|
|
|
|
|
|||||||
| International Mortgage Insurance segment’s revenues |
1,361 | 1,408 | 1,507 | |||||||||
|
|
|
|
|
|
|
|||||||
| U.S. Mortgage Insurance segment’s revenues |
616 | 676 | 702 | |||||||||
|
|
|
|
|
|
|
|||||||
| International Protection segment’s revenues |
786 | 822 | 1,022 | |||||||||
|
|
|
|
|
|
|
|||||||
| Runoff segment’s revenues |
302 | 381 | 525 | |||||||||
|
|
|
|
|
|
|
|||||||
| Corporate and Other’s revenues |
8 | 103 | 37 | |||||||||
|
|
|
|
|
|
|
|||||||
| Total revenues |
$ | 9,403 | $ | 9,640 | $ | 9,923 | ||||||
|
|
|
|
|
|
|
|||||||
329
GENWORTH FINANCIAL, INC.
NOTES TO CONSOLIDATED FINANCIAL STATEMENTS
Years Ended December 31, 2013, 2012 and 2011
(c) Net Operating Income (Loss)
The following is a summary of net operating income (loss) for our segments and Corporate and Other activities for the years ended December 31:
| (Amounts in millions) |
2013 | 2012 | 2011 | |||||||||
| U.S. Life Insurance segment: |
||||||||||||
| Life insurance |
$ | 173 | $ | 151 | $ | 180 | ||||||
| Long-term care insurance |
129 | 101 | 99 | |||||||||
| Fixed annuities |
92 | 82 | 78 | |||||||||
|
|
|
|
|
|
|
|||||||
| U.S. Life Insurance segment’s net operating income |
394 | 334 | 357 | |||||||||
|
|
|
|
|
|
|
|||||||
| International Mortgage Insurance segment: |
||||||||||||
| Canada |
170 | 234 | 159 | |||||||||
| Australia |
228 | 142 | 196 | |||||||||
| Other Countries |
(37 | ) | (34 | ) | (27 | ) | ||||||
|
|
|
|
|
|
|
|||||||
| International Mortgage Insurance segment’s net operating income |
361 | 342 | 328 | |||||||||
|
|
|
|
|
|
|
|||||||
| U.S. Mortgage Insurance segment’s net operating income (loss) |
37 | (138 | ) | (524 | ) | |||||||
|
|
|
|
|
|
|
|||||||
| International Protection segment’s net operating income |
24 | 24 | 91 | |||||||||
|
|
|
|
|
|
|
|||||||
| Runoff segment’s net operating income |
66 | 46 | 27 | |||||||||
|
|
|
|
|
|
|
|||||||
| Corporate and Other’s net operating loss |
(266 | ) | (205 | ) | (225 | ) | ||||||
|
|
|
|
|
|
|
|||||||
| Net operating income |
616 | 403 | 54 | |||||||||
| Net investment gains (losses), net of taxes and other adjustments |
(11 | ) | (1 | ) | (100 | ) | ||||||
| Goodwill impairment, net of taxes |
— | (86 | ) | (19 | ) | |||||||
| Gain on sale of business, net of taxes |
— | — | 36 | |||||||||
| Expenses related to restructuring, net of taxes |
(13 | ) | — | — | ||||||||
| Gains (losses) on early extinguishment of debt, net of taxes |
(20 | ) | (1 | ) | 31 | |||||||
| Gains (losses) from life block transactions, net of taxes |
— | (47 | ) | — | ||||||||
| Income (loss) from discontinued operations, net of taxes |
(12 | ) | 57 | 36 | ||||||||
|
|
|
|
|
|
|
|||||||
| Net income available to Genworth Financial, Inc.’s common stockholders |
560 | 325 | 38 | |||||||||
| Add: net income attributable to noncontrolling interests |
154 | 200 | 139 | |||||||||
|
|
|
|
|
|
|
|||||||
| Net income |
$ | 714 | $ | 525 | $ | 177 | ||||||
|
|
|
|
|
|
|
|||||||
330
GENWORTH FINANCIAL, INC.
NOTES TO CONSOLIDATED FINANCIAL STATEMENTS
Years Ended December 31, 2013, 2012 and 2011
(d) Geographic Segment Information
We conduct our operations in the following geographic regions: (1) United States (2) Canada (3) Australia and (4) Other Countries.
The following is a summary of geographic region activity as of or for the years ended December 31:
| 2013 |
Other Countries |
|||||||||||||||||||
| (Amounts in millions) |
United States | Canada | Australia | Total | ||||||||||||||||
| Total revenues |
$ | 7,256 | $ | 760 | $ | 555 | $ | 832 | $ | 9,403 | ||||||||||
|
|
|
|
|
|
|
|
|
|
|
|||||||||||
| Income from continuing operations |
$ | 161 | $ | 336 | $ | 227 | $ | 2 | $ | 726 | ||||||||||
|
|
|
|
|
|
|
|
|
|
|
|||||||||||
| Net income |
$ | 149 | $ | 336 | $ | 227 | $ | 2 | $ | 714 | ||||||||||
|
|
|
|
|
|
|
|
|
|
|
|||||||||||
| Total assets |
$ | 96,790 | $ | 5,313 | $ | 3,419 | $ | 2,523 | $ | 108,045 | ||||||||||
|
|
|
|
|
|
|
|
|
|
|
|||||||||||
| 2012 |
Other Countries |
|||||||||||||||||||
| (Amounts in millions) |
United States | Canada | Australia | Total | ||||||||||||||||
| Total revenues |
$ | 7,410 | $ | 786 | $ | 567 | $ | 877 | $ | 9,640 | ||||||||||
|
|
|
|
|
|
|
|
|
|
|
|||||||||||
| Income (loss) from continuing operations |
$ | (22 | ) | $ | 439 | $ | 140 | $ | (89 | ) | $ | 468 | ||||||||
|
|
|
|
|
|
|
|
|
|
|
|||||||||||
| Net income (loss) |
$ | 35 | $ | 439 | $ | 140 | $ | (89 | ) | $ | 525 | |||||||||
|
|
|
|
|
|
|
|
|
|
|
|||||||||||
| Segment assets |
$ | 100,665 | $ | 5,678 | $ | 3,885 | $ | 2,645 | $ | 112,873 | ||||||||||
|
|
|
|
|
|
|
|
|
|
|
|||||||||||
| Assets associated with discontinued operations |
$ | 439 | $ | — | $ | — | $ | — | $ | 439 | ||||||||||
|
|
|
|
|
|
|
|
|
|
|
|||||||||||
| Total assets |
$ | 101,104 | $ | 5,678 | $ | 3,885 | $ | 2,645 | $ | 113,312 | ||||||||||
|
|
|
|
|
|
|
|
|
|
|
|||||||||||
| 2011 |
Other Countries |
|||||||||||||||||||
| (Amounts in millions) |
United States | Canada | Australia | Total | ||||||||||||||||
| Total revenues |
$ | 7,394 | $ | 823 | $ | 612 | $ | 1,094 | $ | 9,923 | ||||||||||
|
|
|
|
|
|
|
|
|
|
|
|||||||||||
| Income (loss) from continuing operations |
$ | (441 | ) | $ | 301 | $ | 218 | $ | 63 | $ | 141 | |||||||||
|
|
|
|
|
|
|
|
|
|
|
|||||||||||
| Net income (loss) |
$ | (405 | ) | $ | 301 | $ | 218 | $ | 63 | $ | 177 | |||||||||
|
|
|
|
|
|
|
|
|
|
|
|||||||||||
331
GENWORTH FINANCIAL, INC.
NOTES TO CONSOLIDATED FINANCIAL STATEMENTS
Years Ended December 31, 2013, 2012 and 2011
(21) Quarterly Results of Operations (unaudited)
Our unaudited quarterly results of operations for the year ended December 31, 2013 are summarized in the table below.
| Three months ended | ||||||||||||||||
| (Amounts in millions, except per share amounts) |
March 31, 2013 |
June 30, 2013 |
September 30, 2013 |
December 31, 2013 |
||||||||||||
| Total revenues |
$ | 2,303 | $ | 2,371 | $ | 2,317 | $ | 2,412 | ||||||||
|
|
|
|
|
|
|
|
|
|||||||||
| Total benefits and expenses |
$ | 2,066 | $ | 2,124 | $ | 2,066 | $ | 2,097 | ||||||||
|
|
|
|
|
|
|
|
|
|||||||||
| Income from continuing operations |
$ | 161 | $ | 174 | $ | 146 | $ | 245 | ||||||||
|
|
|
|
|
|
|
|
|
|||||||||
| Income (loss) from discontinued operations, net of taxes |
$ | (20 | ) | $ | 6 | $ | 2 | $ | — | |||||||
|
|
|
|
|
|
|
|
|
|||||||||
| Net income |
$ | 141 | $ | 180 | $ | 148 | $ | 245 | ||||||||
|
|
|
|
|
|
|
|
|
|||||||||
| Net income attributable to noncontrolling interests |
$ | 38 | $ | 39 | $ | 40 | $ | 37 | ||||||||
|
|
|
|
|
|
|
|
|
|||||||||
| Net income available to Genworth Financial, Inc.’s common stockholders |
$ | 103 | $ | 141 | $ | 108 | $ | 208 | ||||||||
|
|
|
|
|
|
|
|
|
|||||||||
| Income from continuing operations available to Genworth Financial, Inc.’s common stockholders per common share: |
||||||||||||||||
| Basic |
$ | 0.25 | $ | 0.27 | $ | 0.21 | $ | 0.42 | ||||||||
|
|
|
|
|
|
|
|
|
|||||||||
| Diluted |
$ | 0.25 | $ | 0.27 | $ | 0.21 | $ | 0.42 | ||||||||
|
|
|
|
|
|
|
|
|
|||||||||
| Net income available to Genworth Financial, Inc.’s common stockholders per common share: |
||||||||||||||||
| Basic |
$ | 0.21 | $ | 0.29 | $ | 0.22 | $ | 0.42 | ||||||||
|
|
|
|
|
|
|
|
|
|||||||||
| Diluted |
$ | 0.21 | $ | 0.28 | $ | 0.22 | $ | 0.41 | ||||||||
|
|
|
|
|
|
|
|
|
|||||||||
| Weighted-average common shares outstanding: |
||||||||||||||||
| Basic |
492.5 | 493.4 | 494.0 | 494.7 | ||||||||||||
| Diluted |
496.8 | 497.5 | 499.3 | 501.2 | ||||||||||||
332
GENWORTH FINANCIAL, INC.
NOTES TO CONSOLIDATED FINANCIAL STATEMENTS
Years Ended December 31, 2013, 2012 and 2011
Our unaudited quarterly results of operations for the year ended December 31, 2012 are summarized in the table below.
| Three months ended | ||||||||||||||||
| (Amounts in millions, except per share amounts) |
March 31, 2012 |
June 30, 2012 |
September 30, 2012 |
December 31, 2012 |
||||||||||||
| Total revenues |
$ | 2,315 | $ | 2,402 | $ | 2,456 | $ | 2,467 | ||||||||
|
|
|
|
|
|
|
|
|
|||||||||
| Total benefits and expenses (1) |
$ | 2,233 | $ | 2,293 | $ | 2,374 | $ | 2,134 | ||||||||
|
|
|
|
|
|
|
|
|
|||||||||
| Income from continuing operations (1) |
$ | 67 | $ | 82 | $ | 59 | $ | 260 | ||||||||
|
|
|
|
|
|
|
|
|
|||||||||
| Income from discontinued operations, net of taxes |
$ | 12 | $ | 27 | $ | 12 | $ | 6 | ||||||||
|
|
|
|
|
|
|
|
|
|||||||||
| Net income (1) |
$ | 79 | $ | 109 | $ | 71 | $ | 266 | ||||||||
|
|
|
|
|
|
|
|
|
|||||||||
| Net income attributable to noncontrolling interests (1) |
$ | 33 | $ | 33 | $ | 36 | $ | 98 | ||||||||
|
|
|
|
|
|
|
|
|
|||||||||
| Net income available to Genworth Financial, Inc.’s common stockholders (1) |
$ | 46 | $ | 76 | $ | 35 | $ | 168 | ||||||||
|
|
|
|
|
|
|
|
|
|||||||||
| Income from continuing operations available to Genworth Financial, Inc.’s common stockholders per common share: |
||||||||||||||||
| Basic |
$ | 0.07 | $ | 0.10 | $ | 0.05 | $ | 0.33 | ||||||||
|
|
|
|
|
|
|
|
|
|||||||||
| Diluted |
$ | 0.07 | $ | 0.10 | $ | 0.05 | $ | 0.33 | ||||||||
|
|
|
|
|
|
|
|
|
|||||||||
| Net income available to Genworth Financial, Inc.’s common stockholders per common share: |
||||||||||||||||
| Basic |
$ | 0.09 | $ | 0.16 | $ | 0.07 | $ | 0.34 | ||||||||
|
|
|
|
|
|
|
|
|
|||||||||
| Diluted |
$ | 0.09 | $ | 0.16 | $ | 0.07 | $ | 0.34 | ||||||||
|
|
|
|
|
|
|
|
|
|||||||||
| Weighted-average common shares outstanding: |
||||||||||||||||
| Basic |
491.2 | 491.5 | 491.7 | 491.9 | ||||||||||||
| Diluted |
495.7 | 493.9 | 493.9 | 493.9 | ||||||||||||
| (1) | Effective January 1, 2013, the Government Guarantee Agreement and all obligations under it, including the requirement for the Canadian government guarantee fund and payment of exit fees, was terminated. As a result, in the fourth quarter of 2012, the accrued liability for exit fees was reversed resulting in a favorable adjustment of $186 million in expenses in the Canadian platform. This adjustment impacted net income available to Genworth Financial, Inc.’s common stockholders by $78 million, net of taxes, and net income attributable to noncontrolling interests by $58 million, net of taxes. |
(22) Commitments and Contingencies
(a) Litigation and Regulatory Matters
We face the risk of litigation and regulatory investigations and actions in the ordinary course of operating our businesses, including the risk of class action lawsuits. Our pending legal and regulatory actions include proceedings specific to us and others generally applicable to business practices in the industries in which we operate. In our insurance operations, we are, have been, or may become subject to class actions and individual suits alleging, among other things, issues relating to sales or underwriting practices, increases to in-force long-term care insurance premiums, payment of contingent or other sales commissions, claims payments and
333
GENWORTH FINANCIAL, INC.
NOTES TO CONSOLIDATED FINANCIAL STATEMENTS
Years Ended December 31, 2013, 2012 and 2011
procedures, product design, product disclosure, administration, additional premium charges for premiums paid on a periodic basis, denial or delay of benefits, charging excessive or impermissible fees on products, recommending unsuitable products to customers, our pricing structures and business practices in our mortgage insurance businesses, such as captive reinsurance arrangements with lenders and contract underwriting services, violations of the Real Estate Settlement and Procedures Act of 1974 (“RESPA”) or related state anti-inducement laws, and mortgage insurance policy rescissions and curtailments, and breaching fiduciary or other duties to customers, including but not limited to breach of customer information. Plaintiffs in class action and other lawsuits against us may seek very large or indeterminate amounts which may remain unknown for substantial periods of time. In our investment-related operations, we are subject to litigation involving commercial disputes with counterparties. We are also subject to litigation arising out of our general business activities such as our contractual and employment relationships. In addition, we are also subject to various regulatory inquiries, such as information requests, subpoenas, books and record examinations and market conduct and financial examinations from state, federal and international regulators and other authorities. A substantial legal liability or a significant regulatory action against us could have an adverse effect on our business, financial condition and results of operations. Moreover, even if we ultimately prevail in the litigation, regulatory action or investigation, we could suffer significant reputational harm, which could have an adverse effect on our business, financial condition or results of operations.
In early 2006 as part of an industry-wide review, one of our U.S. mortgage insurance subsidiaries received an administrative subpoena from the Minnesota Department of Commerce, which has jurisdiction over insurance matters, with respect to our reinsurance arrangements, including captive reinsurance transactions with lender-affiliated reinsurers. Since 2006, the Minnesota Department of Commerce has periodically requested additional information. We are engaged in discussions with the Minnesota Department of Commerce to resolve the review and we will continue to cooperate as appropriate with respect to any follow-up requests or inquiries. Inquiries from other regulatory bodies with respect to the same subject matter have been resolved or dormant for a number of years.
Beginning in December 2011 and continuing through January 2013, one of our U.S. mortgage insurance subsidiaries was named along with several other mortgage insurance participants and mortgage lenders as a defendant in twelve putative class action lawsuits alleging that certain “captive reinsurance arrangements” were in violation of RESPA. Those cases are captioned as follows: Samp, et al. v. JPMorgan Chase Bank, N.A., et al., United States District Court for the Central District of California; White, et al., v. The PNC Financial Services Group, Inc., et al., United States District Court for the Eastern District of Pennsylvania; Menichino, et al. v. Citibank NA, et al., United States District Court for the Western District of Pennsylvania; McCarn, et al. v. HSBC USA, Inc., et al., United States District Court for the Eastern District of California; Manners, et al., v. Fifth Third Bank, et al., United States District court for the Western District of Pennsylvania; Riddle, et al. v. Bank of America Corporation, et al., United States District Court for the Eastern District of Pennsylvania; Rulison et al. v. ABN AMRO Mortgage Group, Inc. et al., United States District Court for the Southern District of New York; Barlee, et al. v. First Horizon National Corporation, et al., United States District Court for the Eastern District of Pennsylvania; Cunningham, et al. v. M&T Bank Corp., et al., United States District Court for the Middle District of Pennsylvania; Orange, et al. v. Wachovia Bank, N.A., et al., United States District Court for the Central District of California; Hill et al. v. Flagstar Bank, FSB, et al., United States District Court for the Eastern District of Pennsylvania; and Moriba BA, et al. v. HSBC USA, Inc., et al., United States District Court for the Eastern District of Pennsylvania. Plaintiffs allege that “captive reinsurance arrangements” with providers of private mortgage insurance whereby a mortgage lender through captive reinsurance arrangements received a portion of the borrowers’ private mortgage insurance premiums were in violation of RESPA and unjustly enriched the defendants for which plaintiffs seek declaratory relief and
334
GENWORTH FINANCIAL, INC.
NOTES TO CONSOLIDATED FINANCIAL STATEMENTS
Years Ended December 31, 2013, 2012 and 2011
unspecified monetary damages, including restitution. The McCarn case was dismissed by the Court with prejudice as to our subsidiary and certain other defendants on November 9, 2012. On July 3, 2012, the Rulison case was voluntarily dismissed by the plaintiffs. The Barlee case was dismissed by the Court with prejudice as to our subsidiary and certain other defendants on February 27, 2013. The Manners case was dismissed by voluntary stipulation in March 2013. In early May, 2013, the Samp and Orange cases were dismissed with prejudice as to our subsidiary. Plaintiffs appealed both of those dismissals, but have since withdrawn those appeals. The White case was dismissed by the court without prejudice on June 20, 2013, and on July 5, 2013 plaintiffs filed a second amended complaint again naming our U.S. mortgage insurance subsidiary as a defendant. On July 22, 2013, we moved to dismiss the second amended complaint. In the Riddle, Hill, Ba and Cunningham cases, the defendants’ motions to dismiss were denied, but the Court in the Riddle, Hill and Cunningham cases limited discovery at this stage to issues surrounding whether the case should be dismissed on statute of limitations grounds. In the Hill case, on December 17, 2013 we moved for summary judgment dismissing the complaint. In the Riddle case, in late November, 2013, the Court granted our motion for summary judgment dismissing the case. Plaintiffs have appealed that dismissal. The Menichino case was dismissed by the court without prejudice as to our subsidiary and certain other defendants on July 19, 2013. Plaintiffs filed a second amended complaint again naming our U.S. mortgage insurance subsidiary as a defendant and we moved to dismiss the second amended complaint. We intend to vigorously defend the remaining actions.
In December 2009, one of our non-insurance subsidiaries, one of the subsidiary’s officers and Genworth Financial, Inc. were named in a putative class action lawsuit captioned Michael J. Goodman and Linda Brown v. Genworth Financial Wealth Management, Inc., et al., in the United States District Court for the Eastern District of New York. Plaintiffs allege securities law and other violations involving the selection of mutual funds by our subsidiary on behalf of certain of its Private Client Group clients. The lawsuit seeks unspecified monetary damages and other relief. In response to our motion to dismiss the complaint in its entirety, the Court granted the motion to dismiss the state law fiduciary duty claim and denied the motion to dismiss the remaining federal claims. Oral argument on plaintiffs’ motion to certify a class was conducted on January 30, 2013, but the Court has not yet issued a decision. We will continue to vigorously defend this action.
As previously disclosed, in April 2012, two of our U.S. mortgage insurance subsidiaries were named as respondents in two arbitrations, one brought by Bank of America, N.A. and one brought by Countrywide Home Loans, Inc. and Bank of America, N.A. as claimants. Claimants alleged breach of contract and breach of the covenant of good faith and fair dealing and sought in excess of $834 million of damages, as well as interest, punitive damages and a declaratory judgment relating to our denial, curtailment and rescission of mortgage insurance coverage. Subject to GSE approval, we reached an agreement on December 31, 2013 to resolve a portion of both arbitrations with respect to rescission practices. Under the agreement, Genworth, Bank of America, N.A and Countrywide Home Loans, Inc. have agreed to a fixed number of loans for which Genworth will reinstate mortgage insurance coverage representing a portion of the loans with rescinded coverage. Going forward, as to the loans insured by Genworth that are the subject of the agreement, including those loans that were the subject of the arbitrations, Genworth has agreed to cease all future rescission activity and pay a percentage of the claim amount otherwise payable, with no obligation for the remaining percentage. Genworth’s net economic impact of the terms of settlement fall within its previously established reserve amounts for reinstatements and had no income statement impact in the fourth quarter of 2013. The agreement resolves substantially all outstanding claims related to the rescissions of coverage on loans originated or acquired by Bank of America, N.A and Countrywide Home Loans, Inc. prior to 2009. Genworth believes that the rescission settlement resolves approximately $800 million of alleged damages and that claimants’ remaining demand is in excess of $150 million relating to curtailment and denial practices; however, we are unable to estimate the precise remaining disputed amount, in part because we continue to curtail claims, and claimants’ demand
335
GENWORTH FINANCIAL, INC.
NOTES TO CONSOLIDATED FINANCIAL STATEMENTS
Years Ended December 31, 2013, 2012 and 2011
includes unspecified punitive damages. In addition to GSE approval, consummation of the settlement is also conditioned upon the parties’ prior negotiation and execution of a definitive agreement requiring submission of curtailment and denial disputes to a binding alternative dispute proceeding (“Curtailment ADR Agreement”). Either party may terminate the agreement if the definitive Curtailment ADR Agreement is not executed by March 31, 2014. The parties continue to negotiate the terms of a Curtailment ADR Agreement. Genworth plans to continue to vigorously defend its practices.
At this time, we cannot determine or predict the ultimate outcome of any of the pending legal and regulatory matters specifically identified above or the likelihood of potential future legal and regulatory matters against us. In light of the inherent uncertainties involved in these matters, no amounts have been accrued. We also are not able to provide an estimate or range of possible losses related to these matters.
(b) Commitments
As of December 31, 2013, we were committed to fund $65 million in limited partnership investments, $29 million in U.S. commercial mortgage loan investments and $109 million in private placement investments.
In connection with the issuance of non-recourse funding obligations by Rivermont I, Genworth entered into a liquidity commitment agreement with the third-party trusts in which the floating rate notes have been deposited. The liquidity agreement may require that Genworth issue to the trusts either a loan or a letter of credit (“LOC”), at maturity of the notes (2050), in the amount equal to the then market value of the assets supporting the notes held in the trust. Any loan or LOC issued is an obligation of the trust and shall accrue interest at LIBOR plus a margin. In consideration for entering into this agreement, Genworth received, from Rivermont I, a one-time commitment fee of approximately $2 million. The maximum potential amount of future obligation under this agreement is approximately $95 million.
(23) Changes In Accumulated Other Comprehensive Income (Loss)
The following tables show the changes in accumulated OCI, net of taxes, by component as of and for the periods indicated:
| (Amounts in millions) |
Net unrealized investment gains (losses) (1) |
Derivatives qualifying as hedges (2) |
Foreign currency translation and other adjustments |
Total | ||||||||||||
| Balances as of January 1, 2013 |
$ | 2,638 | $ | 1,909 | $ | 655 | $ | 5,202 | ||||||||
| OCI before reclassifications |
(1,772 | ) | (561 | ) | (442 | ) | (2,775 | ) | ||||||||
| Amounts reclassified from OCI |
21 | (29 | ) | — | (8 | ) | ||||||||||
|
|
|
|
|
|
|
|
|
|||||||||
| Current period OCI |
(1,751 | ) | (590 | ) | (442 | ) | (2,783 | ) | ||||||||
|
|
|
|
|
|
|
|
|
|||||||||
| Balances as of December 31, 2013 before noncontrolling interests |
887 | 1,319 | 213 | 2,419 | ||||||||||||
|
|
|
|
|
|
|
|
|
|||||||||
| Less: change in OCI attributable to noncontrolling interests |
(39 | ) | — | (84 | ) | (123 | ) | |||||||||
|
|
|
|
|
|
|
|
|
|||||||||
| Balances as of December 31, 2013 |
$ | 926 | $ | 1,319 | $ | 297 | $ | 2,542 | ||||||||
|
|
|
|
|
|
|
|
|
|||||||||
| (1) | Net of adjustments to deferred acquisition costs, present value of future profits, sales inducements and benefit reserves. See note 4 for additional information. |
| (2) | See note 5 for additional information. |
336
GENWORTH FINANCIAL, INC.
NOTES TO CONSOLIDATED FINANCIAL STATEMENTS
Years Ended December 31, 2013, 2012 and 2011
| (Amounts in millions) |
Net unrealized investment gains (losses) (1) |
Derivatives qualifying as hedges (2) |
Foreign currency translation and other adjustments |
Total | ||||||||||||
| Balances as of January 1, 2012 |
$ | 1,485 | $ | 2,009 | $ | 553 | $ | 4,047 | ||||||||
| OCI before reclassifications |
1,106 | (77 | ) | 126 | 1,155 | |||||||||||
| Amounts reclassified from OCI |
50 | (23 | ) | — | 27 | |||||||||||
|
|
|
|
|
|
|
|
|
|||||||||
| Current period OCI |
1,156 | (100 | ) | 126 | 1,182 | |||||||||||
|
|
|
|
|
|
|
|
|
|||||||||
| Balances as of December 31, 2012 before noncontrolling interests |
2,641 | 1,909 | 679 | 5,229 | ||||||||||||
|
|
|
|
|
|
|
|
|
|||||||||
| Less: change in OCI attributable to noncontrolling interests |
3 | — | 24 | 27 | ||||||||||||
|
|
|
|
|
|
|
|
|
|||||||||
| Balances as of December 31, 2012 |
$ | 2,638 | $ | 1,909 | $ | 655 | $ | 5,202 | ||||||||
|
|
|
|
|
|
|
|
|
|||||||||
| (1) | Net of adjustments to deferred acquisition costs, present value of future profits, sales inducements and benefit reserves. See note 4 for additional information. |
| (2) | See note 5 for additional information. |
| (Amounts in millions) |
Net unrealized investment gains (losses) (1) |
Derivatives qualifying as hedges (2) |
Foreign currency translation and other adjustments |
Total | ||||||||||||
| Balances as of January 1, 2011 |
$ | (80 | ) | $ | 924 | $ | 662 | $ | 1,506 | |||||||
| OCI before reclassifications |
1,551 | 1,086 | (135 | ) | 2,502 | |||||||||||
| Amounts reclassified from OCI |
53 | (1 | ) | — | 52 | |||||||||||
|
|
|
|
|
|
|
|
|
|||||||||
| Current period OCI |
1,604 | 1,085 | (135 | ) | 2,554 | |||||||||||
|
|
|
|
|
|
|
|
|
|||||||||
| Balances as of December 31, 2011 before noncontrolling interests |
1,524 | 2,009 | 527 | 4,060 | ||||||||||||
|
|
|
|
|
|
|
|
|
|||||||||
| Less: change in OCI attributable to noncontrolling interests |
39 | — | (26 | ) | 13 | |||||||||||
|
|
|
|
|
|
|
|
|
|||||||||
| Balances as of December 31, 2011 |
$ | 1,485 | $ | 2,009 | $ | 553 | $ | 4,047 | ||||||||
|
|
|
|
|
|
|
|
|
|||||||||
| (1) | Net of adjustments to deferred acquisition costs, present value of future profits, sales inducements and benefit reserves. See note 4 for additional information. |
| (2) | See note 5 for additional information. |
The foreign currency translation and other adjustments balance included $6 million, $26 million and $19 million, respectively, net of taxes of $1 million, $15 million and $11 million, respectively, related to a net unrecognized postretirement benefit obligation as of December 31, 2013, 2012 and 2011. Amount also included taxes of $39 million, $58 million and $48 million, respectively, related to foreign currency translation adjustments as of December 31, 2013, 2012 and 2011.
337
GENWORTH FINANCIAL, INC.
NOTES TO CONSOLIDATED FINANCIAL STATEMENTS
Years Ended December 31, 2013, 2012 and 2011
The following table shows reclassifications out of accumulated other comprehensive income (loss), net of taxes, for the periods presented:
| Amount reclassified from accumulated other comprehensive income |
Affected line item in the | |||||||||||||
| Years ended December 31, |
||||||||||||||
| (Amounts in millions) |
2013 | 2012 | 2011 | |||||||||||
| Net unrealized investment (gains) losses: |
||||||||||||||
| Unrealized (gains) losses on investments (1) |
$ | 33 | $ | 77 | $ | 82 | Net investment gains (losses) | |||||||
| Provision for income taxes |
(12 | ) | (27 | ) | (29 | ) | Provision for income taxes | |||||||
|
|
|
|
|
|
|
|||||||||
| Total |
$ | 21 | $ | 50 | $ | 53 | ||||||||
|
|
|
|
|
|
|
|||||||||
| Derivatives qualifying as hedges: |
||||||||||||||
| Interest rate swaps hedging assets |
$ | (47 | ) | $ | (40 | ) | $ | (27 | ) | Net investment income | ||||
| Interest rate swaps hedging assets |
(1 | ) | (2 | ) | (2 | ) | Net investment gains (losses) | |||||||
| Interest rate swaps hedging liabilities |
(2 | ) | (2 | ) | (2 | ) | Interest expense | |||||||
| Inflation indexed swaps |
5 | 9 | 25 | Net investment income | ||||||||||
| Foreign currency swaps |
— | — | 5 | Interest expense | ||||||||||
| Provision for income taxes |
16 | 12 | — | Provision for income taxes | ||||||||||
|
|
|
|
|
|
|
|||||||||
| Total |
$ | (29 | ) | $ | (23 | ) | $ | (1 | ) | |||||
|
|
|
|
|
|
|
|||||||||
| (1) | Amounts exclude adjustments to deferred acquisition costs, present value of future profits, sales inducements and benefit reserves. |
In July 2009, Genworth Canada, our indirect subsidiary, completed the IPO of its common shares and Brookfield Life Assurance Company Limited (“Brookfield”), our indirect wholly-owned subsidiary, beneficially owned 57.5% of the common shares of Genworth Canada.
In June 2011, Genworth Canada repurchased approximately 6.2 million common shares for CAD$160 million through a substantial issuer bid. Brookfield participated in the issuer bid by making a proportionate tender and received CAD$90 million and Brookfield continued to hold approximately 57.5% of the outstanding common shares of Genworth Canada in June 2011.
In August 2011, we executed a non-cash intercompany transaction to increase the statutory capital in our U.S. mortgage insurance companies by contributing to those companies a portion of the common shares of Genworth Canada that were held by Brookfield outside of our U.S. mortgage insurance business, with an estimated market value of $375 million. We continued to hold approximately 57.5% of the outstanding common shares of Genworth Canada on a consolidated basis in August 2011.
During 2013, Genworth Canada repurchased 3.9 million shares for CAD$105 million through a Normal Course Issuer Bid (“NCIB”) authorized by its board for up to 4.9 million shares. We participated in the NCIB in order to maintain our overall ownership percentage at its current level and received $58 million. Purchases of Genworth Canada’s common shares may continue until the earlier of May 2, 2014 and the date on which Genworth Canada has purchased the maximum number of authorized shares under the NCIB.
338
GENWORTH FINANCIAL, INC.
NOTES TO CONSOLIDATED FINANCIAL STATEMENTS
Years Ended December 31, 2013, 2012 and 2011
We currently hold approximately 57.4% of the outstanding common shares of Genworth Canada on a consolidated basis. In addition, Brookfield has the right, exercisable at its discretion, to purchase for cash these common shares of Genworth Canada from our U.S. mortgage insurance companies at the then-current market price. Brookfield also has a right of first refusal with respect to the transfer of these common shares of Genworth Canada by our U.S. mortgage insurance companies.
In 2013, 2012 and 2011, dividends of $52 million, $50 million and $67 million, respectively, were paid to the noncontrolling interests.
On March 27, 2013, we announced that we had agreed to sell our wealth management business to AqGen Liberty Acquisition, Inc., a subsidiary of AqGen Liberty Holdings LLC, a partnership of Aquiline Capital Partners and Genstar Capital. Historically, this business had been reported as a separate segment. As a result of the sale agreement, this business was accounted for as discontinued operations and its financial position, results of operations and cash flows were separately reported for all periods presented. Also included in discontinued operations was our tax and advisor unit, Genworth Financial Investment Services (“GFIS”), which was part of our wealth management business until the closing of its sale on April 2, 2012 as discussed below.
The assets and liabilities associated with discontinued operations prior to the sale were segregated in the consolidated balance sheets. The major assets and liability categories were as follows as of December 31:
| (Amounts in millions) |
2013 | 2012 | ||||||
| Assets |
||||||||
| Other invested assets |
$ | — | $ | 10 | ||||
| Cash and cash equivalents |
— | 21 | ||||||
| Intangible assets |
— | 115 | ||||||
| Goodwill |
— | 260 | ||||||
| Other assets |
— | 33 | ||||||
|
|
|
|
|
|||||
| Assets associated with discontinued operations |
$ | — | $ | 439 | ||||
|
|
|
|
|
|||||
| Liabilities |
||||||||
| Other liabilities |
$ | — | $ | 48 | ||||
| Deferred tax liability |
— | 13 | ||||||
|
|
|
|
|
|||||
| Liabilities associated with discontinued operations |
$ | — | $ | 61 | ||||
|
|
|
|
|
|||||
Summary operating results of discontinued operations were as follows for the years ended December 31:
| (Amounts in millions) |
2013 | 2012 | 2011 | |||||||||
| Revenues |
$ | 211 | $ | 387 | $ | 428 | ||||||
|
|
|
|
|
|
|
|||||||
| Income (loss) before income taxes |
$ | (5 | ) | $ | 110 | $ | 59 | |||||
| Provision for income taxes |
7 | 53 | 23 | |||||||||
|
|
|
|
|
|
|
|||||||
| Income (loss) from discontinued operations, net of taxes |
$ | (12 | ) | $ | 57 | $ | 36 | |||||
|
|
|
|
|
|
|
|||||||
339
GENWORTH FINANCIAL, INC.
NOTES TO CONSOLIDATED FINANCIAL STATEMENTS
Years Ended December 31, 2013, 2012 and 2011
On December 31, 2010, we acquired the operating assets of Altegris Capital, LLC. (“Altegris”) as part of our wealth management business which provided a platform of alternative investments, including hedge funds and managed futures products. Under the terms of the agreement, we paid approximately $40 million at closing and we could have been obligated to pay additional performance-based payments of up to $88 million during the five-year period following closing. In 2012, we made a payment of $18 million related to the contingent consideration as a result of Altegris achieving certain performance targets.
On August 29, 2008, we acquired Quantuvis Consulting, Inc. (“Quantuvis”), an investment advisor consulting business, as part of our wealth management business for $3 million plus potential contingent consideration of up to $3 million. In 2011, we paid $1 million of contingent consideration related to this acquisition. Quantuvis was included in the sale of our wealth management business in 2013 as discussed below.
On August 30, 2013, we completed the sale of our wealth management business for approximately $412 million with net proceeds of approximately $360 million. During the three months ended March 31, 2013, in connection with the agreement to sell the wealth management business, we recognized a goodwill impairment of $13 million as a result of the carrying value for the business exceeding fair value. Additionally, we agreed to settle our contingent consideration liability related to our purchase of Altegris for approximately $40 million, which resulted in a loss of approximately $5 million from the change in fair value of this liability. In accordance with the accounting guidance for groups of assets that are held-for-sale, we recorded an additional loss of approximately $9 million to record the carrying value of the business at its fair value less costs to sell. During the three months ended September 30, 2013, we recognized an additional after-tax loss on the sale of $2 million at closing, which was based on carrying value and working capital at close, as well as expenses associated with the sale.
On April 2, 2012, we completed the sale of our tax and accounting financial advisor unit, GFIS, for approximately $79 million, plus contingent consideration, to Cetera Financial Group. The contingent consideration was recorded at fair value upon disposition and provides the opportunity for us to receive additional future payments of up to approximately $25 million based on achieving certain revenue goals. The fair value of this contingent consideration receivable was recorded in Corporate and Other activities and remains a component of continuing operations. We recognized an after-tax gain of $13 million related to the sale, which was included in income from discontinued operations, net of taxes.
(26) Condensed Consolidating Financial Information
On April 1, 2013, in connection with the reorganization discussed in note 1: (a) Genworth Financial provided a full and unconditional guarantee to the trustee of Genworth Holdings’ outstanding senior notes and the holders of the senior notes, on an unsecured unsubordinated basis, of the full and punctual payment of the principal of, premium, if any and interest on, and all other amounts payable under, each outstanding series of senior notes, and the full and punctual payment of all other amounts payable by Genworth Holdings under the senior notes indenture in respect of such senior notes and (b) Genworth Financial provided a full and unconditional guarantee to the trustee of Genworth Holdings’ outstanding subordinated notes and the holders of the subordinated notes, on an unsecured subordinated basis, of the full and punctual payment of the principal of, premium, if any and interest on, and all other amounts payable under, the outstanding subordinated notes, and the full and punctual payment of all other amounts payable by Genworth Holdings under the subordinated notes indenture in respect of the subordinated notes.
340
GENWORTH FINANCIAL, INC.
NOTES TO CONSOLIDATED FINANCIAL STATEMENTS
Years Ended December 31, 2013, 2012 and 2011
The following condensed consolidating financial information of Genworth Financial and its direct and indirect subsidiaries have been prepared pursuant to rules regarding the preparation of consolidating financial information of Regulation S-X. The condensed consolidating financial information has been prepared as if the guarantee had been in place during the periods presented herein.
The condensed consolidating financial information presents the condensed consolidating balance sheet information as of December 31, 2013 and 2012 and the condensed consolidating income statement information, condensed consolidating comprehensive income statement information and condensed consolidating cash flow statement information for the years ended December 31, 2013, 2012 and 2011.
The condensed consolidating financial information reflects Genworth Financial (“Parent Guarantor”), Genworth Holdings (“Issuer”) and each of Genworth Financial’s other direct and indirect subsidiaries (the “All Other Subsidiaries”) on a combined basis, none of which guarantee the senior notes or subordinated notes, as well as the eliminations necessary to present Genworth Financial’s financial information on a consolidated basis and total consolidated amounts.
The accompanying condensed consolidating financial information is presented based on the equity method of accounting for all periods presented. Under this method, investments in subsidiaries are recorded at cost and adjusted for the subsidiaries’ cumulative results of operations, capital contributions and distributions, and other changes in equity. Elimination entries include consolidating and eliminating entries for investments in subsidiaries and intercompany activity.
341
GENWORTH FINANCIAL, INC.
NOTES TO CONSOLIDATED FINANCIAL STATEMENTS
Years Ended December 31, 2013, 2012 and 2011
The following table presents the condensed consolidating balance sheet information as of December 31, 2013:
| (Amounts in millions) |
Parent Guarantor |
Issuer | All Other Subsidiaries |
Eliminations | Consolidated | |||||||||||||||
| Assets |
||||||||||||||||||||
| Investments: |
||||||||||||||||||||
| Fixed maturity securities available-for-sale, at fair value |
$ | — | $ | 150 | $ | 58,679 | $ | (200 | ) | $ | 58,629 | |||||||||
| Equity securities available-for-sale, at fair value |
— | — | 341 | — | 341 | |||||||||||||||
| Commercial mortgage loans |
— | — | 5,899 | — | 5,899 | |||||||||||||||
| Restricted commercial mortgage loans related to securitization entities |
— | — | 233 | — | 233 | |||||||||||||||
| Policy loans |
— | — | 1,434 | — | 1,434 | |||||||||||||||
| Other invested assets |
— | 91 | 1,595 | — | 1,686 | |||||||||||||||
| Restricted other invested assets related to securitization entities, at fair value |
— | — | 391 | — | 391 | |||||||||||||||
| Investments in subsidiaries |
14,358 | 14,929 | — | (29,287 | ) | — | ||||||||||||||
|
|
|
|
|
|
|
|
|
|
|
|||||||||||
| Total investments |
14,358 | 15,170 | 68,572 | (29,487 | ) | 68,613 | ||||||||||||||
| Cash and cash equivalents |
— | 1,219 | 2,995 | — | 4,214 | |||||||||||||||
| Accrued investment income |
— | — | 682 | (4 | ) | 678 | ||||||||||||||
| Deferred acquisition costs |
— | — | 5,278 | — | 5,278 | |||||||||||||||
| Intangible assets |
— | — | 399 | — | 399 | |||||||||||||||
| Goodwill |
— | — | 867 | — | 867 | |||||||||||||||
| Reinsurance recoverable |
— | — | 17,219 | — | 17,219 | |||||||||||||||
| Other assets |
(2 | ) | 276 | 367 | (2 | ) | 639 | |||||||||||||
| Intercompany notes receivable |
8 | 248 | 393 | (649 | ) | — | ||||||||||||||
| Separate account assets |
— | — | 10,138 | — | 10,138 | |||||||||||||||
|
|
|
|
|
|
|
|
|
|
|
|||||||||||
| Total assets |
$ | 14,364 | $ | 16,913 | $ | 106,910 | $ | (30,142 | ) | $ | 108,045 | |||||||||
|
|
|
|
|
|
|
|
|
|
|
|||||||||||
| Liabilities and stockholders’ equity |
||||||||||||||||||||
| Liabilities: |
||||||||||||||||||||
| Future policy benefits |
$ | — | $ | — | $ | 33,705 | $ | — | $ | 33,705 | ||||||||||
| Policyholder account balances |
— | — | 25,528 | — | 25,528 | |||||||||||||||
| Liability for policy and contract claims |
— | — | 7,204 | — | 7,204 | |||||||||||||||
| Unearned premiums |
— | — | 4,107 | — | 4,107 | |||||||||||||||
| Other liabilities |
(3 | ) | 365 | 3,739 | (5 | ) | 4,096 | |||||||||||||
| Intercompany notes payable |
— | 601 | 248 | (849 | ) | — | ||||||||||||||
| Borrowings related to securitization entities |
— | — | 242 | — | 242 | |||||||||||||||
| Non-recourse funding obligations |
— | — | 2,038 | — | 2,038 | |||||||||||||||
| Long-term borrowings |
— | 4,636 | 525 | — | 5,161 | |||||||||||||||
| Deferred tax liability |
(26 | ) | (796 | ) | 1,028 | — | 206 | |||||||||||||
| Separate account liabilities |
— | — | 10,138 | — | 10,138 | |||||||||||||||
|
|
|
|
|
|
|
|
|
|
|
|||||||||||
| Total liabilities |
(29 | ) | 4,806 | 88,502 | (854 | ) | 92,425 | |||||||||||||
|
|
|
|
|
|
|
|
|
|
|
|||||||||||
| Stockholders’ equity: |
||||||||||||||||||||
| Common stock |
1 | — | — | — | 1 | |||||||||||||||
| Additional paid-in capital |
12,127 | 9,297 | 17,215 | (26,512 | ) | 12,127 | ||||||||||||||
| Accumulated other comprehensive income (loss) |
2,542 | 2,507 | 2,512 | (5,019 | ) | 2,542 | ||||||||||||||
| Retained earnings |
2,423 | 303 | (2,551 | ) | 2,248 | 2,423 | ||||||||||||||
| Treasury stock, at cost |
(2,700 | ) | — | — | — | (2,700 | ) | |||||||||||||
|
|
|
|
|
|
|
|
|
|
|
|||||||||||
| Total Genworth Financial, Inc.’s stockholders’ equity |
14,393 | 12,107 | 17,176 | (29,283 | ) | 14,393 | ||||||||||||||
| Noncontrolling interests |
— | — | 1,232 | (5 | ) | 1,227 | ||||||||||||||
|
|
|
|
|
|
|
|
|
|
|
|||||||||||
| Total stockholders’ equity |
14,393 | 12,107 | 18,408 | (29,288 | ) | 15,620 | ||||||||||||||
|
|
|
|
|
|
|
|
|
|
|
|||||||||||
| Total liabilities and stockholders’ equity |
$ | 14,364 | $ | 16,913 | $ | 106,910 | $ | (30,142 | ) | $ | 108,045 | |||||||||
|
|
|
|
|
|
|
|
|
|
|
|||||||||||
342
GENWORTH FINANCIAL, INC.
NOTES TO CONSOLIDATED FINANCIAL STATEMENTS
Years Ended December 31, 2013, 2012 and 2011
The following table presents the condensed consolidating balance sheet information as of December 31, 2012:
| (Amounts in millions) |
Parent Guarantor |
Issuer | All Other Subsidiaries |
Eliminations | Consolidated | |||||||||||||||
| Assets |
||||||||||||||||||||
| Investments: |
||||||||||||||||||||
| Fixed maturity securities available-for-sale, at fair value |
$ | — | $ | 151 | $ | 62,210 | $ | (200 | ) | $ | 62,161 | |||||||||
| Equity securities available-for-sale, at fair value |
— | — | 518 | — | 518 | |||||||||||||||
| Commercial mortgage loans |
— | — | 5,872 | — | 5,872 | |||||||||||||||
| Restricted commercial mortgage loans related to securitization entities |
— | — | 341 | — | 341 | |||||||||||||||
| Policy loans |
— | — | 1,601 | — | 1,601 | |||||||||||||||
| Other invested assets |
— | 5 | 3,488 | — | 3,493 | |||||||||||||||
| Restricted other invested assets related to securitization entities, at fair value |
— | — | 393 | — | 393 | |||||||||||||||
| Investments in subsidiaries |
16,429 | 17,725 | — | (34,154 | ) | — | ||||||||||||||
|
|
|
|
|
|
|
|
|
|
|
|||||||||||
| Total investments |
16,429 | 17,881 | 74,423 | (34,354 | ) | 74,379 | ||||||||||||||
| Cash and cash equivalents |
— | 843 | 2,789 | — | 3,632 | |||||||||||||||
| Accrued investment income |
— | — | 719 | (4 | ) | 715 | ||||||||||||||
| Deferred acquisition costs |
— | — | 5,036 | — | 5,036 | |||||||||||||||
| Intangible assets |
— | — | 366 | — | 366 | |||||||||||||||
| Goodwill |
— | — | 868 | — | 868 | |||||||||||||||
| Reinsurance recoverable |
— | — | 17,230 | — | 17,230 | |||||||||||||||
| Other assets |
1 | 294 | 417 | (2 | ) | 710 | ||||||||||||||
| Intercompany notes receivable |
— | 254 | 488 | (742 | ) | — | ||||||||||||||
| Separate account assets |
— | — | 9,937 | — | 9,937 | |||||||||||||||
| Assets associated with discontinued operations |
— | — | 439 | — | 439 | |||||||||||||||
|
|
|
|
|
|
|
|
|
|
|
|||||||||||
| Total assets |
$ | 16,430 | $ | 19,272 | $ | 112,712 | $ | (35,102 | ) | $ | 113,312 | |||||||||
|
|
|
|
|
|
|
|
|
|
|
|||||||||||
| Liabilities and stockholders’ equity |
||||||||||||||||||||
| Liabilities: |
||||||||||||||||||||
| Future policy benefits |
$ | — | $ | — | $ | 33,505 | $ | — | $ | 33,505 | ||||||||||
| Policyholder account balances |
— | — | 26,262 | — | 26,262 | |||||||||||||||
| Liability for policy and contract claims |
— | — | 7,509 | — | 7,509 | |||||||||||||||
| Unearned premiums |
— | — | 4,333 | — | 4,333 | |||||||||||||||
| Other liabilities |
1 | 342 | 4,901 | (5 | ) | 5,239 | ||||||||||||||
| Intercompany notes payable |
— | 688 | 254 | (942 | ) | — | ||||||||||||||
| Borrowings related to securitization entities |
— | — | 336 | — | 336 | |||||||||||||||
| Non-recourse funding obligations |
— | — | 2,066 | — | 2,066 | |||||||||||||||
| Long-term borrowings |
— | 4,203 | 573 | — | 4,776 | |||||||||||||||
| Deferred tax liability |
(64 | ) | (672 | ) | 2,243 | — | 1,507 | |||||||||||||
| Separate account liabilities |
— | — | 9,937 | — | 9,937 | |||||||||||||||
| Liabilities associated with discontinued operations |
— | — | 61 | — | 61 | |||||||||||||||
|
|
|
|
|
|
|
|
|
|
|
|||||||||||
| Total liabilities |
(63 | ) | 4,561 | 91,980 | (947 | ) | 95,531 | |||||||||||||
|
|
|
|
|
|
|
|
|
|
|
|||||||||||
| Stockholders’ equity: |
||||||||||||||||||||
| Common stock |
1 | — | — | — | 1 | |||||||||||||||
| Additional paid-in capital |
12,127 | 9,311 | 16,777 | (26,088 | ) | 12,127 | ||||||||||||||
| Accumulated other comprehensive income (loss) |
5,202 | 5,100 | 5,197 | (10,297 | ) | 5,202 | ||||||||||||||
| Retained earnings |
1,863 | 300 | (2,535 | ) | 2,235 | 1,863 | ||||||||||||||
| Treasury stock, at cost |
(2,700 | ) | — | — | — | (2,700 | ) | |||||||||||||
|
|
|
|
|
|
|
|
|
|
|
|||||||||||
| Total Genworth Financial, Inc.’s stockholders’ equity |
16,493 | 14,711 | 19,439 | (34,150 | ) | 16,493 | ||||||||||||||
| Noncontrolling interests |
— | — | 1,293 | (5 | ) | 1,288 | ||||||||||||||
|
|
|
|
|
|
|
|
|
|
|
|||||||||||
| Total stockholders’ equity |
16,493 | 14,711 | 20,732 | (34,155 | ) | 17,781 | ||||||||||||||
|
|
|
|
|
|
|
|
|
|
|
|||||||||||
| Total liabilities and stockholders’ equity |
$ | 16,430 | $ | 19,272 | $ | 112,712 | $ | (35,102 | ) | $ | 113,312 | |||||||||
|
|
|
|
|
|
|
|
|
|
|
|||||||||||
343
GENWORTH FINANCIAL, INC.
NOTES TO CONSOLIDATED FINANCIAL STATEMENTS
Years Ended December 31, 2013, 2012 and 2011
The following table presents the condensed consolidating income statement information for the year ended December 31, 2013:
| (Amounts in millions) |
Parent Guarantor |
Issuer | All Other Subsidiaries |
Eliminations | Consolidated | |||||||||||||||
| Revenues: |
||||||||||||||||||||
| Premiums |
$ | — | $ | — | $ | 5,148 | $ | — | $ | 5,148 | ||||||||||
| Net investment income |
(1 | ) | 1 | 3,286 | (15 | ) | 3,271 | |||||||||||||
| Net investment gains (losses) |
— | 6 | (43 | ) | — | (37 | ) | |||||||||||||
| Insurance and investment product fees and other |
— | — | 1,025 | (4 | ) | 1,021 | ||||||||||||||
|
|
|
|
|
|
|
|
|
|
|
|||||||||||
| Total revenues |
(1 | ) | 7 | 9,416 | (19 | ) | 9,403 | |||||||||||||
|
|
|
|
|
|
|
|
|
|
|
|||||||||||
| Benefits and expenses: |
||||||||||||||||||||
| Benefits and other changes in policy reserves |
— | — | 4,895 | — | 4,895 | |||||||||||||||
| Interest credited |
— | — | 738 | — | 738 | |||||||||||||||
| Acquisition and operating expenses, net of deferrals |
33 | 32 | 1,594 | — | 1,659 | |||||||||||||||
| Amortization of deferred acquisition costs and intangibles |
— | — | 569 | — | 569 | |||||||||||||||
| Interest expense |
— | 322 | 189 | (19 | ) | 492 | ||||||||||||||
|
|
|
|
|
|
|
|
|
|
|
|||||||||||
| Total benefits and expenses |
33 | 354 | 7,985 | (19 | ) | 8,353 | ||||||||||||||
|
|
|
|
|
|
|
|
|
|
|
|||||||||||
| Income from continuing operations before income taxes and equity in income of subsidiaries |
(34 | ) | (347 | ) | 1,431 | — | 1,050 | |||||||||||||
| Provision (benefit) for income taxes |
13 | (120 | ) | 431 | — | 324 | ||||||||||||||
| Equity in income of subsidiaries |
607 | 796 | — | (1,403 | ) | — | ||||||||||||||
|
|
|
|
|
|
|
|
|
|
|
|||||||||||
| Income from continuing operations |
560 | 569 | 1,000 | (1,403 | ) | 726 | ||||||||||||||
| Income (loss) from discontinued operations, net of taxes |
— | (29 | ) | 17 | — | (12 | ) | |||||||||||||
|
|
|
|
|
|
|
|
|
|
|
|||||||||||
| Net income |
560 | 540 | 1,017 | (1,403 | ) | 714 | ||||||||||||||
| Less: net income attributable to noncontrolling interests |
— | — | 154 | — | 154 | |||||||||||||||
|
|
|
|
|
|
|
|
|
|
|
|||||||||||
| Net income available to Genworth Financial, Inc.’s common stockholders |
$ | 560 | $ | 540 | $ | 863 | $ | (1,403 | ) | $ | 560 | |||||||||
|
|
|
|
|
|
|
|
|
|
|
|||||||||||
344
GENWORTH FINANCIAL, INC.
NOTES TO CONSOLIDATED FINANCIAL STATEMENTS
Years Ended December 31, 2013, 2012 and 2011
The following table presents the condensed consolidating income statement information for the year ended December 31, 2012:
| (Amounts in millions) |
Parent Guarantor |
Issuer | All Other Subsidiaries |
Eliminations | Consolidated | |||||||||||||||
| Revenues: |
||||||||||||||||||||
| Premiums |
$ | — | $ | — | $ | 5,041 | $ | — | $ | 5,041 | ||||||||||
| Net investment income |
— | 1 | 3,357 | (15 | ) | 3,343 | ||||||||||||||
| Net investment gains (losses) |
— | (29 | ) | 56 | — | 27 | ||||||||||||||
| Insurance and investment product fees and other |
— | (1 | ) | 1,234 | (4 | ) | 1,229 | |||||||||||||
|
|
|
|
|
|
|
|
|
|
|
|||||||||||
| Total revenues |
— | (29 | ) | 9,688 | (19 | ) | 9,640 | |||||||||||||
|
|
|
|
|
|
|
|
|
|
|
|||||||||||
| Benefits and expenses: |
||||||||||||||||||||
| Benefits and other changes in policy reserves |
— | — | 5,378 | — | 5,378 | |||||||||||||||
| Interest credited |
— | — | 775 | — | 775 | |||||||||||||||
| Acquisition and operating expenses, net of deferrals |
7 | 8 | 1,579 | — | 1,594 | |||||||||||||||
| Amortization of deferred acquisition costs and intangibles |
— | — | 722 | — | 722 | |||||||||||||||
| Goodwill impairment |
— | — | 89 | — | 89 | |||||||||||||||
| Interest expense |
— | 315 | 179 | (18 | ) | 476 | ||||||||||||||
|
|
|
|
|
|
|
|
|
|
|
|||||||||||
| Total benefits and expenses |
7 | 323 | 8,722 | (18 | ) | 9,034 | ||||||||||||||
|
|
|
|
|
|
|
|
|
|
|
|||||||||||
| Income from continuing operations before income taxes and equity in income of subsidiaries |
(7 | ) | (352 | ) | 966 | (1 | ) | 606 | ||||||||||||
| Provision (benefit) for income taxes |
(3 | ) | (110 | ) | 251 | — | 138 | |||||||||||||
| Equity in income of subsidiaries |
329 | 636 | (38 | ) | (927 | ) | — | |||||||||||||
|
|
|
|
|
|
|
|
|
|
|
|||||||||||
| Income from continuing operations |
325 | 394 | 677 | (928 | ) | 468 | ||||||||||||||
| Income from discontinued operations, net of taxes |
— | — | 57 | — | 57 | |||||||||||||||
|
|
|
|
|
|
|
|
|
|
|
|||||||||||
| Net income |
325 | 394 | 734 | (928 | ) | 525 | ||||||||||||||
| Less: net income attributable to noncontrolling interests |
— | — | 200 | — | 200 | |||||||||||||||
|
|
|
|
|
|
|
|
|
|
|
|||||||||||
| Net income available to Genworth Financial, Inc.’s common stockholders |
$ | 325 | $ | 394 | $ | 534 | $ | (928 | ) | $ | 325 | |||||||||
|
|
|
|
|
|
|
|
|
|
|
|||||||||||
345
GENWORTH FINANCIAL, INC.
NOTES TO CONSOLIDATED FINANCIAL STATEMENTS
Years Ended December 31, 2013, 2012 and 2011
The following table presents the condensed consolidating income statement information for the year ended December 31, 2011:
| (Amounts in millions) |
Parent Guarantor |
Issuer | All Other Subsidiaries |
Eliminations | Consolidated | |||||||||||||||
| Revenues: |
||||||||||||||||||||
| Premiums |
$ | — | $ | — | $ | 5,688 | $ | — | $ | 5,688 | ||||||||||
| Net investment income |
— | 2 | 3,393 | (15 | ) | 3,380 | ||||||||||||||
| Net investment gains (losses) |
— | (18 | ) | (177 | ) | — | (195 | ) | ||||||||||||
| Insurance and investment product fees and other |
— | 2 | 1,053 | (5 | ) | 1,050 | ||||||||||||||
|
|
|
|
|
|
|
|
|
|
|
|||||||||||
| Total revenues |
— | (14 | ) | 9,957 | (20 | ) | 9,923 | |||||||||||||
|
|
|
|
|
|
|
|
|
|
|
|||||||||||
| Benefits and expenses: |
||||||||||||||||||||
| Benefits and other changes in policy reserves |
— | — | 5,941 | — | 5,941 | |||||||||||||||
| Interest credited |
— | — | 794 | — | 794 | |||||||||||||||
| Acquisition and operating expenses, net of deferrals |
32 | 1 | 1,900 | (3 | ) | 1,930 | ||||||||||||||
| Amortization of deferred acquisition costs and intangibles |
— | — | 593 | — | 593 | |||||||||||||||
| Goodwill impairment |
— | — | 29 | — | 29 | |||||||||||||||
| Interest expense |
— | 325 | 198 | (17 | ) | 506 | ||||||||||||||
|
|
|
|
|
|
|
|
|
|
|
|||||||||||
| Total benefits and expenses |
32 | 326 | 9,455 | (20 | ) | 9,793 | ||||||||||||||
|
|
|
|
|
|
|
|
|
|
|
|||||||||||
| Income from continuing operations before income taxes and equity in income of subsidiaries |
(32 | ) | (340 | ) | 502 | — | 130 | |||||||||||||
| Provision (benefit) for income taxes |
(11 | ) | (120 | ) | 120 | — | (11 | ) | ||||||||||||
| Equity in income of subsidiaries |
59 | 769 | — | (828 | ) | — | ||||||||||||||
|
|
|
|
|
|
|
|
|
|
|
|||||||||||
| Income from continuing operations |
38 | 549 | 382 | (828 | ) | 141 | ||||||||||||||
| Income from discontinued operations, net of taxes |
— | — | 36 | — | 36 | |||||||||||||||
|
|
|
|
|
|
|
|
|
|
|
|||||||||||
| Net income |
38 | 549 | 418 | (828 | ) | 177 | ||||||||||||||
| Less: net income attributable to noncontrolling interests |
— | — | 139 | — | 139 | |||||||||||||||
|
|
|
|
|
|
|
|
|
|
|
|||||||||||
| Net income available to Genworth Financial, Inc.’s common stockholders |
$ | 38 | $ | 549 | $ | 279 | $ | (828 | ) | $ | 38 | |||||||||
|
|
|
|
|
|
|
|
|
|
|
|||||||||||
346
GENWORTH FINANCIAL, INC.
NOTES TO CONSOLIDATED FINANCIAL STATEMENTS
Years Ended December 31, 2013, 2012 and 2011
The following table presents the condensed consolidating comprehensive income statement information for the year ended December 31, 2013:
| (Amounts in millions) |
Parent Guarantor |
Issuer | All Other Subsidiaries |
Eliminations | Consolidated | |||||||||||||||
| Net income |
$ | 560 | $ | 540 | $ | 1,017 | $ | (1,403 | ) | $ | 714 | |||||||||
| Other comprehensive income (loss), net of taxes: |
||||||||||||||||||||
| Net unrealized gains (losses) on securities not other-than-temporarily impaired |
(1,778 | ) | (1,733 | ) | (1,817 | ) | 3,511 | (1,817 | ) | |||||||||||
| Net unrealized gains (losses) on other-than- temporarily impaired securities |
66 | 65 | 66 | (131 | ) | 66 | ||||||||||||||
| Derivatives qualifying as hedges |
(590 | ) | (590 | ) | (615 | ) | 1,205 | (590 | ) | |||||||||||
| Foreign currency translation and other adjustments |
(358 | ) | (335 | ) | (442 | ) | 693 | (442 | ) | |||||||||||
|
|
|
|
|
|
|
|
|
|
|
|||||||||||
| Total other comprehensive income (loss) |
(2,660 | ) | (2,593 | ) | (2,808 | ) | 5,278 | (2,783 | ) | |||||||||||
|
|
|
|
|
|
|
|
|
|
|
|||||||||||
| Total comprehensive income (loss) |
(2,100 | ) | (2,053 | ) | (1,791 | ) | 3,875 | (2,069 | ) | |||||||||||
| Less: comprehensive income attributable to noncontrolling interests |
— | — | 31 | — | 31 | |||||||||||||||
|
|
|
|
|
|
|
|
|
|
|
|||||||||||
| Total comprehensive income (loss) available to Genworth Financial, Inc.’s common stockholders |
$ | (2,100 | ) | $ | (2,053 | ) | $ | (1,822 | ) | $ | 3,875 | $ | (2,100 | ) | ||||||
|
|
|
|
|
|
|
|
|
|
|
|||||||||||
The following table presents the condensed consolidating comprehensive income statement information for the year ended December 31, 2012:
| (Amounts in millions) |
Parent Guarantor |
Issuer | All Other Subsidiaries |
Eliminations | Consolidated | |||||||||||||||
| Net income |
$ | 325 | $ | 394 | $ | 734 | $ | (928 | ) | $ | 525 | |||||||||
| Other comprehensive income (loss), net of taxes: |
||||||||||||||||||||
| Net unrealized gains (losses) on securities not other-than-temporarily impaired |
1,075 | 1,046 | 1,078 | (2,121 | ) | 1,078 | ||||||||||||||
| Net unrealized gains (losses) on other-than- temporarily impaired securities |
78 | 78 | 78 | (156 | ) | 78 | ||||||||||||||
| Derivatives qualifying as hedges |
(100 | ) | (100 | ) | (98 | ) | 198 | (100 | ) | |||||||||||
| Foreign currency translation and other adjustments |
102 | 81 | 126 | (183 | ) | 126 | ||||||||||||||
|
|
|
|
|
|
|
|
|
|
|
|||||||||||
| Total other comprehensive income (loss) |
1,155 | 1,105 | 1,184 | (2,262 | ) | 1,182 | ||||||||||||||
|
|
|
|
|
|
|
|
|
|
|
|||||||||||
| Total comprehensive income (loss) |
1,480 | 1,499 | 1,918 | (3,190 | ) | 1,707 | ||||||||||||||
| Less: comprehensive income attributable to noncontrolling interests |
— | — | 227 | — | 227 | |||||||||||||||
|
|
|
|
|
|
|
|
|
|
|
|||||||||||
| Total comprehensive income (loss) available to Genworth Financial, Inc.’s common stockholders |
$ | 1,480 | $ | 1,499 | $ | 1,691 | $ | (3,190 | ) | $ | 1,480 | |||||||||
|
|
|
|
|
|
|
|
|
|
|
|||||||||||
347
GENWORTH FINANCIAL, INC.
NOTES TO CONSOLIDATED FINANCIAL STATEMENTS
Years Ended December 31, 2013, 2012 and 2011
The following table presents the condensed consolidating comprehensive income statement information for the year ended December 31, 2011:
| (Amounts in millions) |
Parent Guarantor |
Issuer | All Other Subsidiaries |
Eliminations | Consolidated | |||||||||||||||
| Net income |
$ | 38 | $ | 549 | $ | 418 | $ | (828 | ) | $ | 177 | |||||||||
| Other comprehensive income (loss), net of taxes: |
||||||||||||||||||||
| Net unrealized gains (losses) on securities not other-than-temporarily impaired |
1,576 | 1,487 | 1,616 | (3,064 | ) | 1,615 | ||||||||||||||
| Net unrealized gains (losses) on other-than- temporarily impaired securities |
(11 | ) | (11 | ) | (10 | ) | 21 | (11 | ) | |||||||||||
| Derivatives qualifying as hedges |
1,085 | 1,085 | 1,080 | (2,165 | ) | 1,085 | ||||||||||||||
| Foreign currency translation and other adjustments |
(109 | ) | (162 | ) | (134 | ) | 270 | (135 | ) | |||||||||||
|
|
|
|
|
|
|
|
|
|
|
|||||||||||
| Total other comprehensive income (loss) |
2,541 | 2,399 | 2,552 | (4,938 | ) | 2,554 | ||||||||||||||
|
|
|
|
|
|
|
|
|
|
|
|||||||||||
| Total comprehensive income (loss) |
2,579 | 2,948 | 2,970 | (5,766 | ) | 2,731 | ||||||||||||||
| Less: comprehensive income attributable to noncontrolling interests |
— | — | 152 | — | 152 | |||||||||||||||
|
|
|
|
|
|
|
|
|
|
|
|||||||||||
| Total comprehensive income (loss) available to Genworth Financial, Inc.’s common stockholders |
$ | 2,579 | $ | 2,948 | $ | 2,818 | $ | (5,766 | ) | $ | 2,579 | |||||||||
|
|
|
|
|
|
|
|
|
|
|
|||||||||||
348
GENWORTH FINANCIAL, INC.
NOTES TO CONSOLIDATED FINANCIAL STATEMENTS
Years Ended December 31, 2013, 2012 and 2011
The following table presents the condensed consolidating cash flow statement information for the year ended December 31, 2013:
| (Amounts in millions) |
Parent Guarantor |
Issuer | All Other Subsidiaries |
Eliminations | Consolidated | |||||||||||||||
| Cash flows from operating activities: |
||||||||||||||||||||
| Net income |
$ | 560 | $ | 540 | $ | 1,017 | $ | (1,403 | ) | $ | 714 | |||||||||
| Less (income) loss from discontinued operations, net of taxes |
— | 29 | (17 | ) | — | 12 | ||||||||||||||
| Adjustments to reconcile net income to net cash from operating activities: |
||||||||||||||||||||
| Equity in earnings from subsidiaries |
(607 | ) | (796 | ) | — | 1,403 | — | |||||||||||||
| Dividends from subsidiaries |
535 | 376 | (497 | ) | (414 | ) | — | |||||||||||||
| Amortization of fixed maturity discounts and premiums and limited partnerships |
— | — | (97 | ) | — | (97 | ) | |||||||||||||
| Net investment losses (gains) |
— | (6 | ) | 43 | — | 37 | ||||||||||||||
| Charges assessed to policyholders |
— | — | (812 | ) | — | (812 | ) | |||||||||||||
| Acquisition costs deferred |
— | — | (457 | ) | — | (457 | ) | |||||||||||||
| Amortization of deferred acquisition costs and intangibles |
— | — | 569 | — | 569 | |||||||||||||||
| Deferred income taxes |
24 | (138 | ) | 35 | — | (79 | ) | |||||||||||||
| Net increase (decrease) in trading securities, held-for-sale investments and derivative instruments |
— | 1 | (60 | ) | — | (59 | ) | |||||||||||||
| Stock-based compensation expense |
26 | — | 15 | — | 41 | |||||||||||||||
| Change in certain assets and liabilities: |
||||||||||||||||||||
| Accrued investment income and other assets |
2 | 67 | (112 | ) | — | (43 | ) | |||||||||||||
| Insurance reserves |
— | — | 2,256 | — | 2,256 | |||||||||||||||
| Current tax liabilities |
3 | 45 | 240 | — | 288 | |||||||||||||||
| Other liabilities and other policy-related balances |
(4 | ) | (11 | ) | (1,024 | ) | — | (1,039 | ) | |||||||||||
| Cash from operating activities—discontinued operations |
— | — | 68 | — | 68 | |||||||||||||||
|
|
|
|
|
|
|
|
|
|
|
|||||||||||
| Net cash from operating activities |
539 | 107 | 1,167 | (414 | ) | 1,399 | ||||||||||||||
|
|
|
|
|
|
|
|
|
|
|
|||||||||||
| Cash flows from investing activities: |
||||||||||||||||||||
| Proceeds from maturities and repayments of investments: |
||||||||||||||||||||
| Fixed maturity securities |
— | — | 5,040 | — | 5,040 | |||||||||||||||
| Commercial mortgage loans |
— | — | 896 | — | 896 | |||||||||||||||
| Restricted commercial mortgage loans related to securitization entities |
— | — | 60 | — | 60 | |||||||||||||||
| Proceeds from sales of investments: |
||||||||||||||||||||
| Fixed maturity and equity securities |
— | 150 | 4,286 | — | 4,436 | |||||||||||||||
| Purchases and originations of investments: |
||||||||||||||||||||
| Fixed maturity and equity securities |
— | (150 | ) | (10,655 | ) | — | (10,805 | ) | ||||||||||||
| Commercial mortgage loans |
— | — | (873 | ) | — | (873 | ) | |||||||||||||
| Other invested assets, net |
— | — | 89 | — | 89 | |||||||||||||||
| Policy loans, net |
— | — | 242 | — | 242 | |||||||||||||||
| Intercompany notes receivable |
(8 | ) | (3 | ) | 95 | (84 | ) | — | ||||||||||||
| Capital contributions to subsidiaries |
(531 | ) | (1 | ) | 532 | — | — | |||||||||||||
| Proceeds from sale of a subsidiary, net of cash transferred |
— | 425 | (60 | ) | — | 365 | ||||||||||||||
| Cash from investing activities—discontinued operations |
— | (30 | ) | — | — | (30 | ) | |||||||||||||
|
|
|
|
|
|
|
|
|
|
|
|||||||||||
| Net cash from investing activities |
(539 | ) | 391 | (348 | ) | (84 | ) | (580 | ) | |||||||||||
|
|
|
|
|
|
|
|
|
|
|
|||||||||||
| Cash flows from financing activities: |
||||||||||||||||||||
| Deposits to universal life and investment contracts |
— | — | 2,999 | — | 2,999 | |||||||||||||||
| Withdrawals from universal life and investment contracts |
— | — | (3,269 | ) | — | (3,269 | ) | |||||||||||||
| Redemption and repurchase of non-recourse funding obligations |
— | — | (28 | ) | — | (28 | ) | |||||||||||||
| Proceeds from the issuance of long-term debt |
— | 793 | — | — | 793 | |||||||||||||||
| Repayment and repurchase of long-term debt |
— | (365 | ) | — | — | (365 | ) | |||||||||||||
| Repayment of borrowings related to securitization entities |
— | — | (108 | ) | — | (108 | ) | |||||||||||||
| Proceeds from intercompany notes payable |
— | (87 | ) | 3 | 84 | — | ||||||||||||||
| Repurchase of subsidiary shares |
— | — | (43 | ) | — | (43 | ) | |||||||||||||
| Dividends paid to noncontrolling interests |
— | — | (52 | ) | — | (52 | ) | |||||||||||||
| Dividends paid to parent |
— | (414 | ) | — | 414 | — | ||||||||||||||
| Other, net |
— | (49 | ) | (24 | ) | — | (73 | ) | ||||||||||||
| Cash from financing activities—discontinued operations |
— | — | (3 | ) | — | (3 | ) | |||||||||||||
|
|
|
|
|
|
|
|
|
|
|
|||||||||||
| Net cash from financing activities |
— | (122 | ) | (525 | ) | 498 | (149 | ) | ||||||||||||
| Effect of exchange rate changes on cash and cash equivalents |
— | — | (109 | ) | — | (109 | ) | |||||||||||||
|
|
|
|
|
|
|
|
|
|
|
|||||||||||
| Net change in cash and cash equivalents |
— | 376 | 185 | — | 561 | |||||||||||||||
| Cash and cash equivalents at beginning of period |
— | 843 | 2,810 | — | 3,653 | |||||||||||||||
|
|
|
|
|
|
|
|
|
|
|
|||||||||||
| Cash and cash equivalents at end of period |
— | 1,219 | 2,995 | — | 4,214 | |||||||||||||||
| Less cash and cash equivalents of discontinued operations at end of period |
— | — | — | — | — | |||||||||||||||
|
|
|
|
|
|
|
|
|
|
|
|||||||||||
| Cash and cash equivalents of continuing operations at end of period |
$ | — | $ | 1,219 | $ | 2,995 | $ | — | $ | 4,214 | ||||||||||
|
|
|
|
|
|
|
|
|
|
|
|||||||||||
349
GENWORTH FINANCIAL, INC.
NOTES TO CONSOLIDATED FINANCIAL STATEMENTS
Years Ended December 31, 2013, 2012 and 2011
The following table presents the condensed consolidating cash flow statement information for the year ended December 31, 2012:
| (Amounts in millions) |
Parent Guarantor |
Issuer | All Other Subsidiaries |
Eliminations | Consolidated | |||||||||||||||
| Cash flows from operating activities: |
||||||||||||||||||||
| Net income |
$ | 325 | $ | 394 | $ | 734 | $ | (928 | ) | $ | 525 | |||||||||
| Less income from discontinued operations, net of taxes |
— | — | (57 | ) | — | (57 | ) | |||||||||||||
| Adjustments to reconcile net income to net cash from operating activities: |
||||||||||||||||||||
| Equity in earnings from subsidiaries |
(329 | ) | (636 | ) | 38 | 927 | — | |||||||||||||
| Dividends from subsidiaries |
— | 545 | (545 | ) | — | — | ||||||||||||||
| Amortization of fixed maturity discounts and premiums and limited partnerships |
— | — | (88 | ) | — | (88 | ) | |||||||||||||
| Net investment losses (gains) |
— | 29 | (56 | ) | — | (27 | ) | |||||||||||||
| Charges assessed to policyholders |
— | — | (801 | ) | — | (801 | ) | |||||||||||||
| Acquisition costs deferred |
— | — | (611 | ) | — | (611 | ) | |||||||||||||
| Amortization of deferred acquisition costs and intangibles |
— | — | 722 | — | 722 | |||||||||||||||
| Goodwill impairment |
— | — | 89 | — | 89 | |||||||||||||||
| Deferred income taxes |
(3 | ) | (274 | ) | 359 | — | 82 | |||||||||||||
| Net increase (decrease) in trading securities, held-for-sale investments and derivative instruments |
— | (27 | ) | 218 | — | 191 | ||||||||||||||
| Stock-based compensation expense |
7 | 16 | 3 | — | 26 | |||||||||||||||
| Change in certain assets and liabilities: |
||||||||||||||||||||
| Accrued investment income and other assets |
— | 53 | (122 | ) | 1 | (68 | ) | |||||||||||||
| Insurance reserves |
— | — | 2,330 | — | 2,330 | |||||||||||||||
| Current tax liabilities |
— | (43 | ) | (191 | ) | — | (234 | ) | ||||||||||||
| Other liabilities and other policy-related balances |
— | 10 | (1,181 | ) | 5 | (1,166 | ) | |||||||||||||
| Cash from operating activities—discontinued operations |
— | — | 49 | — | 49 | |||||||||||||||
|
|
|
|
|
|
|
|
|
|
|
|||||||||||
| Net cash from operating activities |
— | 67 | 890 | 5 | 962 | |||||||||||||||
|
|
|
|
|
|
|
|
|
|
|
|||||||||||
| Cash flows from investing activities: |
||||||||||||||||||||
| Proceeds from maturities and repayments of investments: |
||||||||||||||||||||
| Fixed maturity securities |
— | — | 5,176 | — | 5,176 | |||||||||||||||
| Commercial mortgage loans |
— | — | 891 | — | 891 | |||||||||||||||
| Restricted commercial mortgage loans related to securitization entities |
— | — | 67 | — | 67 | |||||||||||||||
| Proceeds from sales of investments: |
||||||||||||||||||||
| Fixed maturity and equity securities |
— | 10 | 5,725 | — | 5,735 | |||||||||||||||
| Purchases and originations of investments: |
||||||||||||||||||||
| Fixed maturity and equity securities |
— | (150 | ) | (12,172 | ) | — | (12,322 | ) | ||||||||||||
| Commercial mortgage loans |
— | — | (692 | ) | — | (692 | ) | |||||||||||||
| Other invested assets, net |
— | 30 | 391 | (5 | ) | 416 | ||||||||||||||
| Policy loans, net |
— | — | (29 | ) | — | (29 | ) | |||||||||||||
| Intercompany notes receivable |
— | (31 | ) | (58 | ) | 89 | — | |||||||||||||
| Capital contributions to subsidiaries |
— | (20 | ) | 20 | — | — | ||||||||||||||
| Proceeds from sale of a subsidiary, net of cash transferred |
— | — | 77 | — | 77 | |||||||||||||||
| Cash from investing activities—discontinued operations |
— | (18 | ) | (23 | ) | — | (41 | ) | ||||||||||||
|
|
|
|
|
|
|
|
|
|
|
|||||||||||
| Net cash from investing activities |
— | (179 | ) | (627 | ) | 84 | (722 | ) | ||||||||||||
|
|
|
|
|
|
|
|
|
|
|
|||||||||||
| Cash flows from financing activities: |
||||||||||||||||||||
| Deposits to universal life and investment contracts |
— | — | 2,810 | — | 2,810 | |||||||||||||||
| Withdrawals from universal life and investment contracts |
— | — | (2,781 | ) | — | (2,781 | ) | |||||||||||||
| Redemption and repurchase of non-recourse funding obligations |
— | — | (1,056 | ) | — | (1,056 | ) | |||||||||||||
| Proceeds from the issuance of long-term debt |
— | 361 | — | — | 361 | |||||||||||||||
| Repayment and repurchase of long-term debt |
— | (322 | ) | — | — | (322 | ) | |||||||||||||
| Repayment of borrowings related to securitization entities |
— | — | (72 | ) | — | (72 | ) | |||||||||||||
| Proceeds from intercompany notes payable |
— | 58 | 31 | (89 | ) | — | ||||||||||||||
| Dividends paid to noncontrolling interests |
— | — | (50 | ) | — | (50 | ) | |||||||||||||
| Other, net |
— | (49 | ) | 103 | — | 54 | ||||||||||||||
| Cash from financing activities—discontinued operations |
— | — | (45 | ) | — | (45 | ) | |||||||||||||
|
|
|
|
|
|
|
|
|
|
|
|||||||||||
| Net cash from financing activities |
— | 48 | (1,060 | ) | (89 | ) | (1,101 | ) | ||||||||||||
| Effect of exchange rate changes on cash and cash equivalents |
— | — | 26 | — | 26 | |||||||||||||||
|
|
|
|
|
|
|
|
|
|
|
|||||||||||
| Net change in cash and cash equivalents |
— | (64 | ) | (771 | ) | — | (835 | ) | ||||||||||||
| Cash and cash equivalents at beginning of period |
— | 907 | 3,581 | — | 4,488 | |||||||||||||||
|
|
|
|
|
|
|
|
|
|
|
|||||||||||
| Cash and cash equivalents at end of period |
— | 843 | 2,810 | — | 3,653 | |||||||||||||||
| Less cash and cash equivalents of discontinued operations at end of period |
— | — | 21 | — | 21 | |||||||||||||||
|
|
|
|
|
|
|
|
|
|
|
|||||||||||
| Cash and cash equivalents of continuing operations at end of period |
$ | — | $ | 843 | $ | 2,789 | $ | — | $ | 3,632 | ||||||||||
|
|
|
|
|
|
|
|
|
|
|
|||||||||||
350
GENWORTH FINANCIAL, INC.
NOTES TO CONSOLIDATED FINANCIAL STATEMENTS
Years Ended December 31, 2013, 2012 and 2011
The following table presents the condensed consolidating cash flow statement information for the year ended December 31, 2011:
| (Amounts in millions) |
Parent Guarantor |
Issuer | All Other Subsidiaries |
Eliminations | Consolidated | |||||||||||||||
| Cash flows from operating activities: |
||||||||||||||||||||
| Net income |
$ | 38 | $ | 549 | $ | 418 | $ | (828 | ) | $ | 177 | |||||||||
| Less income from discontinued operations, net of taxes |
— | — | (36 | ) | — | (36 | ) | |||||||||||||
| Adjustments to reconcile net income to net cash from operating activities: |
||||||||||||||||||||
| Equity in earnings from subsidiaries |
(59 | ) | (769 | ) | — | 828 | — | |||||||||||||
| Dividends from subsidiaries |
— | 478 | (478 | ) | — | — | ||||||||||||||
| Amortization of fixed maturity discounts and premiums and limited partnerships |
— | — | (77 | ) | — | (77 | ) | |||||||||||||
| Net investment losses (gains) |
— | 18 | 177 | — | 195 | |||||||||||||||
| Charges assessed to policyholders |
— | — | (690 | ) | — | (690 | ) | |||||||||||||
| Acquisition costs deferred |
— | — | (637 | ) | — | (637 | ) | |||||||||||||
| Amortization of deferred acquisition costs and intangibles |
— | — | 593 | — | 593 | |||||||||||||||
| Goodwill impairment |
— | — | 29 | — | 29 | |||||||||||||||
| Deferred income taxes |
(11 | ) | (115 | ) | (224 | ) | — | (350 | ) | |||||||||||
| Gain on sale of subsidiary |
— | — | (36 | ) | — | (36 | ) | |||||||||||||
| Net increase (decrease) in trading securities, held-for-sale investments and derivative instruments |
— | (47 | ) | 1,498 | — | 1,451 | ||||||||||||||
| Stock-based compensation expense |
32 | — | (1 | ) | — | 31 | ||||||||||||||
| Change in certain assets and liabilities: |
||||||||||||||||||||
| Accrued investment income and other assets |
— | 28 | (203 | ) | 1 | (174 | ) | |||||||||||||
| Insurance reserves |
— | — | 2,507 | — | 2,507 | |||||||||||||||
| Current tax liabilities |
— | 22 | 123 | — | 145 | |||||||||||||||
| Other liabilities and other policy-related balances |
— | 62 | (151 | ) | 16 | (73 | ) | |||||||||||||
| Cash from operating activities—discontinued operations |
— | — | 70 | — | 70 | |||||||||||||||
|
|
|
|
|
|
|
|
|
|
|
|||||||||||
| Net cash from operating activities |
— | 226 | 2,882 | 17 | 3,125 | |||||||||||||||
|
|
|
|
|
|
|
|
|
|
|
|||||||||||
| Cash flows from investing activities: |
||||||||||||||||||||
| Proceeds from maturities and repayments of investments: |
||||||||||||||||||||
| Fixed maturity securities |
— | — | 5,233 | — | 5,233 | |||||||||||||||
| Commercial mortgage loans |
— | — | 912 | — | 912 | |||||||||||||||
| Restricted commercial mortgage loans related to securitization entities |
— | — | 96 | — | 96 | |||||||||||||||
| Proceeds from sales of investments: |
||||||||||||||||||||
| Fixed maturity and equity securities |
— | 201 | 6,083 | — | 6,284 | |||||||||||||||
| Purchases and originations of investments: |
||||||||||||||||||||
| Fixed maturity and equity securities |
— | (10 | ) | (11,875 | ) | — | (11,885 | ) | ||||||||||||
| Commercial mortgage loans |
— | — | (300 | ) | — | (300 | ) | |||||||||||||
| Other invested assets, net |
— | (30 | ) | (482 | ) | (17 | ) | (529 | ) | |||||||||||
| Policy loans, net |
— | — | (79 | ) | — | (79 | ) | |||||||||||||
| Intercompany notes receivable |
— | (66 | ) | 13 | 53 | — | ||||||||||||||
| Capital contributions to subsidiaries |
— | (15 | ) | 15 | — | — | ||||||||||||||
| Proceeds from sale of a subsidiary, net of cash transferred |
— | — | 211 | — | 211 | |||||||||||||||
| Payments for businesses purchased, net of cash acquired |
— | 2 | (5 | ) | — | (3 | ) | |||||||||||||
| Cash from investing activities—discontinued operations |
— | — | 1 | — | 1 | |||||||||||||||
|
|
|
|
|
|
|
|
|
|
|
|||||||||||
| Net cash from investing activities |
— | 82 | (177 | ) | 36 | (59 | ) | |||||||||||||
|
|
|
|
|
|
|
|
|
|
|
|||||||||||
| Cash flows from financing activities: |
||||||||||||||||||||
| Deposits to universal life and investment contracts |
— | — | 2,664 | — | 2,664 | |||||||||||||||
| Withdrawals from universal life and investment contracts |
— | — | (3,688 | ) | — | (3,688 | ) | |||||||||||||
| Redemption and repurchase of non-recourse funding obligations |
— | — | (130 | ) | — | (130 | ) | |||||||||||||
| Proceeds from the issuance of long-term debt |
— | 397 | 148 | — | 545 | |||||||||||||||
| Repayment and repurchase of long-term debt |
— | (760 | ) | — | — | (760 | ) | |||||||||||||
| Repayment of borrowings related to securitization entities |
— | — | (96 | ) | — | (96 | ) | |||||||||||||
| Proceeds from intercompany notes payable |
— | (13 | ) | 66 | (53 | ) | — | |||||||||||||
| Repurchase of subsidiary shares |
— | — | (71 | ) | — | (71 | ) | |||||||||||||
| Dividends paid to noncontrolling interests |
— | — | (67 | ) | — | (67 | ) | |||||||||||||
| Other, net |
— | 162 | (136 | ) | — | 26 | ||||||||||||||
| Cash from financing activities—discontinued operations |
— | — | (64 | ) | — | (64 | ) | |||||||||||||
|
|
|
|
|
|
|
|
|
|
|
|||||||||||
| Net cash from financing activities |
— | (214 | ) | (1,374 | ) | (53 | ) | (1,641 | ) | |||||||||||
| Effect of exchange rate changes on cash and cash equivalents |
— | — | (69 | ) | — | (69 | ) | |||||||||||||
|
|
|
|
|
|
|
|
|
|
|
|||||||||||
| Net change in cash and cash equivalents |
— | 94 | 1,262 | — | 1,356 | |||||||||||||||
| Cash and cash equivalents at beginning of period |
— | 813 | 2,319 | — | 3,132 | |||||||||||||||
|
|
|
|
|
|
|
|
|
|
|
|||||||||||
| Cash and cash equivalents at end of period |
— | 907 | 3,581 | — | 4,488 | |||||||||||||||
| Less cash and cash equivalents of discontinued operations at end of period |
— | — | 45 | — | 45 | |||||||||||||||
|
|
|
|
|
|
|
|
|
|
|
|||||||||||
| Cash and cash equivalents of continuing operations at end of period |
$ | — | $ | 907 | $ | 3,536 | $ | — | $ | 4,443 | ||||||||||
|
|
|
|
|
|
|
|
|
|
|
|||||||||||
351
GENWORTH FINANCIAL, INC.
NOTES TO CONSOLIDATED FINANCIAL STATEMENTS
Years Ended December 31, 2013, 2012 and 2011
Our insurance company subsidiaries are restricted by state and foreign laws and regulations as to the amount of dividends they may pay to their parent without regulatory approval in any year, the purpose of which is to protect affected insurance policyholders or contractholders, not stockholders. Any dividends in excess of limits are deemed “extraordinary” and require approval. Based on estimated statutory results as of December 31, 2013, in accordance with applicable dividend restrictions, our subsidiaries could pay dividends of approximately $1.0 billion to us in 2014 without obtaining regulatory approval, and the remaining net assets are considered restricted. While the $1.0 billion is unrestricted, we do not expect our insurance subsidiaries to pay dividends to us in 2014 at this level as they retain capital for growth and to meet capital requirements and desired thresholds. As of December 31, 2013, Genworth Financial’s and Genworth Holdings’ subsidiaries had restricted net assets of $13.4 billion and $13.9 billion, respectively.
352
Report of Independent Registered Public Accounting Firm
The Board of Directors and Stockholders
Genworth Financial, Inc.:
Under date of March 3, 2014, we reported on the consolidated balance sheets of Genworth Financial, Inc. (the Company) as of December 31, 2013 and 2012, and the related consolidated statements of income, comprehensive income, changes in stockholders’ equity, and cash flows for each of the years in the three-year period ended December 31, 2013, which are included herein. In connection with our audits of the aforementioned consolidated financial statements, we also audited the related financial statement schedules included herein. These financial statement schedules are the responsibility of the Company’s management. Our responsibility is to express an opinion on these financial statement schedules based on our audits.
In our opinion, such financial statement schedules, when considered in relation to the basic consolidated financial statements taken as a whole, present fairly, in all material respects, the information set forth therein.
/s/ KPMG LLP
Richmond, Virginia
March 3, 2014
353
Genworth Financial, Inc.
Summary of Investments—Other Than Investments in Related Parties
(Amounts in millions)
As of December 31, 2013, the amortized cost or cost, fair value and carrying value of our invested assets were as follows:
| Type of investment |
Amortized cost or cost |
Fair value |
Carrying value |
|||||||||
| Fixed maturity securities: |
||||||||||||
| Bonds: |
||||||||||||
| U.S. government, agencies and authorities |
$ | 4,710 | $ | 4,810 | $ | 4,810 | ||||||
| Tax-exempt |
324 | 295 | 295 | |||||||||
| Government—non-U.S. |
2,057 | 2,146 | 2,146 | |||||||||
| Public utilities |
4,026 | 4,330 | 4,330 | |||||||||
| All other corporate bonds |
45,192 | 47,048 | 47,048 | |||||||||
|
|
|
|
|
|
|
|||||||
| Total fixed maturity securities |
56,309 | 58,629 | 58,629 | |||||||||
| Equity securities |
318 | 341 | 341 | |||||||||
| Commercial mortgage loans |
5,899 | xxxxx | 5,899 | |||||||||
| Restricted commercial mortgage loans related to securitization entities |
233 | xxxxx | 233 | |||||||||
| Policy loans |
1,434 | xxxxx | 1,434 | |||||||||
| Other invested assets (1) |
1,232 | xxxxx | 1,686 | |||||||||
| Restricted other invested assets related to securitization entities |
391 | xxxxx | 391 | |||||||||
|
|
|
|
|
|
|
|||||||
| Total investments |
$ | 65,816 | xxxxx | $ | 68,613 | |||||||
|
|
|
|
|
|
|
|||||||
| (1) | The amount shown in the consolidated balance sheet for other invested assets differs from amortized cost or cost presented, as other invested assets include certain assets with a carrying amount that differs from amortized cost or cost. |
See Accompanying Report of Independent Registered Public Accounting Firm
354
Genworth Financial, Inc.
(Parent Company Only)
Balance Sheets
(Amounts in millions)
| December 31, | ||||||||
| 2013 | 2012 | |||||||
| Assets |
||||||||
| Investments in subsidiaries |
$ | 14,358 | $ | 16,429 | ||||
| Deferred tax asset |
26 | 64 | ||||||
| Other assets |
7 | 1 | ||||||
| Intercompany notes receivable |
8 | — | ||||||
|
|
|
|
|
|||||
| Total assets |
$ | 14,399 | $ | 16,494 | ||||
|
|
|
|
|
|||||
| Liabilities and stockholders’ equity |
||||||||
| Liabilities: |
||||||||
| Other liabilities |
$ | 6 | $ | 1 | ||||
|
|
|
|
|
|||||
| Total liabilities |
6 | 1 | ||||||
|
|
|
|
|
|||||
| Commitments and contingencies |
||||||||
| Stockholders’ equity: |
||||||||
| Common stock |
1 | 1 | ||||||
| Additional paid-in capital |
12,127 | 12,127 | ||||||
|
|
|
|
|
|||||
| Accumulated other comprehensive income (loss): |
||||||||
| Net unrealized investment gains (losses): |
||||||||
| Net unrealized gains (losses) on securities not other-than-temporarily impaired |
914 | 2,692 | ||||||
| Net unrealized gains (losses) on other-than-temporarily impaired securities |
12 | (54 | ) | |||||
|
|
|
|
|
|||||
| Net unrealized investment gains (losses) |
926 | 2,638 | ||||||
|
|
|
|
|
|||||
| Derivatives qualifying as hedges |
1,319 | 1,909 | ||||||
| Foreign currency translation and other adjustments |
297 | 655 | ||||||
|
|
|
|
|
|||||
| Total accumulated other comprehensive income (loss) |
2,542 | 5,202 | ||||||
| Retained earnings |
2,423 | 1,863 | ||||||
| Treasury stock, at cost |
(2,700 | ) | (2,700 | ) | ||||
|
|
|
|
|
|||||
| Total Genworth Financial, Inc.’s stockholders’ equity |
14,393 | 16,493 | ||||||
|
|
|
|
|
|||||
| Total liabilities and stockholders’ equity |
$ | 14,399 | $ | 16,494 | ||||
|
|
|
|
|
|||||
See Notes to Schedule II
See Accompanying Report of Independent Registered Public Accounting Firm
355
Schedule II
Genworth Financial, Inc.
(Parent Company Only)
Statements of Income
(Amounts in millions)
| Years ended December 31, | ||||||||||||
| 2013 | 2012 | 2011 | ||||||||||
| Revenues: |
||||||||||||
| Net investment income |
$ | (1 | ) | $ | — | $ | — | |||||
|
|
|
|
|
|
|
|||||||
| Total revenues |
(1 | ) | — | — | ||||||||
|
|
|
|
|
|
|
|||||||
| Benefits and expenses: |
||||||||||||
| Acquisition and operating expenses, net of deferrals |
33 | 7 | 32 | |||||||||
|
|
|
|
|
|
|
|||||||
| Total benefits and expenses |
33 | 7 | 32 | |||||||||
|
|
|
|
|
|
|
|||||||
| Loss before income taxes and equity in income of subsidiaries |
(34 | ) | (7 | ) | (32 | ) | ||||||
| Provision (benefit) from income taxes |
13 | (3 | ) | (11 | ) | |||||||
| Equity in income of subsidiaries |
607 | 329 | 59 | |||||||||
|
|
|
|
|
|
|
|||||||
| Net income available to Genworth Financial, Inc.’s common stockholders |
$ | 560 | $ | 325 | $ | 38 | ||||||
|
|
|
|
|
|
|
|||||||
See Notes to Schedule II
See Accompanying Report of Independent Registered Public Accounting Firm
356
Schedule II
Genworth Financial, Inc.
(Parent Company Only)
Statements of Comprehensive Income
(Amounts in millions)
| Years ended December 31, | ||||||||||||
| 2013 | 2012 | 2011 | ||||||||||
| Net income available to Genworth Financial, Inc.’s common stockholders |
$ | 560 | $ | 325 | $ | 38 | ||||||
| Other comprehensive income (loss), net of taxes: |
||||||||||||
| Net unrealized gains (losses) on securities not other-than-temporarily impaired |
(1,778 | ) | 1,075 | 1,576 | ||||||||
| Net unrealized gains (losses) on other-than-temporarily impaired securities |
66 | 78 | (11 | ) | ||||||||
| Derivatives qualifying as hedges |
(590 | ) | (100 | ) | 1,085 | |||||||
| Foreign currency translation and other adjustments |
(358 | ) | 102 | (109 | ) | |||||||
|
|
|
|
|
|
|
|||||||
| Total other comprehensive income (loss) |
(2,660 | ) | 1,155 | 2,541 | ||||||||
|
|
|
|
|
|
|
|||||||
| Total comprehensive income (loss) available to Genworth Financial, Inc.’s common stockholders |
$ | (2,100 | ) | $ | 1,480 | $ | 2,579 | |||||
|
|
|
|
|
|
|
|||||||
See Notes to Schedule II
See Accompanying Report of Independent Registered Public Accounting Firm
357
Schedule II
Genworth Financial, Inc.
(Parent Company Only)
Statements of Cash Flows
(Amounts in millions)
| Years ended December 31, | ||||||||||||
| 2013 | 2012 | 2011 | ||||||||||
| Cash flows from operating activities: |
||||||||||||
| Net income available to Genworth Financial, Inc.’s common stockholders |
$ | 560 | $ | 325 | $ | 38 | ||||||
| Adjustments to reconcile net income available to Genworth Financial, Inc.’s common stockholders to net cash from operating activities: |
||||||||||||
| Equity in income from subsidiaries |
(607 | ) | (329 | ) | (59 | ) | ||||||
| Dividends from subsidiaries |
535 | — | — | |||||||||
| Deferred income taxes |
24 | (3 | ) | (11 | ) | |||||||
| Stock-based compensation expense |
26 | 7 | 32 | |||||||||
| Change in certain assets and liabilities: |
||||||||||||
| Accrued investment income and other assets |
2 | — | — | |||||||||
| Current tax liabilities |
3 | — | — | |||||||||
| Other liabilities and other policy-related balances |
(4 | ) | — | — | ||||||||
|
|
|
|
|
|
|
|||||||
| Net cash from operating activities |
539 | — | — | |||||||||
|
|
|
|
|
|
|
|||||||
| Cash flows from investing activities: |
||||||||||||
| Intercompany notes receivable |
(8 | ) | — | — | ||||||||
| Capital contribution paid to subsidiaries |
(531 | ) | — | — | ||||||||
|
|
|
|
|
|
|
|||||||
| Net cash from investing activities |
(539 | ) | — | — | ||||||||
|
|
|
|
|
|
|
|||||||
| Net change in cash and cash equivalents |
— | — | — | |||||||||
| Cash and cash equivalents at beginning of year |
— | — | — | |||||||||
|
|
|
|
|
|
|
|||||||
| Cash and cash equivalents at end of year |
$ | — | $ | — | $ | — | ||||||
|
|
|
|
|
|
|
|||||||
See Notes to Schedule II
See Accompanying Report of Independent Registered Public Accounting Firm
358
Schedule II
Genworth Financial, Inc.
(Parent Company Only)
Notes to Schedule II
Years Ended December 31, 2013, 2012 and 2011
(1) Organization and Purpose
Genworth Holdings, Inc. (“Genworth Holdings”) (formerly known as Genworth Financial, Inc.) was incorporated in Delaware in 2003 in preparation for an initial public offering (“IPO”) of Genworth common stock, which was completed on May 28, 2004. On April 1, 2013, Genworth Holdings completed a holding company reorganization pursuant to which Genworth Holdings became a direct, 100% owned subsidiary of a new public holding company that it had formed. The new public holding company was incorporated in Delaware on December 5, 2012, in connection with the reorganization, under the name Sub XLVI, Inc., and was renamed Genworth Financial, Inc. (“Genworth Financial”) upon the completion of the reorganization.
To implement the reorganization, Genworth Holdings formed Genworth Financial and Genworth Financial, in turn, formed Sub XLII, Inc. (“Merger Sub”). The holding company structure was implemented pursuant to Section 251(g) of the General Corporation Law of the State of Delaware (“DGCL”) by the merger of Merger Sub with and into Genworth Holdings (the “Merger”). Genworth Holdings survived the Merger as a direct, 100% owned subsidiary of Genworth Financial and each share of Genworth Holdings Class A Common Stock, par value $0.001 per share (“Genworth Holdings Class A Common Stock”), issued and outstanding immediately prior to the Merger and each share of Genworth Holdings Class A Common Stock held in the treasury of Genworth Holdings immediately prior to the Merger converted into one issued and outstanding or treasury, as applicable, share of Genworth Financial Class A Common Stock, par value $0.001 per share, having the same designations, rights, powers and preferences and the qualifications, limitations and restrictions as the Genworth Holdings Class A Common Stock being converted.
Immediately after the consummation of the Merger, Genworth Financial had the same authorized, outstanding and treasury capital stock as Genworth Holdings immediately prior to the Merger. Each share of Genworth Financial common stock outstanding immediately prior to the Merger was cancelled. Effective upon the consummation of the Merger, Genworth Financial adopted an amended and restated certificate of incorporation and amended and restated bylaws that were identical to those of Genworth Holdings immediately prior to the consummation of the Merger (other than provisions regarding certain technical matters, as permitted by Section 251(g) of the DGCL). Genworth Financial’s directors and executive officers immediately after the consummation of the Merger were the same as the directors and executive officers of Genworth Holdings immediately prior to the consummation of the Merger. Immediately after the consummation of the Merger, Genworth Financial had, on a consolidated basis, the same assets, businesses and operations as Genworth Holdings had immediately prior to the consummation of the Merger.
On April 1, 2013, in connection with the reorganization, immediately following the consummation of the Merger, Genworth Holdings distributed to Genworth Financial (as its sole stockholder), through a dividend (the “Distribution”), the 84.6% membership interest in one of its subsidiaries (Genworth Mortgage Holdings, LLC (“GMHL”)) that it held directly, and 100% of the shares of another of its subsidiaries (Genworth Mortgage Holdings, Inc. (“GMHI”)), that held the remaining 15.4% of outstanding membership interests of GMHL. At the time of the Distribution, GMHL and GMHI together owned (directly or indirectly) 100% of the shares or other equity interests of all of the subsidiaries that conducted Genworth Holdings’ U.S. mortgage insurance business (these subsidiaries also owned the subsidiaries that conducted Genworth Holdings’ European mortgage insurance business). As part of the comprehensive U.S. mortgage insurance capital plan, on April 1, 2013, immediately prior to the Distribution, Genworth Holdings contributed $100 million to the U.S. mortgage insurance subsidiaries.
359
Schedule II
Genworth Financial, Inc.
(Parent Company Only)
Notes to Schedule II
Years Ended December 31, 2013, 2012 and 2011
The financial information contained herein has been prepared as if the reorganization occurred on January 1, 2011.
Genworth Financial is a holding company whose subsidiaries provide life, long-term care and mortgage insurance, as well as annuities and other investment products.
(2) Commitments
On April 1, 2013, in connection with the reorganization: (a) Genworth Financial provided a full and unconditional guarantee to the trustee of Genworth Holdings’ outstanding senior notes and the holders of the senior notes, on an unsecured unsubordinated basis, of the full and punctual payment of the principal of, premium, if any and interest on, and all other amounts payable under, each outstanding series of senior notes, and the full and punctual payment of all other amounts payable by Genworth Holdings under the senior notes indenture in respect of such senior notes and (b) Genworth Financial provided a full and unconditional guarantee to the trustee of Genworth Holdings’ outstanding subordinated notes and the holders of the subordinated notes, on an unsecured subordinated basis, of the full and punctual payment of the principal of, premium, if any and interest on, and all other amounts payable under, the outstanding subordinated notes, and the full and punctual payment of all other amounts payable by Genworth Holdings under the subordinated notes indenture in respect of the subordinated notes. In connection with the reorganization on April 1, 2013, Genworth Financial also provided a full and unconditional guarantee of Genworth Holdings’ obligations associated with Rivermont Insurance Company and the Tax Matters Agreement.
The obligations under Genworth Holdings’ credit agreement are unsecured and payment of Genworth Holdings’ obligations is fully and unconditionally guaranteed by Genworth Financial.
(3) Income Taxes
As of December 31, 2013 and 2012, Genworth Financial had a deferred tax asset of $26 million and $64 million, respectively, primarily comprised of share-based compensation. These amounts are undiscounted pursuant to the applicable rules governing deferred taxes. Genworth Financial’s current income tax payable was $6 million as of December 31, 2013. Net cash received for taxes was $5 million for the year ended December 31, 2013.
360
Genworth Financial, Inc.
Supplemental Insurance Information
(Amounts in millions)
| Segment |
Deferred Acquisition Costs |
Future Policy Benefits |
Policyholder Account Balances |
Liability for Policy and Contract Claims |
Unearned Premiums |
|||||||||||||||
| December 31, 2013 |
||||||||||||||||||||
| U.S. Life Insurance |
$ | 4,537 | $ | 33,700 | $ | 22,210 | $ | 5,216 | $ | 632 | ||||||||||
| International Mortgage Insurance |
152 | — | — | 378 | 2,815 | |||||||||||||||
| U.S. Mortgage Insurance |
12 | — | — | 1,482 | 129 | |||||||||||||||
| International Protection |
243 | — | 16 | 108 | 522 | |||||||||||||||
| Runoff |
334 | 5 | 3,302 | 20 | 9 | |||||||||||||||
| Corporate and Other |
— | — | — | — | — | |||||||||||||||
|
|
|
|
|
|
|
|
|
|
|
|||||||||||
| Total |
$ | 5,278 | $ | 33,705 | $ | 25,528 | $ | 7,204 | $ | 4,107 | ||||||||||
|
|
|
|
|
|
|
|
|
|
|
|||||||||||
| December 31, 2012 |
||||||||||||||||||||
| U.S. Life Insurance |
$ | 4,300 | $ | 33,499 | $ | 21,454 | $ | 4,857 | $ | 617 | ||||||||||
| International Mortgage Insurance |
161 | — | — | 516 | 3,051 | |||||||||||||||
| U.S. Mortgage Insurance |
10 | — | — | 2,009 | 116 | |||||||||||||||
| International Protection |
242 | — | 16 | 106 | 539 | |||||||||||||||
| Runoff |
323 | 6 | 4,792 | 21 | 10 | |||||||||||||||
| Corporate and Other |
— | — | — | — | — | |||||||||||||||
|
|
|
|
|
|
|
|
|
|
|
|||||||||||
| Total |
$ | 5,036 | $ | 33,505 | $ | 26,262 | $ | 7,509 | $ | 4,333 | ||||||||||
|
|
|
|
|
|
|
|
|
|
|
|||||||||||
See Accompanying Report of Independent Registered Public Accounting Firm
361
Schedule III—Continued
Genworth Financial, Inc.
Supplemental Insurance Information
(Amounts in millions)
| Segment |
Premium Revenue |
Net Investment Income |
Interest Credited and Benefits and Other Changes in Policy Reserves |
Amortization of Deferred Acquisition Costs |
Other Operating Expenses |
Premiums Written |
||||||||||||||||||
| December 31, 2013 |
||||||||||||||||||||||||
| U.S. Life Insurance |
$ | 2,957 | $ | 2,621 | $ | 4,594 | $ | 298 | $ | 841 | $ | 2,963 | ||||||||||||
| International Mortgage Insurance |
996 | 333 | 317 | 48 | 286 | 1,042 | ||||||||||||||||||
| U.S. Mortgage Insurance |
554 | 60 | 412 | 4 | 146 | 567 | ||||||||||||||||||
| International Protection |
636 | 119 | 159 | 97 | 484 | 608 | ||||||||||||||||||
| Runoff |
5 | 139 | 151 | 4 | 85 | 4 | ||||||||||||||||||
| Corporate and Other |
— | (1 | ) | — | — | 427 | — | |||||||||||||||||
|
|
|
|
|
|
|
|
|
|
|
|
|
|||||||||||||
| Total |
$ | 5,148 | $ | 3,271 | $ | 5,633 | $ | 451 | $ | 2,269 | $ | 5,184 | ||||||||||||
|
|
|
|
|
|
|
|
|
|
|
|
|
|||||||||||||
| December 31, 2012 |
||||||||||||||||||||||||
| U.S. Life Insurance |
$ | 2,789 | $ | 2,594 | $ | 4,593 | $ | 410 | $ | 830 | $ | 2,818 | ||||||||||||
| International Mortgage Insurance |
1,016 | 375 | 516 | 52 | 103 | 1,061 | ||||||||||||||||||
| U.S. Mortgage Insurance |
549 | 68 | 725 | 3 | 145 | 554 | ||||||||||||||||||
| International Protection |
682 | 131 | 150 | 106 | 624 | 619 | ||||||||||||||||||
| Runoff |
5 | 145 | 169 | 47 | 84 | 5 | ||||||||||||||||||
| Corporate and Other |
— | 30 | — | — | 477 | — | ||||||||||||||||||
|
|
|
|
|
|
|
|
|
|
|
|
|
|||||||||||||
| Total |
$ | 5,041 | $ | 3,343 | $ | 6,153 | $ | 618 | $ | 2,263 | $ | 5,057 | ||||||||||||
|
|
|
|
|
|
|
|
|
|
|
|
|
|||||||||||||
| December 31, 2011 |
||||||||||||||||||||||||
| U.S. Life Insurance |
$ | 2,979 | $ | 2,538 | $ | 4,448 | $ | 207 | $ | 930 | $ | 3,005 | ||||||||||||
| International Mortgage Insurance |
1,063 | 393 | 458 | 53 | 292 | 923 | ||||||||||||||||||
| U.S. Mortgage Insurance |
547 | 104 | 1,325 | 2 | 159 | 556 | ||||||||||||||||||
| International Protection |
839 | 173 | 135 | 136 | 635 | 735 | ||||||||||||||||||
| Runoff |
260 | 140 | 369 | 62 | 152 | 260 | ||||||||||||||||||
| Corporate and Other |
— | 32 | — | — | 430 | — | ||||||||||||||||||
|
|
|
|
|
|
|
|
|
|
|
|
|
|||||||||||||
| Total |
$ | 5,688 | $ | 3,380 | $ | 6,735 | $ | 460 | $ | 2,598 | $ | 5,479 | ||||||||||||
|
|
|
|
|
|
|
|
|
|
|
|
|
|||||||||||||
See Accompanying Report of Independent Registered Public Accounting Firm
362
| Item 9. | Changes In and Disagreements With Accountants On Accounting and Financial Disclosure |
None.
| Item 9A. | Controls and Procedures |
Evaluation of Disclosure Controls and Procedures
As of December 31, 2013, an evaluation was conducted under the supervision and with the participation of our management, including our Chief Executive Officer and Chief Financial Officer, of the effectiveness of our disclosure controls and procedures (as defined in Rules 13a-15(e) and 15d-15(e) under the Securities Exchange Act of 1934). Based on this evaluation, the Chief Executive Officer and the Chief Financial Officer concluded that our disclosure controls and procedures were effective as of December 31, 2013.
Management’s Annual Report On Internal Control Over Financial Reporting
Our management is responsible for establishing and maintaining adequate internal control over financial reporting for our company. With the participation of the Chief Executive Officer and the Chief Financial Officer, our management conducted an evaluation of the effectiveness of our internal control over financial reporting based on the framework and criteria established in Internal Control—Integrated Framework (1992), issued by the Committee of Sponsoring Organizations of the Treadway Commission. Based on this evaluation, our management has concluded that our internal control over financial reporting was effective as of December 31, 2013.
Our independent auditor, KPMG LLP, a registered public accounting firm, has issued an attestation report on the effectiveness of our internal control over financial reporting. This attestation report appears below.
| /s/ Thomas J. McInerney |
| Thomas J. McInerney |
| President and Chief Executive Officer |
| (Principal Executive Officer) |
| /s/ Martin P. Klein |
| Martin P. Klein |
| Executive Vice President and Chief Financial Officer |
| (Principal Financial Officer) |
March 3, 2014
363
Report of Independent Registered Public Accounting Firm
The Board of Directors and Stockholders
Genworth Financial, Inc.:
We have audited Genworth Financial, Inc.’s (the Company) internal control over financial reporting as of December 31, 2013, based on criteria established in Internal Control—Integrated Framework (1992) issued by the Committee of Sponsoring Organizations of the Treadway Commission (COSO). The Company’s management is responsible for maintaining effective internal control over financial reporting and for its assessment of the effectiveness of internal control over financial reporting, included in the accompanying Management’s Annual Report on Internal Control over Financial Reporting. Our responsibility is to express an opinion on the Company’s internal control over financial reporting based on our audit.
We conducted our audit in accordance with the standards of the Public Company Accounting Oversight Board (United States). Those standards require that we plan and perform the audit to obtain reasonable assurance about whether effective internal control over financial reporting was maintained in all material respects. Our audit included obtaining an understanding of internal control over financial reporting, assessing the risk that a material weakness exists, and testing and evaluating the design and operating effectiveness of internal control based on the assessed risk. Our audit also included performing such other procedures as we considered necessary in the circumstances. We believe that our audit provides a reasonable basis for our opinion.
A company’s internal control over financial reporting is a process designed to provide reasonable assurance regarding the reliability of financial reporting and the preparation of financial statements for external purposes in accordance with generally accepted accounting principles. A company’s internal control over financial reporting includes those policies and procedures that (1) pertain to the maintenance of records that, in reasonable detail, accurately and fairly reflect the transactions and dispositions of the assets of the company; (2) provide reasonable assurance that transactions are recorded as necessary to permit preparation of financial statements in accordance with generally accepted accounting principles, and that receipts and expenditures of the company are being made only in accordance with authorizations of management and directors of the company; and (3) provide reasonable assurance regarding prevention or timely detection of unauthorized acquisition, use, or disposition of the company’s assets that could have a material effect on the financial statements.
Because of its inherent limitations, internal control over financial reporting may not prevent or detect misstatements. Also, projections of any evaluation of effectiveness to future periods are subject to the risk that controls may become inadequate because of changes in conditions, or that the degree of compliance with the policies or procedures may deteriorate.
In our opinion, Genworth Financial, Inc. maintained, in all material respects, effective internal control over financial reporting as of December 31, 2013, based on criteria established in Internal Control—Integrated Framework (1992) issued by COSO.
We also have audited, in accordance with the standards of the Public Company Accounting Oversight Board (United States), the consolidated balance sheets of Genworth Financial, Inc. as of December 31, 2013 and 2012, and the related consolidated statements of income, comprehensive income, changes in stockholders’ equity, and cash flows for each of the years in the three-year period ended December 31, 2013, and our report dated March 3, 2014 expressed an unqualified opinion on those consolidated financial statements.
/s/ KPMG LLP
Richmond, Virginia
March 3, 2014
364
Changes in Internal Control Over Financial Reporting During the Quarter Ended December 31, 2013
There were no changes in our internal control over financial reporting that occurred during the quarter ended December 31, 2013 that have materially affected, or are reasonably likely to materially affect, our internal control over financial reporting.
| Item 9B. | Other Information |
None.
365
| Item 10. | Directors, Executive Officers and Corporate Governance |
The following table sets forth certain information concerning our directors and executive officers:
| Name |
Age | Positions | ||||
| Thomas J. McInerney |
57 | President and Chief Executive Officer, Director | ||||
| Martin P. Klein |
54 | Executive Vice President and Chief Financial Officer | ||||
| James R. Boyle |
54 | Executive Vice President—Genworth | ||||
| Kevin D. Schneider |
52 | Executive Vice President—Genworth | ||||
| Lori M. Evangel |
51 | Executive Vice President and Chief Risk Officer | ||||
| Michael S. Laming |
62 | Executive Vice President—Human Resources | ||||
| Leon E. Roday |
60 | Executive Vice President, General Counsel and Secretary | ||||
| Daniel J. Sheehan IV |
48 | Executive Vice President—Chief Investment Officer | ||||
| Scott J. McKay |
52 | Senior Vice President—Chief Information Officer | ||||
| William H. Bolinder |
70 | Director, member of Legal and Public Affairs and Nominating and Corporate Governance Committees | ||||
| G. Kent Conrad |
65 | Director, member of Legal and Public Affairs and Nominating and Corporate Governance Committees | ||||
| Melina E. Higgins |
46 | Director, member of Legal and Public Affairs Committee | ||||
| Nancy J. Karch |
66 | Director, member of Management Development and Compensation and Nominating and Corporate Governance Committees | ||||
| Christine B. Mead |
58 | Director, member of Audit and Management Development and Compensation Committees | ||||
| David M. Moffett |
62 | Director, member of Legal and Public Affairs and Nominating and Corporate Governance Committees | ||||
| Thomas E. Moloney |
70 | Director, member of Audit and Legal and Public Affairs Committees | ||||
| James A. Parke |
68 | Director, member of Audit and Management Development and Compensation Committees | ||||
| James S. Riepe |
70 | Non-Executive Chairman of the Board, member of Audit and Management Development and Compensation Committees | ||||
Executive Officers and Directors
The following sets forth certain biographical information with respect to our executive officers and directors listed above.
Thomas J. McInerney has been our President and Chief Executive Officer and a director since January 2013. Before joining our company, Mr. McInerney had served as a Senior Advisor to the Boston Consulting Group from June 2011 to December 2012, providing consulting and advisory services to leading insurance and financial services companies in the United States and Canada. Prior to that, Mr. McInerney spent 30 years working with ING Groep NV and Aetna Inc. From October 2009 to December 2010, Mr. McInerney was a member of ING Groep’s Management Board for Insurance, where he was the Chief Operating Officer for ING’s insurance and investment management businesses worldwide. From April 2006 to October 2009, he was the Chairman and Chief Executive Officer of ING Americas and a member of ING Groep’s Executive Board, where he led ING’s pension, retirement services, insurance and investment management businesses in the United States, Canada and seven countries in Latin America. From October 2001 to April 2006, he was the Chief Executive Officer of ING U.S. Financial Services, and from December 2000 to October 2001, he was Chief Executive Officer of ING U.S. Worksite Financial Services. In 2000, ING Groep acquired Aetna Financial Services, for which Mr. McInerney served as President from August 1997 to December 2000. Prior to that, he served in many
366
leadership positions with Aetna, where he began his career as an insurance underwriter in June 1978. During his career, Mr. McInerney has been active with the American Council of Life Insurers and the Financial Services Roundtable, having served on each association’s board and Chief Executive Officer Committee. Mr. McInerney received a B.A. in Economics from Colgate University and an M.B.A. from the Tuck School of Business at Dartmouth College.
Martin P. Klein has been our Executive Vice President and Chief Financial Officer and is also responsible for the International Protection segment as well as Corporate Development activities since February 2013. Prior to that, he was Senior Vice President—Chief Financial Officer from May 2011 to February 2013. From May 2012 through December 2012, he also served as Acting President and Acting Chief Executive Officer. Mr. Klein joined the Company in April 2011 as a Senior Vice President. Prior to joining the Company, Mr. Klein served as a Managing Director and Senior Relationship Manager of Barclays Capital, the investment banking division of Barclays Bank, PLC, after its acquisition of the U.S. investment banking and brokerage operations of Lehman Brothers Holdings, Inc. in 2008 until April 2011. From 2005 to 2008, Mr. Klein served as a Managing Director and the head of the Insurance and Pension Solutions Groups at Lehman Brothers, and from 2003 to 2005 served as a Managing Director and the head of the Insurance Solutions Group. From 2004 to 2006, Mr. Klein also served as the President of Lehman Re, a reinsurance subsidiary of Lehman Brothers. From 1998 to 2003, Mr. Klein was a Senior Vice President and Chief Insurance Strategist at Lehman Brothers. Prior thereto, Mr. Klein had been with Zurich Insurance Group, where he was a Managing Director of Zurich Investment Management from 1996 to 1998, and Managing Principal of Centre Chase Investment Advisors, an affiliate of Zurich, from 1994 to 1996. From 1992 to 1994, Mr. Klein was an Executive Vice President and Chief Financial Officer of ARM Financial Group, Inc., and from 1990 to 1992 was a Managing Director of the Capital Management Group of ICH Corporation. From 1983 to 1990, Mr. Klein was with Providian Corporation. Mr. Klein is a Fellow of the Society of Actuaries and a Chartered Financial Analyst. He received his B.A. in Mathematics and Business Administration from Hope College and a M.S. in Statistical and Actuarial Sciences from University of Iowa.
James R. Boyle has been our Executive Vice President—Genworth responsible for our U.S. Life Insurance Division since January 2014. Prior thereto he was President and CEO of John Hancock Financial Services Inc. from May 2009 until November 2012 with responsibilities over the U.S. Division which included life and long-term care insurance, annuities, mutual funds and retirement plans, and its independent broker-dealer network. Mr. Boyle also served as President of John Hancock Life Insurance from January 2007 until May 2009 and President of John Hancock Wealth Management from April 2004 to December 2007. Prior to that, Mr. Boyle was with Manulife Financial Corporation and served as its President, Annuities from July 1999 until April 2004 and held various roles during his tenure with Manulife which began in 1996, including Vice President, Investment Management Services and Vice President, Administration and Operations. Mr. Boyle was with North American Security Life Insurance Company serving in various positions from 1992 to 1996 (North American Security Life’s parent company, North American Life, was amalgamated into Manulife in 1996). Mr. Boyle began his career in 1982 with Coopers & Lybrand and is a Certified Public Accountant. He received a B.S. in Accounting from Boston College.
Kevin D. Schneider has been our Executive Vice President—Genworth responsible for our Global Mortgage Insurance Division since May 2012. Prior to that, he was Senior Vice President—Genworth responsible for our U.S. Mortgage Insurance segment from July 2008 to May 2012. Prior thereto, Mr. Schneider served as the President and Chief Executive Officer of our U.S. mortgage insurance business since the completion of our IPO in May 2004. Prior to the IPO, he was a Senior Vice President and Chief Commercial Officer of Genworth Mortgage Insurance Corporation since April 2003. From January 2003 to April 2003, Mr. Schneider was the Chief Quality Officer for GE Commercial Finance—Americas. From September 2001 to December 2002, he was a Quality Leader for GE Capital Corporate. From April 1998 to September 2001, Mr. Schneider was an Executive Vice President with GE Capital Rail Services. Prior thereto, he had been with GATX Corp. where he was a Vice President—Sales from November 1994 to April 1998 and a Regional Manager
367
from October 1992 to November 1994. From July 1984 to October 1992, Mr. Schneider was with Ryder System where he held various positions. Mr. Schneider received a B.S. degree in Industrial Labor Relations from Cornell University and an M.B.A. from the Kellogg Business School.
Lori M. Evangel has been our Executive Vice President and Chief Risk Officer since January 2014. Prior to joining the company, she was Managing Director and Chief Risk Officer, Global Investments for Aflac, Inc. from January 2013 to December 2013. From November 2008 through July 2012, Ms. Evangel served as Senior Vice President and Enterprise Risk Officer at MetLife, Inc., having served as Senior Vice President since joining MetLife in May 2007. Prior thereto, Ms. Evangel acted as Managing Director and Group Head, Portfolio Management and Market Risk for MBIA Insurance Corporation from July 2004 to April 2007 and served in multiple positions for MBIA prior to that time. Ms. Evangel began her career at Moody’s Investors Services in 1986. She received her B.A. in Political Science from Middlebury College in 1984 and her MBA in Finance from State University of New York in 1986.
Michael S. Laming has been our Executive Vice President—Human Resources since December 2013. Prior thereto, he served as our Senior Vice President—Human Resources since the completion of our IPO in May 2004. Prior to the IPO, he was a Senior Vice President of GE Insurance, a business unit of GE Capital, since August 2001 and a Vice President of GE since April 2003. From July 1996 to August 2001, Mr. Laming was a Senior Vice President at GE Financial Assurance Holdings, Inc. (“GEFAHI”) and its predecessor companies. Prior thereto, he held a broad range of human resource positions in operating units of GE and at GE corporate headquarters. He graduated from the GE Manufacturing Management Program. Mr. Laming received both a B.S. in Business Administration and a Masters of Organization Development from Bowling Green State University.
Leon E. Roday has been our Executive Vice President, General Counsel and Secretary since December 2013. Prior to that, he served as our Senior Vice President, General Counsel and Secretary since the completion of our IPO in May 2004. Prior to the IPO was Senior Vice President, General Counsel, Secretary and a director of GEFAHI and its predecessor companies since May 1996 and a Vice President of GE since November 2002. From October 1982 through May 1996, Mr. Roday was at the law firm of LeBoeuf, Lamb, Greene & MacRae, LLP, and he was a partner at that firm from 1991 to 1996. Mr. Roday received a B.A. in Political Science from the University of California at Santa Barbara and a J.D. from Brooklyn Law School. Mr. Roday is a member of the New York Bar and the Virginia Bar.
Daniel J. Sheehan IV has been our Executive Vice President—Chief Investment Officer since December 2013. Prior to that, he served as our Senior Vice President—Chief Investment Officer since April 2012. From January 2009 to April 2012, he served as our Vice President with responsibilities that included oversight of the Company’s insurance investment portfolios. From January 2008 through December 2008, Mr. Sheehan had management responsibilities of the Company’s portfolio management team, including fixed-income trading. From December 1997 through December 2007, Mr. Sheehan served in various capacities with the Company and/or its predecessor including roles with oversight responsibilities for the investments real estate team, as risk manager of the insurance portfolios and as risk manager of the portfolio management team. Prior to joining our Company, Mr. Sheehan had been with Sun Life of Canada from 1993 to 1997 as a Property Investment Officer in the Real Estate Investments group. Prior thereto, he was with Massachusetts Laborers Benefit Fund from 1987 to 1993, as an auditor and auditing supervisor. Mr. Sheehan graduated from Harvard University with a BA in Economics and later received an MBA in Finance from Babson College.
Scott J. McKay has been our Senior Vice President—Chief Information Officer since January 2009 and leader of Business and Product Strategy for the U.S. Life Insurance segment since March 2013. He had served as our Senior Vice President—Operations & Quality and Chief Information Officer from August 2004 to December 2008. Prior thereto, he was Senior Vice President—Operations & Quality since the completion of our IPO in May 2004 to August 2004. Prior to the IPO, he was the Senior Vice President, Operations & Quality of GEFAHI since December 2002. From July 1993 to December 2002, Mr. McKay served in various information technology related positions at GEFAHI’s subsidiaries, including Chief Technology Officer, and Chief Information Officer of Federal Home Life Assurance Company. Prior thereto, he was Officer and Director of Applications for United
368
Pacific Life Insurance Company from July 1992 to July 1993, and an IT consultant for Sycomm Systems and Data Executives, Inc. from January 1985 to July 1992. Mr. McKay received a B.S. in Computer Science from West Chester University of Pennsylvania.
William H. Bolinder has served as a member of our board of directors since October 2010. Mr. Bolinder retired in June 2006 from serving as President, Chief Executive Officer and a director of Acadia Trust N.A., positions he had held since 2003. He had previously been a member of the Group Management Board for Zurich Financial Services Group from 1994 to 2002. Mr. Bolinder joined Zurich American Insurance Company, USA in 1986 as Chief Operating Officer and became Chief Executive Officer in 1987. He has been a director of Endurance Specialty Holdings Ltd. since December 2001 and became the Lead Director of the Board in May 2013 (having served as the non-executive Chairman of the Board from March 2011 to May 2013). Mr. Bolinder also previously served as a director of Quanta Capital Holding Ltd. from January 2007 to October 2008. Mr. Bolinder has also served on the board of the American Insurance Association, American Institute for Chartered Property Casualty Underwriting, Insurance Institute for Applied Ethics, Insurance Institute of America, Insurance Services Office, Inc. and the National Association of Independent Insurers. Mr. Bolinder received a B.S. in Business Administration from the University of Massachusetts, Dartmouth.
G. Kent Conrad has served as a member of our board of directors since March 2013. Sen. Conrad served as a U.S. Senator representing the State of North Dakota from January 1987 to January 2013. He served as the Chair of the Senate Budget Committee from 2006 until his retirement. Prior to serving in the U.S. Senate, Sen. Conrad served as the Tax Commissioner for the State of North Dakota from 1981 to 1986 and as Assistant Tax Commissioner from 1974 to 1980. Sen. Conrad holds an A.B. degree in Political Science from Stanford University and an M.B.A. degree from George Washington University.
Melina E. Higgins has served as a member of our board of directors since September 2013. Ms. Higgins retired in 2010 from a nearly 20-year career at The Goldman Sachs Group Inc., where she served as a Managing Director from 2001 and a Partner from 2002. During her tenure at Goldman Sachs, Ms. Higgins served as Head of the Americas and Co-Chairperson of the Investment Advisory Committee for the GS Mezzanine Partners funds, which managed over $30 billion of assets. She also served as a member of the Investment Committee for the Principal Investment Area, which oversaw and approved global private equity and private debt investments. Goldman’s Principal Investment Area was one of the largest alternative asset managers in the world. Ms. Higgins has served as an independent director of Mylan, Inc. since February 2013. Ms. Higgins received a B.A. in Economics and Spanish from Colgate University and an M.B.A. from Harvard Business School.
Nancy J. Karch has served as a member of our board of directors since October 2005. Ms. Karch was a Senior Partner of McKinsey & Company, an independent consulting firm, from 1988 until her retirement in 2000. Prior thereto, Ms. Karch served in various executive capacities at McKinsey since 1974. She has served as a director of Kimberly-Clark Corp. since June 2010, Kate Spade & Company (formerly Fifth & Pacific Companies, Inc. and Liz Claiborne, Inc.) since January 2000 and became the non-executive Chairman of the Board in May 2013, MasterCard Incorporated since January 2007, and CEB (The Corporate Executive Board, Inc.) since October 2001. Ms. Karch is also on the board of the Northern Westchester Hospital, a not-for-profit organization. Ms. Karch received a B.A. in Mathematics from Cornell University, an M.S. in Mathematics from Northeastern University and an M.B.A. from Harvard Business School.
Christine B. Mead has served as a member of our board of directors since October 2009. Ms. Mead was the Executive Vice President and Chief Financial Officer of Safeco Corporation and the Co-President of the Safeco insurance companies from November 2004 until her retirement in December 2005. From January 2002 to November 2004, Ms. Mead served as Senior Vice President, Chief Financial Officer and Secretary of Safeco Corporation. Prior to joining Safeco in 2002, Ms. Mead served in various roles at Travelers Insurance Companies from 1989 to 2001, including Senior Vice President and Chief Financial Officer, Chief Accounting Officer, and Controller. Ms. Mead also served with Price Waterhouse LLP from 1980 to 1989, and with Deloitte Haskins & Sells in the United Kingdom from 1976 to 1980. Ms. Mead also serves as a trustee of the Idaho Chapter of The
369
Nature Conservancy, a non-profit organization. Ms. Mead received a B.S. in Accounting from University College Cardiff, United Kingdom.
David M. Moffett has served as a member of our board of directors since December 2012. Mr. Moffett was the Chief Executive Officer and a director of the Federal Home Loan Mortgage Corporation from September 2008 until his retirement in March 2009. Prior to this position, Mr. Moffett served as a Senior Advisor with the Carlyle Group LLC from May 2007 to September 2008. Mr. Moffett also served as the Vice Chairman and Chief Financial Officer of U.S. Bancorp from 2001 to 2007, after its merger with Firstar Corporation, having previously served as Vice Chairman and Chief Financial Officer of Firstar Corporation from 1998 to 2001 and as Chief Financial Officer of StarBanc Corporation, a predecessor to Firstar Corporation, from 1993 to 1998. Mr. Moffett has served as a director of eBay Inc. since July 2007 and CIT Group Inc. since July 2010. He also previously served on the boards of directors of MBIA Inc. from May 2007 to September 2008, The E.W. Scripps Company from May 2007 to September 2008 and Building Materials Holding Corporation from May 2006 to November 2008. Mr. Moffett also serves as a trustee on the boards of Columbia Fund Series Trust I and Columbia Funds Variable Insurance Trust, overseeing approximately 52 funds within the Columbia Funds mutual fund complex. He also serves as a trustee for the University of Oklahoma Foundation. Mr. Moffett holds a B.A. degree in Economics from the University of Oklahoma and an M.B.A. degree from Southern Methodist University.
Thomas E. Moloney has served as a member of our board of directors since October 2009. Mr. Moloney served as the interim Chief Financial Officer of MSC—Medical Services Company (“MSC”) from December 2007 to March 2008. He retired as the Senior Executive Vice President and Chief Financial Officer of John Hancock Financial Services, Inc. in December 2004. He had served in this position since 1992. Mr. Moloney served in various roles at John Hancock Financial Services, Inc. during his tenure from 1965 to 1992, including Vice President, Controller, and Senior Accountant. Mr. Moloney also previously served as a director of MSC from 2005 to 2012 (MSC was acquired in 2012 and ceased to be a public company in 2008). Mr. Moloney is on the boards of Nashoba Learning Group and the Boston Children’s Museum (past Chairperson), both non-profit organizations. Mr. Moloney received a B.A. in Accounting from Bentley University and holds an Executive Masters Professional Director Certification from the Corporate Directors Group.
James A. Parke has served as a member of our board of directors since May 2004. Mr. Parke retired as Vice Chairman and Chief Financial Officer of GE Capital Services and a Senior Vice President at GE in December 2005. He had served in those positions since 2002. From 1989 to 2002 he was Senior Vice President and Chief Financial Officer at GE Capital Services and a Vice President of GE. Prior thereto, from 1981 to 1989 he held various management positions in several GE businesses. He serves as a director of buildOn, a not-for-profit corporation. Mr. Parke received a B.A. in History, Political Science and Economics from Concordia College in Minnesota.
James S. Riepe has served as a member of our board of directors since March 2006 and was appointed Non-Executive Chairman of the Board in May 2012, having previously been appointed as Lead Director in February 2009. Mr. Riepe is a retired Vice Chairman and a Senior Advisor at T. Rowe Price Group, Inc. Mr. Riepe served as the Vice Chairman of T. Rowe Price Group, Inc. from 1997 until his retirement in December 2005. Prior to joining T. Rowe Price Group, Inc. in 1981, Mr. Riepe was an Executive Vice President of the Vanguard Group. Mr. Riepe has served as a director of The NASDAQ OMX Group, Inc. since May 2003 and LPL Financial Holdings Inc. since February 2008. Mr. Riepe also previously served as a director of T. Rowe Price Group, Inc. from 1981 to 2006 and as a director of 57 T. Rowe Price registered investment companies (mutual funds) until his retirement in 2006. He is a member of the University of Pennsylvania’s Board of Trustees. Mr. Riepe received a B.S. in Industrial Management, an M.B.A. and an Honorary Doctor of Laws degree from the University of Pennsylvania.
370
Other Information
We will provide the remaining information that is responsive to this Item 10 in our definitive proxy statement or in an amendment to this Annual Report not later than 120 days after the end of the fiscal year covered by this Annual Report, in either case under the captions “Election of Directors,” “Corporate Governance,” “Board of Directors and Committees,” “Section 16(a) Beneficial Ownership Reporting Compliance,” and possibly elsewhere therein. That information is incorporated into this Item 10 by reference.
| Item 11. | Executive Compensation |
We will provide information that is responsive to this Item 11 in our definitive proxy statement or in an amendment to this Annual Report not later than 120 days after the end of the fiscal year covered by this Annual Report, in either case under the captions “Board of Directors and Committees,” “Compensation Discussion and Analysis,” “Report of the Management Development and Compensation Committee” (which report shall be deemed furnished with this Form 10-K, and shall not be deemed “filed” for purposes of Section 18 of the Securities Exchange Act of 1934, nor shall it be deemed incorporated by reference in any filing under the Securities Act of 1933 or the Securities Exchange Act of 1934), “Executive Compensation,” and possibly elsewhere therein. That information is incorporated into this Item 11 by reference.
| Item 12. | Security Ownership of Certain Beneficial Owners and Management and Related Stockholder Matters |
We will provide information that is responsive to this Item 12 in our definitive proxy statement or in an amendment to this Annual Report not later than 120 days after the end of the fiscal year covered by this Annual Report, in either case under the caption “Information Relating to Directors, Director Nominees, Executive Officers and Significant Stockholders,” “Equity Compensation Plans,” and possibly elsewhere therein. That information is incorporated into this Item 12 by reference.
| Item 13. | Certain Relationships and Related Transactions, and Director Independence |
We will provide information that is responsive to this Item 13 in our definitive proxy statement or in an amendment to this Annual Report not later than 120 days after the end of the fiscal year covered by this Annual Report, in either case under the captions “Corporate Governance,” “Certain Relationships and Transactions,” and possibly elsewhere therein. That information is incorporated into this Item 13 by reference.
| Item 14. | Principal Accountant Fees and Services |
We will provide information that is responsive to this Item 14 in our definitive proxy statement or in an amendment to this Annual Report not later than 120 days after the end of the fiscal year covered by this Annual Report, in either case under the caption “Independent Registered Public Accounting Firm,” and possibly elsewhere therein. That information is incorporated into this Item 14 by reference.
371
| Item 15. | Exhibits and Financial Statement Schedules |
| a. Documents filed as part of this report. |
||||
| 1. | Financial Statements (see Item 8. Financial Statements and Supplementary Data) |
216 | ||
| Report of KPMG LLP, Independent Registered Public Accounting Firm |
217 | |||
| Consolidated Balance Sheets as of December 31, 2013 and 2012 |
218 | |||
| Consolidated Statements of Income for the years ended December 31, 2013, 2012 and 2011 |
219 | |||
| Consolidated Statements of Comprehensive Income for the years ended December 31, 2013, 2012 and 2011 |
220 | |||
| 221 | ||||
| Consolidated Statements of Cash Flows for the years ended December 31, 2013, 2012 and 2011 |
223 | |||
| 224 | ||||
| 2. | Financial Statement Schedules (see Item 8. Financial Statements and Supplementary Data) |
|||
| Report of KPMG LLP, Independent Registered Public Accounting Firm, on Schedules |
353 | |||
| Schedule I—Summary of investments—Other Than Investments in Related Parties |
354 | |||
| Schedule II—Financial Statements of Genworth Financial, Inc. (Parent Only) |
355 | |||
| 361 | ||||
| 3. | Exhibits |
| Number | Description | |
| 2.1 | Stock Purchase Agreement, dated as of March 27, 2013, by and among Genworth Holdings, Inc. (formerly Genworth Financial, Inc.) and AqGen Liberty Holdings LLC, AqGen Liberty Management I, Inc., AqGen Liberty Management II, Inc. and AqGen Liberty Acquisition, Inc. (incorporated by reference to Exhibit 2.1 to the Current Report on Form 8-K filed on March 28, 2013) | |
| 2.2 | Agreement and Plan of Merger, dated as of April 1, 2013, among Genworth Financial, Inc. (renamed Genworth Holdings, Inc.), Sub XLVI, Inc. (renamed Genworth Financial, Inc.) and Sub XLII, Inc. (incorporated by reference to Exhibit 2.1 to the Current Report on Form 8-K filed on April 1, 2013) | |
| 3.1 | Amended and Restated Certificate of Incorporation of Genworth Financial, Inc., dated as of April 1, 2013 (incorporated by reference to Exhibit 3.1 to the Current Report on Form 8-K filed on April 1, 2013) | |
| 3.2 | Amended and Restated Bylaws of Genworth Financial, Inc., dated as of April 1, 2013 (incorporated by reference to Exhibit 3.2 to the Current Report on Form 8-K filed on April 1, 2013) | |
| 4.1 | Specimen Class A Common Stock certificate (incorporated by reference to Exhibit 4.1 to the Annual Report on Form 10-K for the fiscal year ended December 31, 2012) | |
372
| 4.2 | Indenture, dated as of November 14, 2006, between Genworth Financial, Inc. (renamed Genworth Holdings, Inc.) and The Bank of New York Mellon Trust Company, N.A., as Trustee (incorporated by reference to Exhibit 4.1 to the Current Report on Form 8-K filed on November 14, 2006) | |
| 4.3 | First Supplemental Indenture, dated as of November 14, 2006, between Genworth Financial, Inc. (renamed Genworth Holdings, Inc.) and The Bank of New York Trust Company, N.A., as Trustee (incorporated by reference to Exhibit 4.2 to the Current Report on Form 8-K filed on November 14, 2006) | |
| 4.4 | Second Supplemental Indenture, dated as of April 1, 2013, among Genworth Holdings, Inc., Genworth Financial, Inc. and The Bank of New York Mellon Trust Company, N.A., as Trustee (incorporated by reference to Exhibit 4.2 to the Current Report on Form 8-K filed on April 1, 2013) | |
| 4.5 | Indenture, dated as of June 15, 2004, between Genworth Financial, Inc. (renamed Genworth Holdings, Inc.) and The Bank of New York (successor to JPMorgan Chase Bank), as Trustee (incorporated by reference to Exhibit 4.10 to the Annual Report on Form 10-K for the fiscal year ended December 31, 2004) | |
| 4.6 | Supplemental Indenture No. 1, dated as of June 15, 2004, between Genworth Financial, Inc. (renamed Genworth Holdings, Inc.) and The Bank of New York (successor to JPMorgan Chase Bank), as Trustee (incorporated by reference to Exhibit 4.11 to the Annual Report on Form 10-K for the fiscal year ended December 31, 2004) | |
| 4.7 | Supplemental Indenture No. 4, dated as of May 22, 2008, between Genworth Financial, Inc. (renamed Genworth Holdings, Inc.) and The Bank of New York Mellon Trust Company, N.A., as Trustee (incorporated by reference to Exhibit 4.1 to the Current Report on Form 8-K filed on May 22, 2008) | |
| 4.8 | Supplemental Indenture No. 5, dated as of December 8, 2009, between Genworth Financial, Inc. (renamed Genworth Holdings, Inc.) and The Bank of New York Mellon Trust Company, N.A., as Trustee (incorporated by reference to Exhibit 4.1 to the Current Report on Form 8-K filed on December 8, 2009) | |
| 4.9 | Supplemental Indenture No. 6, dated as of June 24, 2010, between Genworth Financial, Inc. (renamed Genworth Holdings, Inc.) and The Bank of New York Mellon Trust Company, N.A., as Trustee (incorporated by reference to Exhibit 4.1 to the Current Report on Form 8-K filed on June 24, 2010) | |
| 4.10 | Supplemental Indenture No. 7, dated as of November 22, 2010, between Genworth Financial, Inc. (renamed Genworth Holdings, Inc.) and The Bank of New York Mellon Trust Company, N.A., as Trustee (incorporated by reference to Exhibit 4.1 to the Current Report on Form 8-K filed on November 22, 2010) | |
| 4.11 | Supplemental Indenture No. 8, dated as of March 25, 2011, between Genworth Financial, Inc. (renamed Genworth Holdings, Inc.) and The Bank of New York Mellon Trust Company, N.A., as Trustee (incorporated by reference to Exhibit 4.1 to the Current Report on Form 8-K filed on March 25, 2011) | |
| 4.12 | Supplemental Indenture No. 9, dated as of April 1, 2013, among Genworth Holdings, Inc., Genworth Financial, Inc., as guarantor, and The Bank of New York Mellon Trust Company, N.A., as Trustee (incorporated by reference to Exhibit 4.1 to the Current Report on Form 8-K filed on April 1, 2013) | |
373
| 4.13 | Supplemental Indenture No. 10, dated as of August 8, 2013, among Genworth Holdings, Inc., Genworth Financial, Inc., as guarantor, and The Bank of New York Mellon Trust Company, N.A., as Trustee (incorporated by reference to Exhibit 4.1 to the Current Report on Form 8-K filed on August 8, 2013) | |
| 4.14 | Supplemental Indenture No. 11, dated as of December 10, 2013, among Genworth Holdings, Inc., Genworth Financial, Inc., as guarantor, and The Bank of New York Mellon Trust Company, N.A., as Trustee (incorporated by reference to Exhibit 4.1 to the Current Report on Form 8-K filed on December 10, 2013) | |
| 10.1 | Credit Agreement, dated as of September 26, 2013, among Genworth Financial, Inc., as guarantor, Genworth Holdings, Inc., as borrower, the lenders party thereto, JPMorgan Chase Bank, N.A., as administrative agent, Barclays Bank PLC and Bank of America, N.A., as co-syndication agents, Deutsche Bank Securities Inc., Fifth Third Bank, Goldman Sachs Bank USA and UBS Securities LLC, as co-documentation agents, and J.P. Morgan Securities LLC, Barclays Bank PLC and Merrill Lynch Pierce Fenner & Smith Incorporated, as joint bookrunners and joint lead arrangers (incorporated by reference to Exhibit 10.1 to the current report on Form 8-K filed on September 27, 2013) | |
| 10.2.1 | Master Agreement, dated July 7, 2009, among Genworth Financial, Inc. (renamed Genworth Holdings, Inc.), Genworth Financial Mortgage Insurance Company Canada, Genworth MI Canada Inc. and Brookfield Life Assurance Company Limited (incorporated by reference to Exhibit 10.1 to the Current Report on Form 8-K filed on July 10, 2009) | |
| 10.2.2 | Amendment No.1 to Master Agreement, dated April 1, 2013, among Genworth MI Canada Inc., Brookfield Life Assurance Company Limited, Genworth Financial, Inc. (renamed Genworth Holdings, Inc.), Genworth Financial Mortgage Insurance Company Canada and Sub XLVI, Inc. (renamed Genworth Financial, Inc.) (incorporated by reference to Exhibit 10.2 to the Current Report on Form 8-K filed on April 1, 2013) | |
| 10.3.1 | Shareholder Agreement, dated July 7, 2009, among Genworth MI Canada Inc., Brookfield Life Assurance Company Limited and Genworth Financial, Inc. (renamed Genworth Holdings, Inc.) (incorporated by reference to Exhibit 10.2 to the Current Report on Form 8-K filed on July 10, 2009) | |
| 10.3.2 | Assignment and Assumption Agreement for Shareholder Agreement, dated August 9, 2011, among Genworth MI Canada Inc., Genworth Financial, Inc. (renamed Genworth Holdings, Inc.), Brookfield Life Assurance Company Limited, Genworth Mortgage Holdings, LLC and Genworth Mortgage Insurance Corporation of North Carolina (incorporated by reference to Exhibit 10.1 to the Quarterly Report on Form 10-Q for the period ended September 30, 2011) | |
| 10.3.3 | Assignment and Assumption Agreement for Shareholder Agreement, dated August 9, 2011, among Genworth MI Canada Inc., Genworth Financial, Inc. (renamed Genworth Holdings, Inc.), Brookfield Life Assurance Company Limited, Genworth Mortgage Holdings, LLC and Genworth Mortgage Insurance Corporation (incorporated by reference to Exhibit 10.2 to the Quarterly Report on Form 10-Q for the period ended September 30, 2011) | |
| 10.3.4 | Assignment and Assumption Agreement for Shareholder Agreement, dated August 10, 2011, among Genworth MI Canada Inc., Genworth Financial, Inc. (renamed Genworth Holdings, Inc.), Brookfield Life Assurance Company Limited, Genworth Mortgage Insurance Corporation and Genworth Residential Mortgage Assurance Corporation (incorporated by reference to Exhibit 10.3 to the Quarterly Report on Form 10-Q for the period ended September 30, 2011) | |
374
| 10.3.5 | Amending Agreement, dated April 1, 2013, among Genworth MI Canada Inc., Brookfield Life Assurance Company Limited, Genworth Financial, Inc. (renamed Genworth Holdings, Inc.), Genworth Mortgage Holdings, LLC, Genworth Mortgage Insurance Corporation, Genworth Mortgage Insurance Corporation of North Carolina, Genworth Financial International Holdings, Inc., Genworth Residential Mortgage Assurance Corporation and Sub XLVI, Inc. (renamed Genworth Financial, Inc.) (incorporated by reference to Exhibit 10.3 to the Current Report on Form 8-K filed on April 1, 2013) | |
| 10.4.1 | Restated Tax Matters Agreement, dated as of February 1, 2006, by and among General Electric Company, General Electric Capital Corporation, GE Financial Assurance Holdings, Inc., GEI, Inc. and Genworth Financial, Inc. (renamed Genworth Holdings, Inc.) (incorporated by reference to Exhibit 10.2 to the Annual Report on Form 10-K for the fiscal year ended December 31, 2006) | |
| 10.4.2 | Consent and Agreement to Become a Party to Restated Tax Matters Agreement, dated April 1, 2013, among Genworth Financial, Inc., Genworth Holdings, Inc., General Electric Company, General Electric Capital Corporation, GE Financial Assurance Holdings, Inc. and GEI, Inc. (incorporated by reference to Exhibit 10.4 to the Current Report on Form 8-K filed on April 1, 2013) | |
| 10.5 | Canadian Tax Matters Agreement, dated as of May 24, 2004, among General Electric Company, General Electric Capital Corporation, GECMIC Holdings Inc., GE Capital Mortgage Insurance Company (Canada) (now known as Genworth Financial Mortgage Insurance Company Canada) and Genworth Financial, Inc. (renamed Genworth Holdings, Inc.) (incorporated by reference to Exhibit 10.47 to the Current Report on Form 8-K filed on June 7, 2004) | |
| 10.6 | European Tax Matters Agreement, dated as of May 24, 2004, among General Electric Company, General Electric Capital Corporation and Genworth Financial, Inc. (renamed Genworth Holdings, Inc.) (incorporated by reference to Exhibit 10.57 to the Current Report on Form 8-K filed on June 7, 2004) | |
| 10.7 | Australian Tax Matters Agreement, dated as of May 24, 2004, between Genworth Financial, Inc. (renamed Genworth Holdings, Inc.) and General Electric Capital Corporation (incorporated by reference to Exhibit 10.58 to the Current Report on Form 8-K field on June 7, 2004) | |
| 10.8 | Coinsurance Agreement, dated as of April 15, 2004, by and between GE Life and Annuity Assurance Company (now known as Genworth Life and Annuity Insurance Company) and Union Fidelity Life Insurance Company (incorporated by reference to Exhibit 10.11 to the Registration Statement) | |
| 10.8.1 | Amendments to Coinsurance Agreement (incorporated by reference to Exhibit 10.6.1 to the Annual Report on Form 10-K for the fiscal year ended December 31, 2008) | |
| 10.9 | Coinsurance Agreement, dated as of April 15, 2004, by and between Federal Home Life Insurance Company (merged with and into Genworth Life and Annuity Insurance Company effective January 1, 2007) and Union Fidelity Life Insurance Company (incorporated by reference to Exhibit 10.12 to the Registration Statement) | |
| 10.9.1 | Amendments to Coinsurance Agreement (incorporated by reference to Exhibit 10.7.1 to the Annual Report on Form 10-K for the fiscal year ended December 31, 2008) | |
| 10.10 | Coinsurance Agreement, dated as of April 15, 2004, by and between General Electric Capital Assurance Company (now known as Genworth Life Insurance Company) and Union Fidelity Life Insurance Company (incorporated by reference to Exhibit 10.13 to the Registration Statement) | |
| 10.10.1 | Amendments to Coinsurance Agreement (incorporated by reference to Exhibit 10.8.1 to the Annual Report on Form 10-K for the fiscal year ended December 31, 2008) | |
375
| 10.11 | Coinsurance Agreement, dated as of April 15, 2004, by and between GE Capital Life Assurance Company of New York (now known as Genworth Life Insurance Company of New York) and Union Fidelity Life Insurance Company (incorporated by reference to Exhibit 10.14 to the Registration Statement) | |
| 10.11.1 | Amendments to Coinsurance Agreement (incorporated by reference to Exhibit 10.9.1 to the Annual Report on Form 10-K for the fiscal year ended December 31, 2008) | |
| 10.11.2 | Third Amendment to Coinsurance Agreement (incorporated by reference to Exhibit 10.11.2 to the Annual Report on Form 10-K for the fiscal year ended December 31, 2009) | |
| 10.12 | Coinsurance Agreement, dated as of April 15, 2004, by and between American Mayflower Life Insurance Company of New York (merged with and into Genworth Life Insurance Company of New York effective January 1, 2007) and Union Fidelity Life Insurance Company (incorporated by reference to Exhibit 10.15 to the Registration Statement) | |
| 10.12.1 | Amendments to Coinsurance Agreement (incorporated by reference to Exhibit 10.10.1 to the Annual Report on Form 10-K for the fiscal year ended December 31, 2008) | |
| 10.12.2 | Third Amendment to Coinsurance Agreement (incorporated by reference to Exhibit 10.12.2 to the Annual Report on Form 10-K for the fiscal year ended December 31, 2009) | |
| 10.13 | Coinsurance Agreement, dated as of April 15, 2004, between First Colony Life Insurance Company (merged with and into Genworth Life and Annuity Insurance Company, effective January 1, 2007) and Union Fidelity Life Insurance Company (incorporated by reference to Exhibit 10.54 to the Registration Statement) | |
| 10.13.1 | Amendments to Coinsurance Agreement (incorporated by reference to Exhibit 10.11.1 to the Annual Report on Form 10-K for the fiscal year ended December 31, 2008) | |
| 10.14 | Retrocession Agreement, dated as of April 15, 2004, by and between General Electric Capital Assurance Company (now known as Genworth Life Insurance Company) and Union Fidelity Life Insurance Company (incorporated by reference to Exhibit 10.16 to the Registration Statement) | |
| 10.14.1 | Amendments to Retrocession Agreement (incorporated by reference to Exhibit 10.12.1 to the Annual Report on Form 10-K for the fiscal year ended December 31, 2008) | |
| 10.15 | Retrocession Agreement, dated as of April 15, 2004, by and between GE Capital Life Assurance Company of New York (now known as Genworth Life Insurance Company of New York) and Union Fidelity Life Insurance Company (incorporated by reference to Exhibit 10.17 to the Registration Statement) | |
| 10.15.1 | Amendments to Retrocession Agreement (incorporated by reference to Exhibit 10.13.1 to the Annual Report on Form 10-K for the fiscal year ended December 31, 2008) | |
| 10.15.2 | Third Amendment to Retrocession Agreement (incorporated by reference to Exhibit 10.15.2 to the Annual Report on Form 10-K for the fiscal year ended December 31, 2009) | |
| 10.16 | Reinsurance Agreement, dated as of April 15, 2004, by and between GE Life and Annuity Assurance Company (now known as Genworth Life and Annuity Insurance Company) and Union Fidelity Life Insurance Company (incorporated by reference to Exhibit 10.18 to the Registration Statement) | |
| 10.16.1 | First Amendment to Reinsurance Agreement (incorporated by reference to Exhibit 10.14.1 to the Annual Report on Form 10-K for the fiscal year ended December 31, 2008) | |
| 10.16.2 | Second Amendment to Reinsurance Agreement (incorporated by reference to Exhibit 10.15.2 to the Annual Report on Form 10-K for the fiscal year ended December 31, 2012) | |
376
| 10.17 | Reinsurance Agreement, dated as of April 15, 2004, by and between GE Capital Life Assurance Company of New York (now known as Genworth Life Insurance Company of New York) and Union Fidelity Life Insurance Company (incorporated by reference to Exhibit 10.19 to the Registration Statement) | |
| 10.17.1 | First Amendment to Reinsurance Agreement (incorporated by reference to Exhibit 10.15.1 to the Annual Report on Form 10-K for the fiscal year ended December 31, 2008) | |
| 10.17.2 | Second Amendment to Reinsurance Agreement (incorporated by reference to Exhibit 10.17.2 to the Annual Report on Form 10-K for the fiscal year ended December 31, 2009) | |
| 10.17.3 | Third Amendment to Reinsurance Agreement (incorporated by reference to Exhibit 10.16.3 to the Annual Report on Form 10-K for the fiscal year ended December 31, 2012) | |
| 10.18 | Trust Agreement, dated as of April 15, 2004, among Union Fidelity Life Insurance Company, General Electric Capital Assurance Company (now known as Genworth Life Insurance Company) and The Bank of New York (incorporated by reference to Exhibit 10.48 to the Registration Statement) | |
| 10.19 | Trust Agreement, dated as of April 15, 2004, among Union Fidelity Life Insurance Company, Federal Home Life Insurance Company (merged with and into Genworth Life and Annuity Insurance Company, effective January 1, 2007) and The Bank of New York (incorporated by reference to Exhibit 10.51 to the Registration Statement) | |
| 10.20 | Trust Agreement, dated as of April 15, 2004, among Union Fidelity Life Insurance Company, First Colony Life Insurance Company (merged with and into Genworth Life and Annuity Insurance Company, effective January 1, 2007) and The Bank of New York (incorporated by reference to Exhibit 10.53 to the Registration Statement) | |
| 10.21 | Trust Agreement, dated as of April 15, 2004, among Union Fidelity Insurance Company, American Mayflower Life Insurance Company of New York (merged with and into Genworth Life Insurance Company of New York, effective January 1, 2007) and The Bank of New York (incorporated by reference to Exhibit 10.49 to the Registration Statement) | |
| 10.22 | Trust Agreement, dated as of April 15, 2004, among Union Fidelity Life Insurance Company, GE Life and Annuity Assurance Company (now known as Genworth Life and Annuity Insurance Company) and The Bank of New York (incorporated by reference to Exhibit 10.50 to the Registration Statement) | |
| 10.23 | Trust Agreement, dated as of April 15, 2004, among Union Fidelity Life Insurance Company, GE Capital Life Assurance Company of New York (now known as Genworth Life Insurance Company of New York) and The Bank of New York (incorporated by reference to Exhibit 10.52 to the Registration Statement) | |
| 10.24 | Trust Agreement, dated as of December 1, 2009, among Union Fidelity Life Insurance Company, Genworth Life Insurance Company of New York and Deutsche Bank Trust Company Americas (incorporated by reference to Exhibit 10.24 to the Annual Report on Form 10-K for the fiscal year ended December 31, 2009) | |
| 10.25 | Capital Maintenance Agreement, dated as of January 1, 2004, by and between Union Fidelity Life Insurance Company and General Electric Capital Corporation (incorporated by reference to Exhibit 10.21 to the Registration Statement) | |
| 10.26 | Replacement Capital Covenant, dated November 14, 2006 (incorporated by reference to Exhibit 10.1 to the Current Report on Form 8-K filed on November 14, 2006) | |
377
| 10.27 | Assignment and Assumption Agreement, dated as of April 1, 2013, between Genworth Holdings, Inc. and Genworth Financial, Inc. (incorporated by reference to Exhibit 10.1 to the Current Report on Form 8-K filed on April 1, 2013) | |
| 10.28§ | 2004 Genworth Financial, Inc. Omnibus Incentive Plan (incorporated by reference to Exhibit 10.56 to the Registration Statement) | |
| 10.28.1§ | First Amendment to the Genworth Financial, Inc. 2004 Omnibus Incentive Plan (incorporated by reference to Exhibit 10.1 to the Quarterly Report on Form 10-Q for the period ended September 30, 2007) | |
| 10.28.2§ | Second Amendment to the Genworth Financial, Inc. 2004 Omnibus Incentive Plan (incorporated by reference to Exhibit 10.1 to the Current Report on Form 8-K filed on May 18, 2009) | |
| 10.29§ | Amended & Restated Sub-Plan under the 2004 Genworth Financial, Inc. Omnibus Incentive Plan: Genworth Financial Canada Stock Savings Plan (incorporated by reference to Exhibit 10.31 to the Annual Report on Form 10-K for the fiscal year ended December 31, 2009) | |
| 10.30§ | Sub-Plan under the 2004 Genworth Financial, Inc. Omnibus Incentive Plan: Genworth Financial, Inc. U.K. Share Incentive Plan (incorporated by reference to Exhibit 10.52.7 to the Quarterly Report on Form 10-Q for the period ended September 30, 2006) | |
| 10.31§ | Sub-Plan under the 2004 Genworth Financial, Inc. Omnibus Incentive Plan: Genworth Financial U.K. Share Option Plan (incorporated by reference to Exhibit 10.29 to the Annual Report on Form 10-K for the fiscal year ended December 31, 2007) | |
| 10.32.1§ | Form of Deferred Stock Unit Award Agreement under the 2004 Genworth Financial, Inc. Omnibus Incentive Plan (incorporated by reference to Exhibit 10.56.1 to the Current Report on Form 8-K filed on December 30, 2004) | |
| 10.32.2§ | Form of Deferred Stock Unit Award Agreement under the 2004 Genworth Financial, Inc. Omnibus Incentive Plan (for grants after January 1, 2010) (incorporated by reference to Exhibit 10.34.2 to the Annual Report on Form 10-K for the fiscal year ended December 31, 2009) | |
| 10.32.3§ | Form of Stock Option Award Agreement under the 2004 Genworth Financial, Inc. Omnibus Incentive Plan (incorporated by reference to Exhibit 10.4 to the Quarterly Report on Form 10-Q for the period ended September 30, 2007) | |
| 10.32.4§ | Form of Stock Appreciation Rights Award Agreement under the 2004 Genworth Financial, Inc. Omnibus Incentive Plan (incorporated by reference to Exhibit 10.3 to the Quarterly Report on Form 10-Q for the period ended September 30, 2007) | |
| 10.32.5§ | Form of Stock Appreciation Rights with a Maximum Share Value Award Agreement under the 2004 Genworth Financial, Inc. Omnibus Incentive Plan (incorporated by reference to Exhibit 10 to the Quarterly Report on Form 10-Q for the period ended March 31, 2011) | |
| 10.32.6§ | Form of Restricted Stock Unit Award Agreement under the 2004 Genworth Financial, Inc. Omnibus Incentive Plan (incorporated by reference to Exhibit 10.30.4 to the Annual Report on Form 10-K for the fiscal year ended December 31, 2007) | |
| 10.32.7§ | Form of Mid-Term Incentive Award Agreement under the 2004 Genworth Financial, Inc. Omnibus Incentive Plan (incorporated by reference to Exhibit 10 to the Quarterly Report on Form 10-Q for the period ended March 31, 2010) | |
| 10.33§ | 2012 Genworth Financial, Inc. Omnibus Incentive Plan (incorporated by reference to Exhibit 10.1 to the Current Report on Form 8-K filed on May 21, 2012) | |
378
| 10.33.1§ | Form of Stock Appreciation Rights with a Maximum Share Value Award Agreement under the 2012 Genworth Financial, Inc. Omnibus Incentive Plan (filed herewith) | |
| 10.33.2§ | Form of Restricted Stock Unit Award Agreement under the 2012 Genworth Financial, Inc. Omnibus Incentive Plan (filed herewith) | |
| 10.33.3§ | Form of Deferred Stock Unit Award Agreement under the 2012 Genworth Financial, Inc. Omnibus Incentive Plan (incorporated by reference to Exhibit 10.6 to the Quarterly Report on Form 10-Q for the period ended June 30, 2012) | |
| 10.33.4§ | Form of Stock Appreciation Rights with a Maximum Share Value—Executive Officer Retention Agreement under the 2012 Genworth Financial, Inc. Omnibus Incentive Plan (incorporated by reference to Exhibit 10.3 to the Current Report on Form 8-K filed on November 1, 2012) | |
| 10.33.5§ | Stock Appreciation Rights with a Maximum Share Value—CEO New Hire Grant under the 2012 Genworth Financial, Inc. Omnibus Incentive Plan (incorporated by reference to Exhibit 10.32.5 to the Annual Report on Form 10-K for the fiscal year ended December 31, 2012) | |
| 10.33.6§ | Form of Performance Stock Unit Award Agreement under the 2012 Genworth Financial, Inc. Omnibus Incentive Plan (filed herewith) | |
| 10.34§ | Amendment to Stock Options and Stock Appreciation Rights under the 2004 Genworth Financial, Inc. Omnibus Incentive Plan and the 2012 Genworth Financial, Inc. Omnibus Incentive Plan (incorporated by reference to Exhibit 10.7 to the Quarterly Report on Form 10-Q for the period ended June 30, 2013) | |
| 10.35§ | Policy Regarding Personal Use of Non-Commercial Aircraft by Executive Officers (incorporated by reference to Exhibit 10 to the Current Report on Form 8-K filed on July 21, 2006) | |
| 10.36.1§ | Genworth Financial, Inc. Amended and Restated 2005 Change of Control Plan (incorporated by reference to Exhibit 10.32 to the Annual Report on Form 10-K for the fiscal year ended December 31, 2007) | |
| 10.36.2§ | Amendment to the Genworth Financial, Inc. Amended and Restated 2005 Change in Control Plan (incorporated by reference to Exhibit 10.34.2 to the Annual Report on Form 10-K for the fiscal year ended December 31, 2012) | |
| 10.37.1§ | Genworth Financial, Inc. 2011 Change of Control Plan (incorporated by reference to Exhibit 10 to the Quarterly Report on Form 10-Q for the period ended June 30, 2011) | |
| 10.37.2§ | Amendment to the Genworth Financial, Inc. 2011 Change in Control Plan (incorporated by reference to Exhibit 10.35.2 to the Annual Report on Form 10-K for the fiscal year ended December 31, 2012) | |
| 10.38.1§ | Amended and Restated Genworth Financial, Inc. Retirement and Savings Restoration Plan (incorporated by reference to Exhibit 10.1 to the Quarterly Report on Form 10-Q for the period ended March 31, 2012) | |
| 10.38.2§ | First Amendment to the Amended and Restated Genworth Financial, Inc. Retirement and Savings Restoration Plan (incorporated by reference to Exhibit 10.5 to the Quarterly Report on Form 10-Q for the period ended June 30, 2013) | |
| 10.39.1§ | Amended and Restated Genworth Financial, Inc. Supplemental Executive Retirement Plan (incorporated by reference to Exhibit 10.2 to the Quarterly Report on Form 10-Q for the period ended March 31, 2012) | |
| 10.39.2§ | First Amendment to the Amended and Restated Genworth Financial, Inc. Supplemental Executive Retirement Plan (incorporated by reference to Exhibit 10.6 to the Quarterly Report on Form 10-Q for the period ended June 30, 2013) | |
379
| 10.40§ | Amended and Restated Genworth Financial, Inc. Deferred Compensation Plan (incorporated by reference to Exhibit 10.36 to the Annual Report on Form 10-K for the fiscal year ended December 31, 2008) | |
| 10.41§ | Amended and Restated Genworth Financial, Inc. Leadership Life Insurance Plan (incorporated by reference to Exhibit 10.37 to the Annual Report on Form 10-K for the fiscal year ended December 31, 2008) | |
| 10.42.1§ | Genworth Financial, Inc. Executive Life Program (incorporated by reference to Exhibit 10.2 to the Current Report on Form 8-K filed on September 6, 2005) | |
| 10.42.2§ | Amendment to the Genworth Financial, Inc. Executive Life Program (incorporated by reference to Exhibit 10.2 to the Quarterly Report on Form 10-Q for the period ended March 31, 2007) | |
| 10.42.3§ | Amendment to the Genworth Financial, Inc. Executive Life Program (incorporated by reference to Exhibit 10.38.2 to the Annual Report on Form 10-K for the fiscal year ended December 31, 2008) | |
| 10.43§ | Director Compensation Summary (filed herewith) | |
| 10.44§ | Annuity Contribution Arrangement with Leon E. Roday (incorporated by reference to Exhibit 10 to the Quarterly Report on Form 10-Q for the period ended June 30, 2009) | |
| 10.45§ | Separation Agreement and Release, dated November 8, 2013, between Genworth Financial, Inc. and Patrick B. Kelleher (filed herewith) | |
| 10.46§ | Separation Agreement and Release, dated May 14, 2012, between Genworth Financial, Inc. and Michael D. Fraizer (incorporated by reference to Exhibit 10.2 to the Quarterly Report on Form 10-Q for the period ended June 30, 2012) | |
| 10.47§ | Genworth Financial, Inc. 2012 Key Employee Severance Plan (incorporated by reference to Exhibit 10.1 to the Current Report on Form 8-K filed on November 1, 2012) | |
| 10.48§ | Form of Cash Retention Award Agreement (incorporated by reference to Exhibit 10.2 to the Current Report on Form 8-K filed on November 1, 2012) | |
| 12 | Statement of Ratio of Income to Fixed Charges (filed herewith) | |
| 21 | Subsidiaries of the registrant (filed herewith) | |
| 23 | Consent of KPMG LLP (filed herewith) | |
| 24 | Powers of Attorney (filed herewith) | |
| 31.1 | Certification Pursuant to Section 302 of the Sarbanes-Oxley Act of 2002—Thomas J. McInerney (filed herewith) | |
| 31.2 | Certification Pursuant to Section 302 of the Sarbanes-Oxley Act of 2002—Martin P. Klein (filed herewith) | |
| 32.1 | Certification Pursuant to Section 1350 of Chapter 63 of Title 18 of the United States Code—Thomas J. McInerney (filed herewith) | |
| 32.2 | Certification Pursuant to Section 1350 of Chapter 63 of Title 18 of the United States Code—Martin P. Klein (filed herewith) | |
| 101.INS | XBRL Instance Document | |
| 101.SCH | XBRL Taxonomy Extension Schema Document | |
| 101.CAL | XBRL Taxonomy Extension Calculation Linkbase Document | |
| 101.LAB | XBRL Taxonomy Extension Label Linkbase Document | |
| 101.PRE | XBRL Taxonomy Extension Presentation Linkbase Document | |
| 101.DEF | XBRL Taxonomy Extension Definition Linkbase Document | |
| 101.DEF | XBRL Taxonomy Extension Definition Linkbase Document | |
| § | Management contract or compensatory plan or arrangement. |
380
Neither Genworth Financial, Inc., nor any of its consolidated subsidiaries, has outstanding any instrument with respect to its long-term debt, other than those filed as an exhibit to this Annual Report, under which the total amount of securities authorized exceeds 10% of the total assets of Genworth Financial, Inc. and its subsidiaries on a consolidated basis. Genworth Financial, Inc. hereby agrees to furnish to the U.S. Securities and Exchange Commission, upon request, a copy of each instrument that defines the rights of holders of such long-term debt that is not filed or incorporated by reference as an exhibit to this Annual Report.
Genworth Financial, Inc. will furnish any exhibit upon the payment of a reasonable fee, which fee shall be limited to Genworth Financial, Inc.’s reasonable expenses in furnishing such exhibit.
381
SIGNATURES
Pursuant to the requirements of Section 13 or 15(d) of the Securities Exchange Act of 1934, the registrant has duly caused this report to be signed on its behalf by the undersigned, thereunto duly authorized.
Dated: March 3, 2014
| GENWORTH FINANCIAL, INC. | ||
| By: | /s/ Thomas J. McInerney | |
| Name: | Thomas J. McInerney | |
| Title: | President and Chief Executive Officer; Director | |
| (Principal Executive Officer) | ||
Pursuant to the requirements of the Securities Exchange Act of 1934, this report has been signed below by the following persons on behalf of the registrant and in the capacities and on the date indicated.
Dated: March 3, 2014
| /s/ Thomas J. McInerney Thomas J. McInerney |
President and Chief Executive Officer; Director (Principal Executive Officer) |
|||
| /s/ Martin P. Klein Martin P. Klein |
Executive Vice President and Chief Financial Officer (Principal Financial Officer) |
|||
| /s/ Kelly L. Groh Kelly L. Groh |
Vice President and Controller (Principal Accounting Officer) |
|||
| * William H. Bolinder |
Director | |||
| * G. Kent Conrad |
Director | |||
| * Melina E. Higgins |
Director |
|||
| * Nancy J. Karch |
Director | |||
| * Christine B. Mead |
Director | |||
| * David M. Moffett |
Director | |||
| * Thomas E. Moloney |
Director | |||
| * James A. Parke |
Director | |||
| * James S. Riepe |
Director | |||
| *By | /s/ Thomas J. McInerney | |
| Thomas J. McInerney Attorney-in-Fact |
382