
UNITED STATES
SECURITIES AND EXCHANGE COMMISSION
WASHINGTON, D.C. 20549
FORM 10-K
| x | ANNUAL REPORT PURSUANT TO SECTION 13 OR 15(d) OF THE SECURITIES EXCHANGE ACT OF 1934 |
For the fiscal year ended December 31, 2006
OR
| ¨ | TRANSITION REPORT PURSUANT TO SECTION 13 OR 15(d) OF THE SECURITIES EXCHANGE ACT OF 1934 |
For the transition period from to
Commission file number 001-32195
GENWORTH FINANCIAL, INC.
(Exact Name of Registrant as Specified in Its Charter)
| Delaware | 33-1073076 | |
| (State or Other Jurisdiction of Incorporation or Organization) |
(I.R.S. Employer Identification No.) |
6620 West Broad Street
Richmond, Virginia 23230
(804) 281-6000
(Address and Telephone Number of Principal Executive Offices)
Securities registered pursuant to Section 12(b) of the Act
| Title of Each Class |
Name of Each Exchange On Which Registered | |
| Class A Common Stock, par value $.001 per share 6.00% Equity Units |
New York Stock Exchange New York Stock Exchange |
Securities registered pursuant to Section 12(g) of the Act:
5.25% Series A Cumulative Preferred Stock, Liquidation Preference $50 per share
Indicate by check mark whether the registrant is a well-known seasoned issuer as defined in Rule 405 of the Securities Act. Yes x No ¨
Indicate by check mark if the registrant is not required to file reports pursuant to Section 13 or Section 15(d) of the Exchange Act. Yes ¨ No x
Indicate by check mark whether the registrant (1) has filed all reports required to be filed by Section 13 or 15(d) of the Securities Exchange Act of 1934 during the preceding 12 months (or for such shorter period that the registrant was required to file such reports) and (2) has been subject to such filing requirements for the past 90 days. Yes x No ¨
Indicate by check mark if disclosure of delinquent filers pursuant to Item 405 of Regulation S-K is not contained herein, and will not be contained, to the best of registrant’s knowledge, in definitive proxy or information statements incorporated by reference in Part III of this Form 10-K or any amendment to this Form 10-K. x
Indicate by check mark whether the registrant is a large accelerated filer, an accelerated filer, or a non-accelerated filer. See definition of “accelerated filer and large accelerated filer” in Rule 12b-2 of the Exchange Act. (Check one):
| Large accelerated filer x |
Accelerated filer ¨ | Non-accelerated filer ¨ |
Indicate by check mark whether the registrant is a shell company (as defined in Rule 12b-2 of the Exchange Act). Yes ¨ No x
As of February 15, 2007, 440,786,553 shares of Class A Common Stock, par value $0.001 per share were outstanding.
The aggregate market value of the common equity (based on the closing price of the Class A Common Stock on The New York Stock Exchange) held by non-affiliates of the registrant on June 30, 2006, the last business day of the registrant’s most recently completed second fiscal quarter, was approximately $15.8 billion. All 10% and greater stockholders, executive officers and directors of the registrant have been deemed, solely for the purpose of the foregoing calculation, to be “affiliates” of the registrant.
DOCUMENTS INCORPORATED BY REFERENCE
Certain portions of the registrant’s definitive proxy statement pursuant to Regulation 14A of the Securities Exchange Act of 1934 in connection with the 2007 annual meeting of the registrant’s stockholders are incorporated by reference into Part III of this Annual Report on Form 10-K.
| Page | ||||
| Item 1. |
3 | |||
| Item 1A. |
51 | |||
| Item 1B. |
70 | |||
| Item 2. |
70 | |||
| Item 3. |
71 | |||
| Item 4. |
73 | |||
| Item 5. |
74 | |||
| Item 6. |
76 | |||
| Item 7. |
Management’s Discussion and Analysis of Financial Condition and Results of Operations |
80 | ||
| Item 7A. |
141 | |||
| Item 8. |
143 | |||
| Item 9. |
Changes in and Disagreements With Accountants on Accounting and Financial Disclosure |
203 | ||
| Item 9A. |
203 | |||
| Item 9B. |
205 | |||
| Item 10. |
206 | |||
| Item 11. |
211 | |||
| Item 12. |
Security Ownership of Certain Beneficial Owners and Management and Related Stockholder Matters |
211 | ||
| Item 13. |
Certain Relationships and Related Transactions, and Director Independence |
211 | ||
| Item 14. |
211 | |||
| Item 15. |
212 | |||
2
In this Annual Report on Form 10-K, unless the context otherwise requires, “Genworth,” “we,” “us,” and “our” refer to Genworth Financial, Inc. and its subsidiaries.
Overview
Genworth Financial is a leading financial security company dedicated to developing solutions that help meet the investment, protection, homeownership, retirement and independent lifestyle needs of more than 15 million customers, with a presence in more than 25 countries. We have leadership positions offering key products and solutions that we believe will benefit from significant demographic, legislative and market trends that increasingly are shifting responsibility for building financial security to the individual. We distribute our products and services through extensive and diversified channels that include: financial intermediaries, advisors, independent distributors and dedicated sales specialists. We are headquartered in Richmond, Virginia and had approximately 7,200 employees as of December 31, 2006.
Our protection products include life insurance, long-term care insurance, and supplemental health offerings and payment protection coverages. Our retirement products help people create dependable income streams for life or for specified periods, and help them save and invest to achieve financial goals. Retirement offerings include annuities, financial planning services and managed accounts. We also enable homeownership, helping people purchase homes with low down payments, coupled with the use of mortgage insurance that protects lenders against the risk of default. Across all our businesses, we differentiate through product innovation and by providing valued services such as education and training, wellness programs, support services and technology linked to our insurance and investment products to create solutions addressing consumer and distributor needs. These solutions are intended to make us easier to do business with and help our business partners grow more effectively.
As of December 31, 2006, we had three operating segments:
| • | Protection. In the United States, we are a leading provider of life insurance and long-term care insurance, have developed linked benefit products such as long-term care insurance linked with life insurance or an annuity and offer selected senior services and products including Medicare supplement insurance. We also offer group life and health insurance primarily to companies with fewer than 1,000 employees. In January 2007, we announced an agreement to sell the group life and health business and expect to close the transaction in the second quarter of 2007. Outside the U.S., we offer payment protection insurance, which helps consumers meet specified payment obligations should they become unable to pay due to accident, illness, involuntary unemployment, disability or death. For the year ended December 31, 2006, Protection segment net income was $618 million and segment net operating income was $614 million. |
| • | Retirement Income and Investments. We offer our U.S. customers a variety of wealth accumulation, income distribution and institutional investment products. Retail products include: individual fixed and variable annuities; group variable annuities offered through retirement plans; single premium immediate annuities; variable life insurance; and a variety of managed account programs and services, financial planning advisory services and managed proprietary and third-party mutual funds. Institutional products include: funding agreements, funding agreements backing notes (“FABNs”), asset management products and services, and guaranteed investment contracts (“GICs”). For the year ended December 31, 2006, Retirement Income and Investments segment net income was $203 million and segment net operating income was $237 million. |
3
| • | Mortgage Insurance. In the U.S., Canada, Australia, New Zealand, Mexico, Japan and multiple European countries, we offer mortgage insurance products that enable borrowers to buy homes with low-down-payments. We also provide mortgage insurance on a structured, or bulk basis, that aids in the sale of mortgages to the capital markets, and which helps lenders manage capital and risks. Additionally, we offer services, analytical tools and technology that enable lenders to operate more efficiently and more effectively manage risk. For the year ended December 31, 2006, Mortgage Insurance segment net income was $618 million and segment net operating income was $614 million. |
We also have Corporate and Other activities, which consist primarily of unallocated corporate income and expenses, results of a small, non-core business, and most interest and other financing expenses. For the year ended December 31, 2006, Corporate and Other had net losses of $111 million and net operating losses of $107 million.
On a consolidated basis, we had $13.3 billion of total stockholders’ equity and $110.9 billion of total assets as of December 31, 2006. For the year ended December 31, 2006, our revenues were $11.0 billion and net income was $1.3 billion. Our principal life insurance companies have financial strength ratings of “AA-” (Very Strong) from S&P, “Aa3” (Excellent) from Moody’s, “A+” (Superior) from A.M. Best and “AA-” (Very Strong) from Fitch, and our rated mortgage insurance companies have financial strength ratings of “AA” (Very Strong) from S&P, “Aa2” (Excellent) from Moody’s, “AA” (Very Strong) from Fitch and/or “AA” (Superior) from Dominion Bond Rating Service (“DBRS”). The “AA” and “AA-” ratings are the third- and fourth-highest of S&P’s 20 ratings categories, respectively. The “Aa2” and “Aa3” ratings are the third- and fourth-highest of Moody’s 21 ratings categories, respectively. The “A+” rating is the second highest of A.M. Best’s 15 ratings categories. The “AA” and “AA-” ratings are the third- and fourth-highest of Fitch’s 24 ratings categories, respectively. The “AA” rating is the second highest of DBRS’s 10 ratings categories.
Genworth Financial was incorporated in Delaware in 2003, and our initial public offering of our common stock was completed on May 28, 2004 (“IPO”). See note 1 in our consolidated financial statements under “Item 8—Financial Statements and Supplementary Data” for additional information.
Market Environment and Opportunities
As a leading financial security company, we believe we are well positioned to benefit from significant demographic, governmental and market trends, including the following:
| • | Aging U.S. population with growing retirement income needs. The percentage of the U.S. population aged 55 or older is expected to increase from approximately 22%, or 65 million, in 2004 to more than 29%, or 97 million, by 2020 according to the U.S. Census Bureau. Life expectancy has risen to 74.8 years for men and 79.6 years for women, according to the U.S. Social Security Administration, and further increases are projected. For a married couple, each aged 65, there is a 50% likelihood that one will survive to age 91 and a 25% chance that one will survive to 95, according to Society of Actuary tables. Meanwhile, fewer companies are offering defined benefit plans than in the past, and the Social Security Administration in 2006 projected that its reserves could be exhausted by 2040, potentially creating the need for individuals to identify alternate sources of retirement income. U.S. savings rates overall are at historic lows, according to the U.S. Commerce Department’s Bureau of Economic Analysis and the nation’s personal savings rate in December 2006 was a negative $116.6 billion. We believe this phenomenon will lead to increased demand for innovative investment, insurance and income distribution products of the type we currently offer and are developing. For those with accumulated wealth, especially among people within 10 years of retirement or within the first five years of retirement, approximately $6.6 trillion of financial assets are now held, with the vast majority of these expected to be invested to meet income needs, according to a survey conducted by SRI Consulting Business Intelligence in 2004. We believe these trends will also increase demand for wealth accumulation offerings, income distribution solutions, and long-term care insurance as part of a |
4
| responsible financial plan. Similar trends are occurring globally, as populations age, and we see opportunity to expand our retirement income and wealth accumulation offerings to countries outside the U.S. |
| • | Growing lifestyle protection gap. The aging U.S. and world population, coupled with other factors such as the decline in defined benefit plans in the U.S., is creating a significant lifestyle protection gap for many individuals. A growing number of individuals have insufficient resources, including insurance coverage, to ensure that assets and income will be adequate to support desired lifestyles. Declining savings rates, rising healthcare and nursing care costs, and shifting burdens for funding protection needs from governments and employers to individuals, are contributing to this gap. Many individuals are facing increased personal debt levels, with limited or no resources to manage against unforeseen events. We expect these trends to drive increased demand for life and long-term care insurance and linked benefit products we offer, as well as for our asset accumulation and managed money products and services and income distribution offerings. |
| • | Increasing opportunities for mortgage insurance internationally and in the U.S. We expect that increasing homeownership and other factors in the U.S., Canada, Australia and Europe will contribute to the growing use of mortgage insurance related services. Globally, government housing policies and demographic factors are driving demand for housing, particularly among underserved minority and immigrant populations. These needs are being met through the expansion of low-down-payment mortgage loan offerings; legislative and regulatory policies that provide capital incentives for lenders to transfer risk to mortgage insurers; a new U.S. law making qualified mortgage insurance payments deductible for income taxes in 2007; and expansion of secondary mortgage markets that require credit enhancements such as mortgage insurance. A number of these factors also are emerging in some European, Latin American and Asian markets, where lenders increasingly are using mortgage insurance to manage the risks of loan portfolios and to expand low-down-payment lending. |
Competitive Strengths
We believe the following competitive strengths will enable us to capitalize on opportunities in our targeted markets:
| • | Leading positions in diversified targeted markets. We believe our leading positions in life and long-term care insurance; retirement income and managed money services; payment protection insurance in Europe; and international mortgage insurance, provide us with a strong and differentiated base of business that enables us to compete effectively in these markets as they grow. We also believe our strong presence in multiple markets provides a diversified and balanced base of business, reduces our exposure to adverse economic trends affecting any one market and provides stable cash flow to fund growth opportunities. |
| • | Product innovation and breadth, plus service offerings. We continue to innovate and offer a breadth of products that meet the needs of consumers through various stages of their lives, and that are positioned to benefit from current trends among distributors to limit the number of insurers with which they maintain relationships to those with the highest value-added product and service content. Our service content includes targeted educational and support offerings, including certified courses for distributors, and consumer programs such as wellness information, medical screenings, care coordination and other services that complement our insurance offerings. We strive to maintain appropriate return and risk thresholds when we expand the scope of our product offerings. |
| • | Extensive, multi-channel distribution network. We have extensive distribution reach across a broad network of financial intermediaries, independent producers and dedicated sales specialists. We maintain strong relationships with leading distributors by providing a high level of specialized and differentiated support, technology and service solutions to enhance their sales efforts. |
| • | Innovative capital markets solutions. We believe we are an industry leader in developing capital markets solutions and investment products that allow us to use capital more efficiently and increase our |
5
| returns, manage risk and support new business models. In 2003, we were the first company to securitize statutory term life insurance reserves (“XXX securitizations”) and we were again the first company, in 2006, to create a similar solution for universal life insurance reserves (“AXXX securitization”). |
| • | Technology-enhanced, service-oriented, scalable, low-cost operating platform. We actively manage costs and drive continuous customer service improvement. We use technology to enhance performance by automating key processes to reduce response times and process variations. In addition, we have centralized operations and established scalable, low-cost operating centers in Virginia, North Carolina and Ireland. We also outsource a variety of back office support services to a team of professional service providers in India. |
| • | Disciplined risk management with strong compliance practices. Risk management and regulatory compliance are critical to our business. We employ comprehensive risk management processes in virtually every aspect of our operations, including product development, underwriting, investment management, asset-liability management and technology development programs. |
| • | Strong balance sheet and high-quality investment portfolio. We believe our size, ratings and capital strength provide us with a competitive advantage. We have a diversified, high-quality portfolio with $71.9 billion of cash and invested assets as of December 31, 2006. Approximately 95% of our fixed maturities had ratings equivalent to investment-grade, and less than 1% of our total investment portfolio consisted of equity securities. We actively conduct asset-liability management, and we are expanding use of the capital markets to more effectively enhance portfolio returns. |
| • | Experienced management team. We have an established track record for successfully developing managerial talent at all levels and have instilled a performance- and execution-oriented corporate culture. |
Growth Strategies
Our objective is to increase targeted revenues and operating income, and enhance returns on equity. We do this by focusing on the following strategies:
| • | Capitalize on attractive growth prospects in key markets: |
Retirement planning, money management and retirement income. We believe growth will be driven by favorable demographic trends and products designed to help customers accumulate assets and convert them into reliable income throughout their retirement years or other desired periods.
Protection, including life and long-term care insurance as well as payment protection insurance. In life insurance, we believe growth will be driven by the significant protection gaps among individuals and families. In long-term care insurance, we believe growth will be driven by the increasing needs of an expanding, aging population and the shifting burden for funding these needs from government programs and corporations to individuals. We also believe consumers will increasingly seek linked benefit products that deliver value under multiple scenarios. In payment protection insurance, we believe growth will result from increasing consumer borrowing in Europe, expansion of the European Union, reduced unemployment benefits in key European markets and our expansion beyond Europe.
U.S. Mortgage Insurance. We believe that demographics supporting the U.S. housing market remain strong, with continued strength in the first-time homebuyers’ market, which includes ongoing growth in emerging market household formation and homeownership. We believe this demographic trend will drive continued increases in high loan-to-value debt. We also believe that various market forces, including recently issued guidance from U.S. federal financial regulators to financial institutions on risks related to non-traditional mortgages, may help increase the use of fixed rate mortgages and the use of our mortgage insurance products.
International. We continue to see attractive growth opportunities in international mortgage insurance as homeownership and the use of low-down-payment lending expands globally. Our international mortgage insurance and payment protection insurance businesses have established business
6
relationships or licenses in multiple countries in North America, Australia, Europe, India and Asia. Net premiums written in our international mortgage insurance business have grown at a 31% compounded annual growth rate for the three years ended December 31, 2006. We also believe global markets will present increasing opportunities for other product expansion beyond mortgage and payment protection insurance, as populations age and consumers seek products that help them achieve financial security.
| • | Further strengthen and extend our distribution channels. We intend to grow distribution by continuing to differentiate in areas where we believe we have distinct competitive advantages. These areas include: |
Product and service innovations. Examples include the introduction of a number of products including ClearCourse® for the retirement plan market, our global medium term notes (“GMTN”) product for institutional investors, return of premium term products, our Income Distribution Series of variable annuity products and riders, our linked benefit products for customers who traditionally self-funded long-term care expenses, our HomeOpeners® mortgage insurance products designed to attract first-time home buyers, and private mortgage insurance products in the European market. Additional service innovations include programs such as automated underwriting in our life, long-term care and mortgage insurance businesses, dedicated customer service teams, and customer care programs supporting wellness and homeownership.
Collaborative approach to key distributors. Our collaborative approach to key distributors includes our strong support and educational offerings of consultative selling practices, joint business improvement programs and tailored approach to sales intermediaries addressing their unique service needs. Additionally, we are expanding product and service offerings broadly in the financial advisor and managed money arena as we combine our asset accumulation businesses under the leadership of the recently acquired AssetMark Investment Services, Inc. (“AssetMark”).
Technology initiatives. These include proprietary underwriting systems, which make it easier for distributors to do business with us, improved our term life, long-term care and mortgage insurance underwriting speed and accuracy, and lowered our operating costs.
| • | Enhance returns on capital and increase margins. We employ five levers to drive higher returns on capital and increase margins. These levers include: |
Adding new business at targeted returns and optimizing mix. We have introduced new products, revised pricing and targeted higher return distribution channels in multiple business lines to increase returns. For example, we leverage our international platforms for faster growth in markets in which we are generating our highest returns. In our U.S. mortgage insurance business, we are shifting our overall new business mix to distribution segments that do not use captive reinsurance, and therefore offer higher returns, and also benefit from our service-oriented marketing approach. In our retirement business, we have shifted capital to higher return, fee-based products and in 2006 nearly tripled total fee-based assets under management to almost $22 billion, including assets related to the acquisition of AssetMark. Assets under management from products and platforms not including AssetMark were up 60% to $12.2 billion at December 31, 2006 as compared to December 31, 2005.
Capital generation and redeployment. We generate significant statutory capital from in-force business and capital efficiency projects, which we then actively redeploy to new business and acquisitions. We also consider share repurchases or dividend increases as alternative capital uses when we do not see additional opportunities to fund growth. We have a number of blocks of business with low returns including some of our retail and institutional spread-based products, older blocks of long-term care insurance and some excess contingency reserves backing our U.S. mortgage insurance business. In 2006, we released a significant amount of capital supporting these lines, including capital released from the maturity of older issued fixed annuities and GICs and the release of approximately $300 million of statutory contingency reserves. Additionally, we expect to receive gross cash proceeds of approximately $650 million by mid-year 2007 upon completion of the pending sale of our group life and health business.
7
Targeted use of capital markets. We continue to make progress in using the capital markets to optimize capital efficiency and manage risk. In 2006, we were the first life insurer to complete a securitization of Regulation AXXX reserves for universal life insurance, and we continued our leadership in securitizing reserves for term life insurance. During 2006, we completed nearly $1.4 billion of term and universal life insurance reserve securitizations.
Operating cost reductions and efficiencies. We focus on reducing our cost base while maintaining strong service levels. We are currently engaged in cost studies to identify significant opportunities for improved efficiency and functional consolidation to enhance growth and improve margins, based on our recently announced organizational realignment, described below.
Investment income enhancements. We seek to enhance investment yields by evaluating and gradually repositioning our asset class mix, pursuing additional investment classes, using active management strategies, implementing best in class technology and hiring key experienced professionals in portfolio management, investments innovations and risk to significantly enhance our flexibility and overall capabilities. In 2006, we expanded our private placement and real estate portfolios to take advantage of the liquidity premium that works well with many of our longer duration product lines. We expect our investment portfolios to make a measurable contribution to Genworth’s return on equity progression over the next several years.
Reorganization
In January 2007, we reorganized our businesses into three new operating segments: Retirement and Protection, International and U.S. Mortgage Insurance. The reorganization is intended to more directly align high-growth retirement and protection and international business opportunities. The Retirement and Protection segment will include the retirement income, managed money, life insurance, long-term care insurance, and institutional businesses. The International segment will include the non-U.S. mortgage insurance and payment protection insurance businesses. The U.S. Mortgage Insurance segment will consist of the U.S. mortgage insurance business. We will continue to have Corporate and Other activities, which consist primarily of unallocated corporate income and expenses, the results of a small, non-core business that is managed outside the operating segments, and most of the interest and other financing expenses.
Protection
In our Protection segment, we have the following business units: life insurance, long-term care insurance, payment protection insurance and group life and health insurance. Effective January 1, 2006, our Mexico-domiciled insurer, previously included in Corporate and Other, is now being managed within our Protection segment and whose results are now included as part of the payment protection insurance business for all periods presented. Additionally, as discussed further herein, on January 10, 2007, we agreed to sell our group life and health insurance business. We expect to account for this business as part of discontinued operations beginning in the first quarter of 2007.
8
The following table sets forth financial information regarding our Protection segment as of or for the years ended December 31, 2006, 2005 and 2004. For additional selected financial information and operating performance measures regarding our Protection segment as of or for these periods, see “Item 7—Management’s Discussion and Analysis of Financial Condition and Results of Operations—Protection.”
| As of or for the years ended December 31, | |||||||||
| (Amounts in millions) |
2006 | 2005 | 2004 | ||||||
| Revenues |
|||||||||
| Life insurance |
$ | 1,807 | $ | 1,623 | $ | 1,518 | |||
| Long-term care insurance |
2,626 | 2,347 | 2,311 | ||||||
| Payment protection insurance |
1,284 | 1,492 | 1,602 | ||||||
| Group life and health insurance |
743 | 717 | 686 | ||||||
| Total revenues |
$ | 6,460 | $ | 6,179 | $ | 6,117 | |||
| Segment net operating income |
|||||||||
| Life insurance |
$ | 313 | $ | 275 | $ | 245 | |||
| Long-term care insurance |
153 | 172 | 172 | ||||||
| Payment protection insurance |
113 | 90 | 83 | ||||||
| Group life and health insurance |
35 | 31 | 30 | ||||||
| Total segment net operating income |
614 | 568 | 530 | ||||||
| Net investment gains (losses), net of taxes and other adjustments |
4 | — | — | ||||||
| Total segment net income |
$ | 618 | $ | 568 | $ | 530 | |||
| Total segment assets |
$ | 38,653 | $ | 33,945 | $ | 31,870 | |||
Life insurance
Our life insurance business markets and sells term and universal life insurance products that provide a personal financial safety net for individuals and their families. These products provide protection against financial hardship after the death of an insured by providing cash payments to the beneficiaries of the policyholder. Some types of life insurance also offer a savings element that can be used to help accumulate funds to meet future financial needs. Our life insurance business also includes a runoff block of whole life insurance. According to the American Council of Life Insurers, sales of new life insurance coverage in the U.S. were $3.0 trillion in 2005, and total life insurance coverage in the U.S. was $18.4 trillion as of December 31, 2005. Excluding variable life insurance sales, annualized first-year premiums for life insurance increased by an average of 12% per year from 2001 to 2006, according to LIMRA International.
Our principal life insurance products are term life and universal life. Term life provides life insurance coverage with guaranteed level premiums for a specified period of time and generally has little or no buildup of cash value that is payable upon lapse of the coverage. We have been a leading provider of term life insurance for more than two decades, and we are also a leading provider of term life insurance through brokerage general agencies (“BGA”) in the U.S.
Universal life insurance products are designed to provide permanent protection for the life of the insured and may include a buildup of cash value that can be used to meet particular financial needs during the policyholder’s lifetime.
We price our insurance policies based primarily upon the historical experience of our large block of business. Our pricing strategy is to target individuals in preferred risk categories and offer them attractive products at competitive prices. Preferred risks include healthier individuals who generally have family histories that do not present increased mortality risk. We also have significant expertise in evaluating people with health problems and offer appropriately priced coverage for people who meet our underwriting criteria.
9
Effective underwriting and pricing are significant drivers of profitability in our life insurance business, and we have established rigorous underwriting and pricing practices to maximize our profitability. We retain most of the risk we currently underwrite, thereby limiting the premiums ceded to reinsurers. We have generally reinsured risks in excess of $1 million per life. Beginning January 1, 2007, we increased our retention limit to $5 million for new policies written, but may, from time-to-time, reinsure any risk depending on the pricing terms of available reinsurance. We set pricing assumptions for expected claims, lapses, investment returns, expenses and customer demographics based on our own relevant experience and other factors.
We offer our life insurance products through an extensive network of independent BGA located throughout the U.S. and through affluent market producer groups, financial intermediaries, and insurance marketing organizations. We believe there are opportunities to expand our sales through each of these and other distribution channels.
Competition in our life insurance business comes from many sources, including from many traditional insurance companies as well as from non-traditional sources, such as banks and the capital markets. The life insurance market is highly fragmented, with the top 10 term life insurance companies having approximately 33% of industry sales and the top 10 universal life insurance companies having approximately 42% of industry sales based on LIMRA International data for 2006. Competitors have multiple access points to the market through BGA, financial institutions, career sales agents, multi-line exclusive agents, e-retail and other life insurance distributors. We operate predominantly in the BGA channel and are building out our capabilities in other channels. Term life insurance competition is highly price and service driven while universal life insurance is more product, service and feature driven. We believe our competitive advantage in the term life insurance market comes from our long history serving this market, our service excellence, underwriting expertise and capital markets leadership. We are currently building out our universal life insurance product suite and have executed the first capital markets solution for funding statutory reserves associated with the Valuation of Life Policies Regulation, as clarified by Actuarial Guideline 38 (more commonly known as “Regulation AXXX”).
Long-term care insurance
We established ourselves as a pioneer in long-term care insurance over 30 years ago. Since that time, we have accumulated extensive pricing and claims experience, which we believe has enabled us to build what is the largest actuarial database in the industry. Our experience helps us plan for disciplined growth built on a foundation of strong risk management, product innovation and a diversified distribution strategy. Our individual and group long-term care insurance products provide defined amounts of protection against the high and escalating costs of long-term care provided in the insured’s home and in assisted living and nursing facilities. Insureds become eligible for certain covered benefits when they are incapable of performing certain activities of daily living or when they become cognitively impaired. In contrast to health insurance, long-term care insurance provides coverage for skilled and custodial care provided outside of a hospital or health-related facility. The typical claim has a duration of approximately 1 to 4 years.
The overall profitability of our long-term care insurance policies depends to a large extent on the degree to which our claims experience, morbidity and mortality experience, lapse rates and investment yields match our pricing assumptions. We believe we have the largest actuarial database in the industry, derived from over 30 years of experience in offering long-term care insurance products. This database has provided substantial claims experience and statistics regarding morbidity risk, which has helped us to develop a sophisticated pricing methodology for our newer policies tailored to segmented risk categories, depending upon marital status, medical history and other factors. When we issued our older policies, we did not have the full benefit of this experience and pricing methodology and assumed higher than realized lapse rates and a stable investment yield environment. As a result, profitability on our older issued policies has been lower than we originally priced. We continually monitor trends and developments and update assumptions that may affect the risk, pricing and profitability of our long-term care insurance products and adjust our new product pricing and other terms as appropriate. We also
10
work with a Medical Advisory Board, comprising independent experts from the medical technology and public policy fields, that provides insights on emerging morbidity and medical trends, enabling us to be more proactive in our risk segmentation, pricing and product development strategies.
In 2006, we introduced a series of product upgrades designed to provide a variety of pricing and benefit options, enhance service capabilities, broaden types of coverage and simplify individual product features. In this connection, we expanded our group long-term care insurance business. We also launched linked benefit products for customers who traditionally self-funded long-term care expenses and expanded our Medicare supplement product in a majority of states and have seen growth in these new states. To further expand our senior supplementary product capabilities, we acquired Continental Life Insurance Company of Brentwood, Tennessee (“Continental Life”), in the second quarter of 2006, for $145 million, plus additional contingent payments of up to $10 million. Through the acquisition of Continental Life, we acquired additional expertise in Medicare supplement offerings and access to extensive independent brokerage distribution. This acquisition more than doubles our existing annualized Medicare supplement premium in-force and provides a platform for expanding in other senior supplementary products.
Competition in the long-term care insurance industry is primarily limited to the top 10 insurance companies. In addition, we compete with non-insurance alternatives to funding long-term care needs. Such alternatives, among others, include government programs such as Medicaid designed for the impoverished, continuing care retirement communities, and reliance on family members to provide for care. Our product competes by providing peace of mind and independence to our policyholder and effectively reducing the family burden associated with other care alternatives. We believe our significant historical experience and risk disciplines provide us with a competitive advantage in the form of sound product pricing and company stability.
In addition, we have a broad and diverse distribution network for our products. We distribute our products through diversified sales channels consisting of approximately 130,000 appointed independent producers, financial intermediaries and 1,200 dedicated sales specialists. Approximately 200 employees support these diversified distribution channels. We have made significant investments in our servicing and support for both independent and dedicated sales specialists and we believe our product features, distribution support and services are leading the industry.
Payment protection insurance
Payment protection insurance helps consumers meet their payment obligations on outstanding financial commitments, such as mortgages, personal loans or credit cards, in the event of a misfortune such as illness, accident, involuntary unemployment, temporary incapacity, permanent disability or death. We currently provide this insurance in more than 15 countries. We continually look to pursue new markets for further expansion.
Our payment protection insurance currently is underwritten and priced on a program basis, by type of product and by distributor, rather than an individual policyholder basis. In setting prices, we take into account the underlying obligation, the particular product features and the average customer profile of the distributor. We believe our experience in underwriting allows us to provide competitive pricing to distributors and generate targeted returns and profits for our business.
We distribute our payment protection products primarily through financial institutions, such as major European banks, which offer our insurance products in connection with underlying loans or other financial products they sell to their customers. Under these arrangements, the distributors typically take responsibility for branding and marketing the products, allowing us to take advantage of their distribution capabilities, while we take responsibility for pricing, underwriting and claims payment.
The payment protection insurance market has several large, highly rated international participants who provide these products and services through financial institutions and ultimately to their customers. We compete through our commitment to high service levels, depth of expertise in providing tailored product and service solutions and our ability to service global clients at a local level for their customers.
11
We continue to implement innovative methods for distributing our payment protection insurance products, including using web-based tools that provide our distributors with a cost-effective means of applying and selling our products in combination with a broad range of underlying financial products. We believe these innovative methods also will make it easier to establish arrangements with new distributors.
Our payment protection business also includes a small Mexican property and casualty insurance business. This business provides motor vehicle coverage for personal and commercial domestic vehicles, personal coverage for tourist vehicles and a small amount of homeowners’, commercial property, transport and life insurance through independent agents in Mexico and, for the tourist auto business, through agents located in key U.S. border locations.
Group life and health insurance
We offer a range of employment-based benefit products and services targeted primarily at employers with fewer than 1,000 employees, as well as select groups within larger companies that require highly customized benefit plans. On January 10, 2007, we entered into a Stock Purchase Agreement, whereby we have agreed to sell our group life and health insurance business for $650 million in cash in order to concentrate our resources on areas where we believe we have more competitive advantage. We expect to account for this business as part of discontinued operations beginning in the first quarter of 2007. The closing is expected to occur in the second quarter of 2007.
Retirement Income and Investments
Overview
Through our Retirement Income and Investments segment, we offer customers various forms of wealth accumulation, income distribution and institutional investment products. These products include managed money products and services, variable annuities, single premium immediate annuities and fixed annuities. We also offer specialized products, including FABNs, funding agreements and GICs. In 2007, we began offering a second FABN program. This program is a GMTN program and primarily targets non-U.S. investors. We sell these specialized products to institutional customers for investments in retirement plans, money market funds and other investment purposes. Overall, we look to improve spreads on our spread-based products and expand our presence in fee-based products.
In connection with our emphasis to expand our fee-based business, in October 2006, we acquired AssetMark. AssetMark is a leading provider of open architecture asset management solutions to independent financial advisors, with approximately $9 billion in assets under management. The AssetMark acquisition increases our third-party assets under management to over $17 billion.
12
The following table sets forth financial information regarding our Retirement Income and Investments segment as of or for the years ended December 31, 2006, 2005 and 2004. Additional selected financial information and operating performance metrics regarding our Retirement Income and Investments segment as of or for the years ended December 31, 2006, 2005 and 2004 are included under “Item 7—Management’s Discussion and Analysis of Financial Condition and Results of Operations Retirement Income and Investments.”
| As of or for the years ended December 31, | ||||||||||
| (Amounts in millions) |
2006 | 2005 | 2004 | |||||||
| Revenues |
||||||||||
| Spread-based retail products |
$ | 2,012 | $ | 2,224 | $ | 2,712 | ||||
| Fee-based products |
348 | 246 | 317 | |||||||
| Spread-based institutional products |
572 | 442 | 332 | |||||||
| Total revenues |
$ | 2,932 | $ | 2,912 | $ | 3,361 | ||||
| Segment net operating income |
||||||||||
| Spread-based retail products |
$ | 119 | $ | 151 | $ | 79 | ||||
| Fee-based products |
76 | 59 | 44 | |||||||
| Spread-based institutional products |
42 | 37 | 30 | |||||||
| Total segment net operating income |
237 | 247 | 153 | |||||||
| Net investment gains (losses), net of taxes and other adjustments |
(34 | ) | — | — | ||||||
| Total segment net income |
$ | 203 | $ | 247 | $ | 153 | ||||
| Total segment assets |
$ | 59,391 | $ | 58,281 | $ | 56,610 | ||||
Products
Fee-based products
Managed Money
We offer asset management services to affluent individual investors. Through our affiliated retail broker/dealers, we offer annuity and insurance products, including our proprietary products, as well as third-party mutual funds and other investment products. Most of our clients for these products and services have accumulated significant capital, and our principal asset management strategy is to help protect their assets while taking advantage of opportunities for capital appreciation. Our asset management clients are referred to us through financial advisers and we work with these advisers to develop portfolios consisting of individual securities, mutual funds (including our own proprietary funds), exchange traded funds and variable annuities designed to meet each client’s particular investment objectives. For each of these products we receive a management fee based upon the amount of assets under management.
For the managed money market, the 10 largest companies comprise over 75% of the market based on the fourth quarter 2006 Managed Account Research published by Cerulli Associates (“Cerulli Research”). This market is highly competitive, where service, convenience, product offerings and price differentiate competitors in the marketplace. We have targeted to compete primarily in the managed account service provider market, otherwise known as the turnkey asset management platform market. We provide client advice, asset allocation, products and prepackaged support, services and technology to the independent advisor channel. Since many of our associates have previous experience in this channel, we have been able to effectively tailor our products and services to meet their needs. This has been a competitive advantage as we have seen double-digit organic growth in the last few years.
We have expanded our presence in the turnkey asset management platform market through the acquisition of AssetMark. The combined resources of Genworth Financial Asset Management (“GFAM”) and AssetMark,
13
will provide us with the opportunity to become a leading competitor in the turnkey asset management platform marketplace. As of December 31, 2006, we were ranked third by the Cerulli Research in the turnkey asset management platform market with more than 85,000 accounts and $17.2 billion of assets under management. We distribute these products and services through more than 4,000 independent investment advisory professionals and more than 2,400 financial professionals affiliated with our retail broker/dealers.
Variable annuities
We offer variable annuities that allow the contractholder to make payments into a separate account that is divided into sub accounts that invest in underlying investments. The contractholder also has an option to make allocations to a guaranteed interest-rate account that is a part of our general account. All allocations are determined by the contractholder. Like a deferred fixed annuity, a variable annuity has an accumulation period and a payout period. The main difference between our fixed annuity products and our variable annuity products is that the variable annuities allow the contractholder to allocate all or a portion of his account value to separate accounts that invest in investment accounts that are distinct from our general account. Assets allocated to each separate account have sub accounts that track the performance of selected investments. Except as described below, there is no guaranteed minimum rate of return in these sub accounts, and the contractholder bears the entire risk associated with the performance of these sub accounts. Some of our variable annuities also permit the contractholder to allocate all or a portion of his account value to our general account, in which case we credit interest at specified rates, subject to certain guaranteed minimums.
Variable annuities provide us with fee-based revenue in the form of expense and risk charges and, in some cases, mortality charges. The fees equal a percentage of the contractholder’s assets in the separate account and typically range from 0.75% to 2.45% per annum depending on the features and options within a contract. We also receive fees charged on assets allocated to our separate account to cover administrative costs and, in some cases, a distribution fee from the underlying investments in which assets are invested.
Our variable annuity contracts generally provide a basic guaranteed minimum death benefit (“GMDB”), which provides a minimum account value to be paid upon the annuitant’s death. Contractholders also have the option to purchase through riders, at an additional charge, enhanced death benefits. Assuming every annuitant died on December 31, 2006, as of that date, contracts with death benefit features not covered by reinsurance had an account value of $4.2 billion and a related death benefit exposure of $15 million net amount at risk.
Our Income Distribution Series of variable annuity products and riders provides the contractholder with a guaranteed minimum income stream that they cannot outlive, along with an opportunity to participate in market appreciation, but reduce some of the risks to insurers that generally accompany traditional products with guaranteed minimum income benefits. We are targeting people who are focused on building a personal portable retirement plan or are moving from the accumulation to the distribution phase of their retirement planning.
With many employers moving away from traditional defined benefit pension plans to retirement plans, in October 2005 we responded by introducing ClearCourse®, a group variable annuity. ClearCourse® is designed to be an investment option within a retirement plan. It offers participants the ability to build guaranteed retirement income while maintaining liquidity and growth potential. ClearCourse® provides participants with the ability to access defined benefit-like features within a defined contribution environment and is distributed via direct salespeople and through defined contribution plan record keepers. As of December 31, 2006, five plan sponsors have selected ClearCourse® as an investment option for their retirement plans. In addition, we are working with three record keepers to make ClearCourse® available as part of their standard service offering. We anticipate these arrangements to be operational in 2007. We continue to see strong interest from plan sponsors and record keepers.
There are numerous competitors in this market segment within all major distribution channels that we sell through—banks, national stockbrokerage firms and independent broker/dealers. We have focused on “income
14
distribution” products, where we believe consumers are seeking value and where we offer a broad array of products allowing consumers to opt for lifetime income beginning immediately or deferring until such time as they wish to access the income stream. We have been an early mover in this market space and we believe we are well positioned to compete.
Institutional Asset Management Services
Through an arrangement with GE Asset Management Incorporated (“GEAM”), we offer a broad range of institutional asset management services to third parties. Until December 31, 2006, we managed a pool of municipal GICs issued by affiliates of GE. As of January 1, 2007, we now provide transition and consulting services to the GE affiliates for their municipal GICs through December 31, 2008. For additional details on these arrangements, see note 17 to our consolidated financial statements under “Item 8—Financial Statements and Supplementary Data.”
Spread-based retail products
Single premium immediate annuities
In exchange for a single premium immediate annuities provide a fixed amount of income for either a defined number of years, the annuitant’s lifetime, or the longer of the defined number of years or the annuitant’s life. Income can be paid monthly, quarterly, semi-annually or annually and generally begins within one year of receipt of the premium. Fixed immediate annuities also include annuitizations chosen as a settlement option for an existing deferred annuity contract.
We compete with a large number of life insurance companies in the single premium immediate annuity marketplace, with the top ten representing more than half the market. We continue to see long-term growth prospects for single premium immediate annuities based both on demographics and government policy trends that favor a greater role for private solutions in meeting long-term retirement needs. We believe long-term experience with mortality and longevity, combined with disciplined risk management, provide competitive advantages in how we segment and price our products.
Fixed annuities
We offer fixed single premium deferred annuities (“SPDAs”) which provide for a single premium payment at time of issue, an accumulation period and an annuity payout period at some future date. During the accumulation period, we credit the account value of the annuity with interest earned at an interest rate, called the crediting rate. The crediting rate is guaranteed generally for one year at issue, but may be guaranteed for up to seven years, at the contractholders’ option, and thereafter is subject to annual changes at our discretion, based upon competitive factors, prevailing market rates and product profitability. Each contract also has a minimum guaranteed crediting rate. The majority of our fixed annuity contracts are funded by our general account, and the accrual of interest during the accumulation period is generally on a tax-deferred basis to the owner. The majority of our fixed annuity contractholders retain their contracts for 5 to 10 years. After the period specified in the annuity contract, the contractholder may elect to take the proceeds of the annuity as a single payment or over time.
For fixed annuities, we leverage long-term bank relationships that allow us to maintain the “shelf space” needed to succeed in this highly competitive industry. Sales of fixed annuities are strongly linked with the interest rate environment and its impact on the relative competitiveness of alternative products, such as certificates of deposit and money market funds. Therefore, we have seen variability in sales levels for this product, and expect this to continue in the future, as we continue to maintain pricing discipline to target return levels through varying interest rate environments.
15
Structured settlements
Structured settlement annuity contracts provide an alternative to a lump sum settlement, generally in a personal injury lawsuit or workers compensation claim, and typically are purchased by property and casualty insurance companies for the benefit of an injured claimant. The structured settlements provide scheduled payments over a fixed period or, in the case of a life-contingent structured settlement, for the life of the claimant with a guaranteed minimum period of payments. In the third quarter of 2006, we decided to discontinue sales of our structured settlement annuities while continuing to service our retained and reinsured blocks of business.
Spread-based institutional products
We offer FABNs, funding agreements and GICs that are deposit-type products that pay a guaranteed return to the contractholder on specified dates. GICs are purchased by ERISA qualified plans, including pension and 401(k) plans. Funding agreements are purchased by institutional accredited investors for various kinds of funds and accounts that are not ERISA qualified. Purchasers of funding agreements include money market funds, bank common trust funds and other corporate and trust accounts and private investors including Genworth Global Funding Trusts and Genworth Life Institutional Funding Trust as part of our FABN programs.
Our funding agreements generally credit interest on deposits at a floating rate tied to an external market index and we generally invest the proceeds in floating-rate assets. When we issue fixed rate funding agreements, we may enter into counterparty “swap” arrangements where we exchange our fixed rate interest payment for a floating rate that is tied to an index in order to correlate to the floating-rate assets. Some of our funding agreements are purchased by money market funds, bank common trust funds and other short-term investors.
We also issue funding agreements to trust accounts to back medium-term notes purchased by investors. These contracts typically are issued for terms of one to seven years.
Substantially all of our GICs allow for the payment of benefits at contract value to ERISA plan participants prior to contract maturity in the event of death, disability, retirement or change in investment election. We carefully underwrite these risks before issuing a GIC to a plan and historically have been able to effectively manage our exposure to these benefit payments. Our GICs typically credit interest at a fixed interest rate and have a fixed maturity generally ranging from two to six years.
We compete with other large, highly rated insurance companies in these institutional markets. Our credit quality, both long- and short-term, liquidity and price differentiate us in these markets. Substantially all of our GICs allow for the payment of benefits at contract value to ERISA plan participants prior to contract maturity in the event of death, disability, retirement or change in investment election. We carefully underwrite these risks before issuing a GIC to a plan and historically have been able to effectively manage our exposure to these benefit payments. Our GICs typically credit interest at a fixed interest rate and have a fixed maturity generally ranging from two to six years. These contracts are sold both directly and through investment managers. We place our funding agreements directly and through specialized brokers. We launched two proprietary funding agreement-backed note programs that provide us with lower cost of funds in global markets. Our SEC registered note program was launched in 2005 and our GMTN program was launched in January 2007. Both of these products are distributed through investment banks. We approach these markets opportunistically and will only issue new business when we can achieve targeted returns and maintain an appropriate mix of institutional and retail businesses. Our approach may cause significant fluctuations in new deposits as we will issue new business when spreads are favorable and may issue no new business when rates are not favorable.
Mortgage Insurance
Overview
Through our Mortgage Insurance segment, we currently provide mortgage insurance in the U.S., Canada, Australia, New Zealand, Mexico, Japan and multiple European countries, while we continue to pursue new markets for further expansion.
16
Private mortgage insurance expands homeownership opportunities by enabling borrowers to buy homes with “low-down-payment mortgages,” which are usually defined as loans with a down payment of less than 20% of the home’s value. Low-down-payment mortgages are sometimes also referred to as high loan-to-value mortgages. Mortgage insurance products increase the funds available for residential mortgages by protecting mortgage lenders and investors against loss in the event of a borrower’s default. These products generally also aid financial institutions in managing their capital efficiently by reducing the capital required for low-down-payment mortgages. If a borrower defaults on mortgage payments, private mortgage insurance reduces and, in some instances, eliminates the loss to the insured institution. Private mortgage insurance may also facilitate the sale of mortgage loans in the secondary mortgage market.
We have been providing mortgage insurance products and services in the U.S. since 1981 and operate in all 50 states in the U.S. and the District of Columbia. According to Inside Mortgage Finance, in 2006, we were the fourth-largest provider of mortgage insurance in the U.S., based on flow new insurance written. We expanded our operations internationally throughout the 1990s and today we believe we are the largest provider of mortgage insurance outside the U.S. In 2006, we were the leading provider in Australia based upon flow new insurance written and are the leading private mortgage insurer in Canada. We are a leading private mortgage insurance provider in Europe, based upon flow new insurance written, and have a growing presence in the developing private mortgage insurance markets in Mexico and Japan.
The following table sets forth selected financial information regarding our U.S. and international mortgage insurance business, as of or for the periods indicated. Additional selected financial information and operating performance measures regarding our Mortgage Insurance segment as of or for the years ended December 31, 2006, 2005 and 2004 are included under “Item 7—Management’s Discussion and Analysis of Financial Condition and Results of Operations.”
| As of or for the years ended December 31, | |||||||||
| (Amounts in millions) |
2006 | 2005 | 2004 | ||||||
| Total revenues |
|||||||||
| U.S. mortgage insurance |
$ | 651 | $ | 603 | $ | 609 | |||
| International mortgage insurance |
860 | 611 | 481 | ||||||
| Total revenues |
$ | 1,511 | $ | 1,214 | $ | 1,090 | |||
| Segment net operating income |
|||||||||
| U.S. mortgage insurance |
$ | 259 | $ | 238 | $ | 224 | |||
| International mortgage insurance |
355 | 269 | 202 | ||||||
| Total segment net operating income |
614 | 507 | 426 | ||||||
| Net investment (gain) losses, net of taxes and other adjustments |
4 | — | — | ||||||
| Total segment net income |
$ | 618 | $ | 507 | $ | 426 | |||
| Total segment assets |
$ | 8,456 | $ | 7,118 | $ | 6,428 | |||
U.S. mortgage insurance
Overview
The U.S. private mortgage insurance industry is defined in part by the requirements and practices of Fannie Mae, Freddie Mac and other large mortgage investors. Fannie Mae and Freddie Mac purchase residential mortgages from mortgage lenders and investors, as part of their governmental mandate to provide liquidity in the secondary mortgage market. Fannie Mae and Freddie Mac purchased approximately 28% for the years ended December 31, 2006 and 2005 and 31% for the year ended December 31, 2004 of all the mortgage loans originated in the U.S., according to statistics published by Inside Mortgage Finance. We believe the reduction in the percentage of mortgages purchased by Fannie Mae and Freddie Mac has reduced the market size for flow
17
private mortgage insurance. Mortgages or mortgage securities guaranteed or held by Fannie Mae or Freddie Mac totaled more than $3.9 trillion as of December 31, 2006, or approximately 39% of the total outstanding mortgage debt in the U.S. In connection with these activities, Fannie Mae and Freddie Mac also have established mortgage loan origination, documentation, servicing and selling requirements and standards for the loans they purchase. In addition, Fannie Mae’s and Freddie Mac’s mortgage insurance requirements include specified insurance coverage levels and minimum financial strength ratings, currently at least “AA-” by S&P and “Aa3” by Moody’s. Fannie Mae and Freddie Mac are “government-sponsored enterprises,” and we refer to them as the “GSEs.”
The GSEs may purchase mortgages with unpaid principal amounts up to a specified maximum. The maximum single-family principal balance loan limit eligible for purchase by the GSEs is called the “conforming loan limit.” It is currently $417,000 and subject to annual adjustment. Each GSE’s Congressional charter generally prohibits it from purchasing a mortgage where the loan-to-value ratio exceeds 80% of home value unless the portion of the unpaid principal balance of the mortgage which is in excess of 80% of the value of the property securing the mortgage is protected against default by lender recourse, participation or by a qualified insurer. As a result, high loan-to-value mortgages purchased by Fannie Mae or Freddie Mac generally are insured with private mortgage insurance. Fannie Mae and Freddie Mac purchased the majority of the flow loans we insured as of December 31, 2006.
The majority of our U.S. mortgage insurance policies provide default loss protection on a portion (typically 10% to 40%) of the balance of an individual mortgage loan. Most of our primary mortgage insurance policies are “flow” insurance policies, which cover individual loans at the time the loan is originated. We also enter into “bulk” insurance transactions with lenders and investors in selected instances, under which we insure a portfolio of loans for a negotiated price. Loans that we insure in bulk transactions with loan-to-value ratios above 80% also may have flow mortgage insurance coverage. Bulk insurance constituted 6% of our new risk written for the year ended December 31, 2006 and less than 1% of our new risk written for each of the years ended December 31, 2005 and 2004.
In addition to flow and bulk primary mortgage insurance, we have written a limited amount of mortgage insurance on a pool basis. Under pool insurance, the mortgage insurer provides coverage on a group of specified loans, typically for 100% of all losses on every loan in the portfolio, subject to an agreed aggregate loss limit.
Products and services
Primary mortgage insurance
Flow insurance. Flow insurance is primary mortgage insurance placed on an individual loan when the loan is originated. Our primary mortgage insurance covers default risk on first mortgage loans generally secured by one- to four-unit residential properties and can be used to protect mortgage lenders and investors from default on any type of residential mortgage loan instrument that we have approved. Our insurance covers a specified coverage percentage of a “claim amount” consisting of unpaid loan principal, delinquent interest and certain expenses associated with the default and subsequent foreclosure. As the insurer, we generally are required to pay the coverage percentage of a claim amount specified in the primary policy, but we also have the option to pay the lender an amount equal to the unpaid loan principal, delinquent interest and certain expenses incurred with the default and foreclosure, and acquire title to the property. In addition, the claim amount may be reduced or eliminated if the loss on the defaulted loan is reduced as a result of the lender’s disposition of the property. The lender selects the coverage percentage at the time the loan is originated, often to comply with investor requirements to reduce the loss exposure on loans purchased by the investor.
In connection with flow insurance, we perform fee-based contract underwriting services for mortgage lenders. The provision of underwriting services by mortgage insurers eliminates the duplicative lender and mortgage insurer underwriting activities and speeds the approval process. The principal contract underwriting service we provide is determining whether the data relating to a borrower and a proposed loan contained in a
18
mortgage loan application file complies with the lender’s loan underwriting guidelines or the investor’s loan purchase requirements. Under the terms of our contract underwriting agreements, we agree to indemnify the lender against losses incurred in the event we make material errors in determining whether loans processed by our contract underwriters meet specified underwriting or purchase criteria, subject to contractual limitations on liability. New risk written by our contract underwriters represented 20% of our new risk written for the year ended December 31, 2006, compared to 24% for both years ended December 31, 2005 and 2004.
We also participate in reinsurance programs in which we share portions of our U.S. mortgage insurance risk written on loans originated or purchased by lenders with captive reinsurance companies affiliated with these lenders. In return, we cede to the captive reinsurers an agreed portion of our gross premiums on flow insurance written. New insurance written through the bulk channel generally is not subject to these arrangements.
The following table sets forth selected financial information regarding our captive reinsurance arrangements, as of or for the periods indicated:
| As of or for the years ended December 31, |
|||||||||
| 2006 | 2005 | 2004 | |||||||
| Primary risk in-force subject to captive reinsurance arrangements, as a percentage of total primary risk in-force |
63 | % | 65 | % | 66 | % | |||
| Gross written premiums ceded pursuant to captive reinsurance arrangements, as a percentage of total gross written premiums |
23 | % | 24 | % | 24 | % | |||
| Primary new risk written subject to captive reinsurance arrangements, as a percentage of total primary new risk written |
58 | % | 61 | % | 70 | % | |||
We continue to develop innovative flow mortgage insurance products that are designed to attract first-time homebuyers and expand the scope of the traditional mortgage insurance market. For example, in 2004, we launched our HomeOpeners® products MonthlyPlus, PaymentPlus, LenderPlus and in 2006, Value 40. Our MonthlyPlus product combines a mortgage insurance policy with involuntary unemployment coverage on mortgage payments for a specified period of time in the event of involuntary job loss or accidental death. Our PaymentPlus and LenderPlus products are designed to compete with simultaneous second mortgages, as described below under “—Competition—Mortgage lenders and other investors.” Our Value 40 product offers mortgage insurance on loans by leveraging the combination of a 40-year term with a 10-year interest only period.
Bulk insurance. Under our primary bulk insurance, we insure a portfolio of loans in a single, bulk transaction. Generally, in our bulk insurance, the individual loans in the portfolio are insured to specified levels of coverage and there may be deductible provisions and aggregate loss limits applicable to all of the insured loans. We base the premium on our bulk insurance upon our evaluation of the overall risk of the insured loans included in a transaction and we negotiate the premium directly with the securitizer or other owner of the loans. Prior to 2006, the majority of our bulk insurance business was related to loans financed by lenders who participate in the mortgage programs sponsored by the Federal Home Loan Banks (“FHLBs”). In 2006, we increased our participation in the GSE low documentation, or Alt A, programs and began to provide bulk insurance on lender portfolios. With the recent issuance of guidance from U.S. federal financial regulators to financial institutions on risks related to non-traditional mortgage, specifically the identification of mortgage insurance as a risk mitigant, we believe there to be an incremental opportunity for the mortgage insurance industry to provide bulk insurance on lender portfolios. We have participated in this opportunity and expect to continue to participate where we can adequately assess the underlying risk and can achieve our targeted risk- adjusted returns. Premiums for bulk transactions generally are paid monthly by lenders, investors, or a securitization vehicle in connection with a securitization transaction or the sale of a loan portfolio.
The loans we insure in bulk transactions typically consist of prime credit-quality loans with loan-to-value ratios of 50% to 95%. We have generally avoided the sub-prime segments of the market because we believe
19
market pricing for mortgage insurance on sub-prime bulk transactions has not been adequate and we have had concerns regarding the volatility of this segment. However, we may consider insuring such loans in the future when we believe conditions would allow us to achieve our targeted risk-adjusted returns. Our mortgage insurance coverage levels in bulk transactions typically range from 10% to 50%. Loans that we insure in bulk transactions with loan-to-value ratios above 80% typically have flow mortgage insurance, written either by us or another private mortgage insurer, which helps mitigate our exposure under these transactions.
Pool insurance. Pool insurance generally covers the loss on a defaulted mortgage loan that either exceeds the claim payment under the primary coverage (if primary insurance is required on that loan) or the total loss (if that loan does not require primary insurance), in each case up to a stated aggregate loss limit on the pool. During 2005, we began writing pool insurance selectively for state housing finance agencies. In 2006, we began to write pool insurance on second lien mortgages, typically held in lender portfolios. These policies cover prime credit quality second lien mortgages and typically include aggregate stop loss provisions. We expect to continue to selectively participate where we can achieve our targeted risk-adjusted returns.
Customers
Our principal mortgage insurance customers are originators of residential mortgage loans, such as mortgage banks, savings institutions, commercial banks, mortgage brokers, credit unions and other lenders, who typically determine which mortgage insurer or insurers they will use for the placement of mortgage insurance written on loans they originate. To obtain primary insurance written on a flow basis, a mortgage lender must first apply for and receive from us a mortgage guaranty master policy. In our bulk business, our primary customers are large lending institutions, the GSEs (Fannie Mae/Freddie Mac) and lenders who participate in the mortgage programs sponsored by the FHLBs.
We are focused on expanding our presence throughout the mortgage loan market by providing superior customer sales support, product offerings designed to meet the specific needs of our customers, and technology products designed to enable customers to reduce costs and expand revenues. In addition, as discussed under “—Operations and Technology,” we have developed web-based technology services that enable our customers to interact more efficiently with us.
Underwriting and pricing
Loan applications for all loans we insure are reviewed to evaluate each individual borrower’s credit strength and history, the characteristics of the loan and the value of the underlying property.
We use “FICO” score as one indicator of a borrower’s credit quality. Fair Isaac Company, or “FICO”, developed the “FICO” credit scoring model to calculate a FICO score based upon a borrower’s credit history. The higher the credit score, the lower the likelihood that a borrower will default on a loan. FICO credit scores range up to 850, with a score of 620 or more generally viewed as a “prime” loan and a score below 620 generally viewed as a “sub-prime” loan. “A minus” loans generally are loans where the borrowers have FICO credit scores between 575 and 660, and where the borrower has a blemished credit history. As of December 31, 2006, on a risk in-force basis, approximately 92% of our primary insurance loans had FICO credit scores of at least 620, approximately 6% had FICO credit scores between 575 and 619, and approximately 2% had FICO scores of 574 or less.
Loan applications for flow mortgage insurance are reviewed by our employees directly as part of our traditional underwriting process or by our contract underwriters as we process mortgage loan applications requiring mortgage insurance. The majority of our mortgage lender customers underwrite loan applications for mortgage insurance under a delegated underwriting program, in which we permit approved lenders to commit us to insure loans using underwriting guidelines we have previously approved.
In underwriting bulk insurance transactions, we evaluate credit scores and loan characteristics of the loans in the portfolio and examine loan files on a sample basis. Each bulk transaction is assigned an overall claim rate based on a weighted average of the claim rates for each individual loan that comprises the transaction.
20
We also provide mortgage insurance for “Alt A” loans, which are originated under programs in which there is a reduced level of verification or disclosure of the borrower’s income or assets; “Interest Only” loans which allows the borrower flexibility to pay interest only, or to pay interest and as much principal as desired, during an initial period of time; and Payment Option Adjustable Rate Mortgages, which typically provides four payment options that a borrower may select for the first 5 years of a loan.
See selected financial information regarding our U.S. primary mortgage insurance loan portfolio in “Item 7—Management’s Discussion and Analysis of Financial Condition and Results of Operations.”
Distribution
We distribute our mortgage insurance products through our dedicated sales force of more than 100 employees located throughout the U.S. This sales force primarily markets to financial institutions and mortgage originators, which in turn offer mortgage insurance products to borrowers. In addition to our field sales force, we also distribute our products through a telephone sales force serving our smaller lenders, as well as through our “Action Center” which provides live phone and web chat-based support for all customer segments.
Competition
We compete primarily with U.S. and state government agencies, other private mortgage insurers, mortgage lenders and other investors, the GSEs and, potentially, the FHLBs. We also compete, indirectly, with structured transactions in the capital markets and with other financial instruments designed to mitigate credit risk.
U.S. and state government agencies. We and other private mortgage insurers compete for flow business directly with U.S. federal and state governmental and quasi-governmental agencies, principally the Federal Housing Administration (“FHA”) and, to a lesser degree, the Veteran’s Administration (“VA”).
In addition to competition from the FHA and the VA, we and other private mortgage insurers face competition from state-supported mortgage insurance funds in several states, including California, Illinois and New York.
Private mortgage insurers. The private mortgage insurance industry is highly competitive. The private mortgage insurance industry currently consists of seven mortgage insurers plus our company.
Mortgage lenders and other investors. We and other mortgage insurers compete with transactions structured by mortgage lenders to avoid mortgage insurance on low-down-payment mortgage loans. These transactions include self-insuring and simultaneous second loans, which separate a mortgage with a loan-to-value ratio of more than 80%, which generally would require mortgage insurance, into two loans, a first mortgage with a loan to-value-ratio of 80% and a simultaneous second mortgage for the excess portion of the loan.
We are developing mortgage insurance products that seek to enhance the appeal of private mortgage insurance in view of the increasing volume of simultaneous second loans. For example, in 2004, we launched our HomeOpeners® suite of products designed to compete more effectively with simultaneous second loans by offering consumers lower monthly payments, more deductible interest and involuntary job loss protection at no additional cost.
We also compete with structured transactions in the capital markets and with other financial instruments designed to mitigate the risk of mortgage defaults, such as credit default swaps and credit linked notes, with lenders who forego mortgage insurance (self-insure) on loans held in their portfolios, and with mortgage lenders who maintain captive mortgage insurance and reinsurance programs.
The GSEs—Fannie Mae, Freddie Mac and The Federal Home Loans Banks. As the predominant purchasers of conventional mortgage loans in the U.S., Fannie Mae and Freddie Mac provide a direct link between mortgage
21
origination and capital markets. As discussed above under “—Primary mortgage insurance,” most high loan-to-value mortgages purchased by Fannie Mae or Freddie Mac are insured with private mortgage insurance issued by an insurer deemed qualified by the GSEs. Our mortgage insurance company is a qualified insurer with both GSEs. Private mortgage insurers may be subject to competition from Fannie Mae and Freddie Mac to the extent the GSEs are compensated for assuming default risk that would otherwise be insured by the private mortgage insurance industry.
Private mortgage insurers must satisfy requirements set by the GSEs to be eligible to insure loans sold to the GSEs, and the GSEs have the ability to implement new eligibility requirements for mortgage insurers. They also have the authority to change the pricing arrangements for purchasing retained-participation mortgages as compared to insured mortgages, increase or reduce required mortgage insurance coverage percentages, and alter or liberalize underwriting standards on low-down-payment mortgages they purchase.
In addition to the GSEs, FHLBs purchase single-family conforming mortgage loans. Although not required to do so, the FHLBs currently use mortgage insurance on substantially all mortgage loans with a loan-to-value ratio above 80%.
International mortgage insurance
We have significant mortgage insurance operations in Australia and Canada, two of the largest markets for mortgage insurance products outside the U.S., as well as smaller operations in New Zealand and the developing markets in Europe, Mexico and Japan.
The mortgage loan markets in Canada and Australia are well developed. Although mortgage insurance plays an important role in each of these markets, the markets vary significantly and are influenced in large part by the different cultural, economic and regulatory conditions in each market.
We believe the following factors have contributed to the growth of robust mortgage insurance demand in these countries:
| • | a desire by lenders to offer low-down-payment mortgage loans to facilitate the expansion of their business; |
| • | the recognition of the higher default risk inherent in low-down-payment lending and the need for specialized underwriting expertise to conduct this business prudently; |
| • | government housing policies that support increased homeownership; |
| • | government policies that support the use of securitization and secondary market mortgage sales, in which third-party credit enhancement is often used, as a source of funding and liquidity for mortgage lending; and |
| • | bank regulatory capital policies that provide incentives to lenders to transfer some or all of the increased credit risk on low-down-payment mortgages to third parties, such as mortgage insurers. |
We believe a number of these factors are becoming evident in certain markets throughout Europe, Latin America and Asia and provide opportunities for us to expand our mortgage insurance business in those markets.
Based upon our experience in the mature markets, we believe a favorable regulatory framework is important to the development of an environment in which lenders routinely extend high loan-to-value loans and use products such as mortgage insurance to protect against default risk or obtain capital relief. As a result, we have advocated governmental and policymaking agencies throughout our markets to adopt legislative and regulatory policies supporting increased homeownership and capital relief for lenders and mortgage investors that insure their loan portfolios with private mortgage insurance. Although the products we offer in each of our international
22
markets differ, they represent substantially similar risk propositions and involve similar business practices. We have developed significant expertise in mature markets, and we leverage this experience in developing markets as we continue to encourage regulatory authorities to implement incentives for private mortgage insurance as an effective risk management strategy.
We believe the revisions to a set of regulatory rules and procedures governing global bank capital standards that were introduced by the Basel Committee of the Bank for International Settlements, known as Basel II, also may encourage further growth of international mortgage insurance. Basel II has been designed to reward banks that have developed effective risk management systems by allowing them to hold less capital than banks with less effective systems. For example, Basel II may reward a lender that transfers some risk of mortgage default to a third-party insurer by reducing the amount of capital that the lender must hold to back a mortgage. Basel II was finalized and issued in June 2004; however, its adoption by individual countries internationally and in the U.S. is ongoing. Therefore, we cannot predict the benefits that ultimately will be provided to lenders, or how any such benefits may affect the opportunities for the growth of mortgage insurance.
Certain markets in Europe, Latin America and Asia have strong demand for housing, but are underserved by the existing housing finance systems. As a result, we believe that mortgage insurance could enhance the overall scale, effectiveness and efficiency of these mortgage markets.
We expect lenders in these countries will seek to expand their consumer mortgage loan portfolios, while maintaining strong risk and capital management routines. With the expected implementation of the new Basel II standards, we believe we will be well positioned to assist lenders in these markets in meeting those goals and in complying with the anticipated complexity of the risk-based capital and operating standards.
Canada
We entered the Canadian mortgage insurance market in 1995 with our acquisition of certain assets and employees from the Mortgage Insurance Corporation of Canada, and we now operate in every province and territory. We are currently the leading private mortgage insurer in the Canadian market.
Products
We offer two products in Canada: primary flow insurance and portfolio credit enhancement insurance. Our principal product is primary flow insurance, which is similar to the primary flow insurance we offer in the U.S. Regulations in Canada require the use of mortgage insurance for all mortgage loans extended by banks, trust companies and insurers, where the loan-to-value ratio exceeds 75%.
Mortgage insurance in Canada is typically single premium and provides 100% coverage, in contrast to the U.S., where monthly premiums and lower coverage levels are typical. Under the single-premium plan, lenders usually include the single premium as a part of the aggregate loan amount and pay a single premium to us as the mortgage insurer. We, in turn, record the proceeds to unearned premium reserves, invest those proceeds and recognize the premiums over time in accordance with the expected pattern of risk emergence.
We also provide portfolio credit enhancement insurance to lenders that have originated loans with loan-to-value ratios of less than 75%. These policies provide lenders with immediate capital relief from applicable bank regulatory capital requirements and facilitate the securitization of mortgages in the Canadian market. In both primary flow insurance and portfolio policies, our mortgage insurance in Canada provides insurance coverage for the entire unpaid loan balance, including interest, selling costs and expenses, following the sale of the underlying property.
Government guarantee
We have an agreement with the Canadian government under which it guarantees the benefits payable under a mortgage insurance policy, less 10% of the original principal amount of an insured loan, in the event that we
23
fail to make claim payments with respect to that loan because of insolvency. We pay the Canadian government a risk premium for this guarantee and make other payments to a reserve fund in respect of the government’s obligation. Because banks are not required to maintain regulatory capital on an asset backed by a sovereign guarantee, our 90% sovereign guarantee permits lenders purchasing our mortgage insurance to reduce their regulatory capital charges for credit risks on mortgages by 90%.
Competitors
Currently, our primary mortgage insurance competitor in Canada is the Canada Mortgage and Housing Corporation (“CMHC”) which is a Crown corporation owned by the Canadian government, although there have been and may continue to be new competitors entering the Canadian market. Because CMHC is a government owned entity, its mortgage insurance provides lenders with 100% capital relief from bank regulatory requirements. We compete with CMHC primarily based upon our reputation for high-quality customer service, quick decision-making on insurance applications, strong underwriting expertise and flexibility in terms of product development. In addition, as in other markets, we compete in Canada with alternative products and financial structures, such as credit default swaps, which are designed to transfer credit default risk on mortgage loans.
Australia
We entered the Australian mortgage insurance market in 1997 with our acquisition of the operating assets of the Housing Loans Insurance Corporation (“HLIC”) from the Australian government. We also entered the New Zealand mortgage insurance market in 1999 as an expansion of our Australian operations. In 2006, we acquired Vero Lenders Mortgage Insurance Limited.
Products
In Australia and New Zealand, we offer primary flow insurance, known as “lenders mortgage insurance” (“LMI”), and portfolio credit enhancement policies. Our principal product is LMI, which is similar to the primary flow insurance we offer in Canada, with single premiums and 100% coverage. Lenders usually collect the single premium from prospective borrowers at the time the loan proceeds are advanced and remit the amount to us as the mortgage insurer. We in turn record the proceeds to unearned premium reserves, invest those proceeds and recognize the premiums over time in accordance with the expected pattern of risk emergence.
We provide LMI on a flow basis to two types of customers: banks, building societies and credit unions; and non-bank mortgage originators, called mortgage managers. Banks, building societies and credit unions generally acquire LMI only for residential mortgage loans with loan-to-value ratios above 80%. Under Australian Prudential Regulation Authority (“APRA”) requirements, effective January 1, 2006, reduced capital requirements apply to high loan-to-value residential mortgages only if they have been insured by a mortgage insurance company that is regulated by APRA or is subject to comparable regulation in its home jurisdiction and is otherwise acceptable to APRA. After October 1, 2004, “non-standard” loans with a loan-to-value ratio above 60% are entitled to a reduced capital requirement only if they meet strict requirements as established by APRA or are insured by a qualified LMI. APRA’s regulations currently require APRA-regulated lenders to determine the criteria for determining if a loan is a non-standard type loan.
Mortgage managers fund their operations primarily through the issuance of mortgage-backed securities. Because they are not regulated by APRA, they do not have the same capital incentives as banks for acquiring LMI. However, they use LMI as the principal form of credit enhancement for these securities and generally purchase insurance for every loan they originate, without regard to the loan-to-value ratio.
We also provide portfolio credit enhancement policies to APRA-regulated lenders that have originated loans for securitization in the Australian market. Portfolio mortgage insurance serves as an important source of credit
24
enhancement for the Australian securitization market, and our portfolio credit enhancement coverage generally is purchased for low loan-to-value, seasoned loans written by APRA-regulated institutions. To date, a market for these portfolio credit enhancement policies has not developed in New Zealand to the same extent as in Australia.
Competitors
The Australian and New Zealand flow mortgage insurance markets currently are served by one other independent LMI company, as well as various lender-affiliated captive mortgage insurance companies. We compete primarily based upon our reputation for high-quality customer service, quick decision making on insurance applications, strong underwriting expertise and flexibility in terms of product development. As in Canada, our products also compete in Australia and New Zealand with alternative products and financial structures that are designed to transfer credit default risk on mortgage loans. We believe other U.S. mortgage insurance providers are considering opportunities in Australia.
APRA’s license conditions require Australian mortgage insurance companies, including ours, to be monocline insurers, which are insurance companies that offer just one type of insurance product.
Europe
We began our European operations in the U.K., which is Europe’s largest market for mortgage loan originations. In recent years, we expanded into seven additional countries and we continue to explore opportunities in other European countries.
Products
Our European business currently consists principally of primary flow insurance. As is the case in our other non-U.S. markets, most primary flow insurance policies written in Europe are structured with single premium payments. Our primary flow insurance generally provides first-loss coverage in the event of default on a portion (typically 10% to 20%) of the balance of an individual mortgage loan. We also offer portfolio credit enhancement to lenders that have originated loans for securitization in select European markets.
Competitors
Our European business faces competition from both traditional mortgage insurance companies as well as providers of alternative credit enhancement products. Our competitors are both public and private entities including public mortgage guarantee facilities. Competition from alternative credit enhancement products include personal guarantees on high loan-to-value loans, second mortgages and bank guarantees, captive insurance companies organized by lenders, and alternative forms of risk transfer including capital markets solutions. We believe that our global expertise, coverage flexibility, and strong ratings provide a valuable offering compared with competitors and alternative products.
International Distribution and Customers
We maintain a dedicated sales force that markets our mortgage insurance products internationally to lenders in countries where we provide mortgage insurance. As in the U.S. market, our sales force markets to financial institutions and mortgage originators, who in turn offer mortgage insurance products to borrowers.
The ten largest mortgage originators in Canada and Australia, consisting of banks, trust companies, mortgage managers and credit unions, collectively provide the majority of the financing for residential mortgage financing in their respective countries. Other market participants include regional banks, trust companies, credit unions and building societies. In Europe our customers are primarily banks and mortgage investors.
25
Corporate and Other
Our Corporate and Other activities include debt financing expenses that are incurred at our holding company level, unallocated corporate income and expenses, and the results of a small, non-core Bermuda-based reinsurance business, that is managed outside our operating segments.
International Operations
Information regarding our U.S. and international operations is presented in note 21 to the consolidated financial statements under “Item 8—Financial Statements and Supplementary Data” of this Annual Report on Form 10-K.
Marketing
We promote and differentiate our products and services through breadth of offerings, technology services, specialized support for our distributors and innovative marketing programs tailored to particular consumer groups.
We offer a range of products that meet the needs of consumers throughout the various stages of their lives. We are selective in the products we offer and strive to maintain appropriate return and risk thresholds when we expand the scope of our product offerings. We believe our reputation for innovation and our selective breadth of products enable us to sustain strong relationships with our distributors and position us to benefit from the current trend among distributors to reduce the number of insurers with whom they maintain relationships. We also have developed sophisticated technological tools that enhance performance by automating key processes and reducing response times and process variations. These tools also make it easier for our customers and distributors to do business with us.
We have focused our marketing approach on promoting our brand to key constituencies, including sales intermediaries, employees, investors and consumers. These programs include advertising on television and in trade and business periodicals that are likely to reach those demographic groups. We also seek to build recognition of our brand and maintain strong relationships with leading distributors by providing a high level of specialized and differentiated distribution support, such as product training, advanced marketing and sales solutions, financial product design for affluent customers and technology solutions that support the distributors’ sales efforts and by pursuing joint business improvement efforts. In addition, we sponsor various advisory councils with independent sales intermediaries and dedicated sales specialists to gather their feedback on industry trends, new product suggestions and ways to enhance our relationships.
We also have been actively marketing our products and services to U.S. Latino customers, who we believe are substantially underserved by insurance and investment products, despite being the largest minority group in the U.S. As part of this campaign, we support Hispanic-focused distribution, translate various marketing materials into Spanish, advertise our services on Spanish language media and participate in Latin American cultural events. We operate a Spanish-language website devoted to financial education for U.S. Latinos. In addition, we introduced our new emerging market web-based mortgage platform, TuCasaAhora.com, which was designed to help Latinos become homeowners. The product combines bilingual education, discounts, and incentives to support Latino first time homeownership.
Risk Management
Overview
Risk management is a critical part of our business and we have adopted an enterprise risk management framework that includes rigorous risk management processes in virtually every aspect of our operations, including product development and management, business acquisitions, underwriting, investment management,
26
asset-liability management and technology development projects. The risk management framework includes the assessment of risk, a proactive decision process to determine which risks are acceptable, and the ongoing monitoring and management of those risks. The primary objective of these risk management processes is to reduce the variations we experience from our expected results. We have an experienced group of professionals, including actuaries, statisticians and other specialists, dedicated exclusively to our risk management process. We have emphasized our adherence to rigorous risk management techniques and leveraged the benefits into a competitive advantage in marketing and managing our products.
New product introductions
Our risk management process begins with the development and introduction of new products and services. We have established a rigorous product development process that specifies a series of required analyses, reviews and approvals for any new product. For each proposed project, this process includes a review of the market opportunity and competitive landscape, major pricing assumptions and methodologies, return expectations, reinsurance strategies, underwriting criteria and business risks and potential mitigating factors. Before we introduce a new product, we establish a monitoring program with specific performance targets and leading indicators, which we monitor frequently to identify any deviations from expected performance so that we can take prompt corrective action when necessary. Significant product introductions require approval by our senior management team. We use a similarly rigorous process to introduce variations to existing products and to offer existing products in new markets and through new distribution channels.
New business acquisitions
When we consider an acquisition of a new block or book of business, we use our extensive risk management process to evaluate the new business opportunity and assess its strategic fit with our current business model. We have a rigorous review process that includes a series of required analyses, reviews and approvals similar to those employed for new product introductions.
Product performance reviews
Product performance reviews are performed by senior operating management and by our Capital and Risk Committee on a regular cycle. Our Capital and Risk Committee includes our Chief Executive Officer, Chief Risk Officer, Chief Financial Officer, Chief Investment Officer, Chief Actuary, and our General Counsel. These reviews include an analysis of the major drivers of profitability, underwriting performance, variations from expected results, regulatory and competitive environment and other factors affecting product performance. In addition, we initiate special reviews when a product’s performance fails to meet any of the indicators we established during that product’s introductory review process. If a product does not meet our performance criteria, we consider adjustments in pricing, design and marketing or ultimately discontinuing sales of that product. In addition, in our mortgage insurance business, we also review the profitability of lender accounts to assess whether our business with these lenders is achieving anticipated performance levels and to identify trends requiring remedial action, including changes to underwriting guidelines, product mix or other customer performance. We review our underwriting, pricing and risk selection strategies on a regular basis to ensure that our products remain progressive, competitive and consistent with our marketing and profitability objectives. We are also subject to periodic external audits by our reinsurers, which provide us with valuable insights into other innovative risk management practices.
Asset-liability management
We maintain segmented investment portfolios for the majority of our product lines. This enables us to perform an ongoing analysis of the interest rate risks associated with each major product line, in addition to the interest rate risk for our overall enterprise. We analyze the behavior of our liability cash flows across a wide variety of future interest rate scenarios, reflecting policy features and expected policyholder behavior. We also
27
analyze the behavior of our asset portfolios across the same scenarios. We believe this analysis shows the sensitivity of both our assets and liabilities to large and small changes in interest rates and enables us to manage our assets and liabilities more effectively.
Portfolio diversification
We use limits to ensure a spread of risk in our business. We have strict limitations on credit risk to avoid concentration in our investment portfolio. Our product portfolios have considerable diversification due to the wide variety of products we have sold over a number of years. We also manage unique product exposures in our business segments. For example, in managing our mortgage insurance risk exposure, we carefully monitor geographic concentrations in our portfolio and the condition of housing markets in each country in which we operate. We monitor our concentration of risk in-force at the regional, state and major metropolitan area levels on a quarterly basis. In the U.S., we evaluate the condition of housing markets in major metropolitan areas with our proprietary OmniMarketSM model, which rates housing markets based on variables such as economic activity, unemployment, mortgage delinquencies, home sales trends and home price changes. We also regularly monitor factors that affect home prices and their affordability by region and major metropolitan area.
Actuarial databases and information systems
Our extensive actuarial databases and innovative information systems technology are important tools in our risk management programs. We believe we have the largest actuarial database for long-term care insurance claims with over 30 years of experience in offering those products. We also have substantial experience in offering individual life insurance products, and we have developed a large database of claims experience, particularly in preferred risk classes, which provides significant predictive experience for mortality.
We use advanced and, in some cases, proprietary technology to manage variations in our underwriting process. For example, our GENIUS® new business processing system uses digital underwriting technology that has increased the speed, consistency and accuracy of our underwriting process by reducing decision-making variation. In our mortgage insurance business we use borrower credit scores, our proprietary mortgage scoring model, OmniScore®, and/or our extensive database of mortgage insurance experience along with external data including rating agency data to evaluate new products and portfolio performance. In the U.S. and Canada, OmniScore® uses the borrower’s credit score and additional data concerning the borrower, the loan and the property, including loan-to-value ratio, loan type, loan amount, property type, occupancy status and borrower employment to predict the likelihood of having to pay a claim. In the U.S., OmniScore® also incorporates our assessment of the housing market in which a property is located, as evaluated with our OmniMarket® model. We believe this additional mortgage data and housing market assessment significantly enhances OmniScore’s® predictive power over the life of the loan. We perform portfolio analysis on an ongoing basis to determine if modifications are required to our product offerings, underwriting guidelines or premium rates.
Compliance
Legal and regulatory compliance are critical parts of our business and we are recognized in the insurance industry for our excellence in these areas. In recognition of our commitment, we have twice received the American Council of Life Insurers’ “Integrity First Award” for our compliance programs. Throughout our company we instill a strong commitment to integrity and ethics in business dealings and compliance with applicable laws and regulations. In addition, we are an Insurance Marketplace Standards Association qualified company. We have approximately 200 professionals dedicated to legal and compliance matters.
Operations and Technology
Service and support
We have a dedicated team of approximately 3,800 service and support personnel, supplemented by a service and support staff of approximately 1,400 personnel through an arrangement with an outsourcing provider in
28
India, GENPACT, who assist our sales intermediaries and customers with their service needs. We use advanced and, in some cases, proprietary, patent-pending technology to provide product design and underwriting, and we operate service centers that leverage technology, integrated processes, and process management techniques.
In our Protection and Retirement Income and Investments segments, we interact directly and cost-effectively with our independent sales intermediaries and dedicated sales specialists through secure websites that have enabled them to transact business with us electronically, obtain information about our products, submit applications, check application and account status and view commission information. We also provide our independent sales intermediaries and dedicated sales specialists with account information to disseminate to their customers through the use of industry-standard communications.
We also have introduced technologically advanced services to customers in our Mortgage Insurance segment. Advances in technology enable us to accept applications through electronic submission and to issue electronic insurance commitments and certificates to varying degrees across the jurisdictions in which we do business. Through our Internet-enabled information systems, lenders can receive information about their loans in our database, as well as make corrections, file notices and claims, report settlement amounts, verify loan information and access payment histories. In the U.S., we also assist in workouts through what we believe is the mortgage insurance industry’s first on-line workout approval system, allowing lenders to request and obtain authorization from us for them to provide workout solutions to their borrowers. For the years ended December 31, 2006, 2005 and 2004, we issued approximately 86% of our U.S. mortgage insurance commitments electronically.
Operating centers
We have centralized most of our operations and have established scalable, low-cost operating centers in Virginia, North Carolina and Ireland. In addition, through an arrangement with an outsourcing provider, we have a substantial team of professionals in India who provide a variety of services to us, including customer service, transaction processing, and functional support including finance, investment research, actuarial, risk and marketing resources to our insurance operations.
Technology capabilities and process improvement
We rely on proprietary processes for project approval, execution, risk management and benefit verification as part of our approach to technology investment. We have been issued 22 patents and have filed more than 50 pending patent applications. Our technology team is experienced in large-scale project delivery, including many insurance administration system consolidations and the development of Internet-based servicing capabilities. We continually manage technology costs by standardizing our technology infrastructure, consolidating application systems, reducing servers and storage devices and managing project execution risks.
We believe we have greatly enhanced our operating efficiency, generated significant cost savings, and created competitive advantages by using a variety of process tools designed to address all aspects of process management. Our tools enable us to more effectively operate processes, improve our process performance, and build new processes. Our team of operational quality experts is focused on driving our process and project execution and championing process management disciplines. We always tailor the application of our tools to the specific needs of each project or process resulting in more effective execution.
Reserves
We calculate and maintain reserves for estimated future benefit payments to our policyholders and contractholders in accordance with U.S. GAAP and industry accounting practices. We release these reserves as those future obligations are extinguished. The reserves we establish necessarily reflect estimates and actuarial assumptions with regard to our future experience. These estimates and actuarial assumptions involve the exercise
29
of significant judgment that is subjected to a variety of internal and external independent reviews. Our future financial results depend significantly upon the extent to which our actual future experience is consistent with the assumptions we have used in pricing our products and determining our reserves. Many factors can affect future experience, including economic and social conditions, inflation, healthcare costs, and changes in doctrines of legal liability and damage awards in litigation. Therefore, we cannot determine with complete precision the ultimate amounts we will pay for actual future benefits or the timing of those payments.
Reinsurance
We follow the industry practice of reinsuring portions of our insurance risks with reinsurance companies. We use reinsurance both to diversify our risks and to manage loss exposures and capital effectively. The use of reinsurance permits us to write policies in amounts larger than the risk we are willing to retain, and also to write a larger volume of new business.
We cede insurance primarily on a treaty basis, under which risks are ceded to a reinsurer on specific blocks of business where the underlying risks meet certain predetermined criteria. To a lesser extent, we cede insurance risks on a facultative basis, under which the reinsurer’s prior approval is required on each risk reinsured. Use of reinsurance does not discharge us, as the insurer, from liability on the insurance ceded. We, as the insurer, are required to pay the full amount of our insurance obligations even in circumstances where we are entitled or able to receive payments from our reinsurer. The principal reinsurers to which we cede risks have A.M. Best financial strength ratings ranging from “A+” to “B++”, with one reinsurer not rated but whose balance is fully collateralized. Historically, we have not had significant concentrations of reinsurance risk with any one reinsurer. However, prior to the completion of the IPO, we entered into reinsurance transactions with Union Fidelity Life Insurance Company (“UFLIC”), an affiliate of our former parent, which resulted in a significant concentration of reinsurance risk with UFLIC, whose obligations to us are secured by trust accounts as described in note 9 in our consolidated financial statements under “Item 8—Financial Statements and Supplementary Data.”
The following table sets forth our exposure to our principal reinsurers, including reinsurance recoverable as of December 31, 2006 and the A.M. Best ratings of those reinsurers as of that date:
| (Amounts in millions) |
Reinsurance recoverable |
A.M. Best rating | |||
| UFLIC(1) |
$ | 15,010 | A- | ||
| Phoenix Life Insurance Company(2) |
770 | A | |||
| Riversource Life Insurance Company(3) |
712 | A+ | |||
| Swiss Re Life & Health America Inc. |
215 | A+ | |||
| Munich American Reassurance Company |
197 | A+ | |||
| Employers Reassurance Corporation |
87 | B++ | |||
| Revios Reinsurance(4) |
70 | Not Rated | |||
| (1) | Prior to our IPO, we entered into several significant reinsurance transactions with other affiliates of GE. In these transactions, we ceded to UFLIC, in-force blocks of structured settlements, substantially all of our in-force blocks of variable annuities and a block of long-term care insurance policies that we reinsured in 2000 from Travelers Insurance Company. See note 9 in our consolidated financial statements under “Item 8—Financial Statements and Supplementary Data.” |
| (2) | Our reinsurance arrangement with Phoenix covers a runoff block of corporate-owned life insurance policies included in our group business. |
| (3) | Our reinsurance arrangement with Riversource Life Insurance Company, formerly know as IDS Life Insurance Company, covers a runoff block of single-premium life insurance policies. |
| (4) | Revios Reinsurance refers to Revios Reinsurance International, which is not a formally rated company. However, the reinsurance recoverable balance is fully collateralized on a funds held basis. |
In the U.S., we have entered into a number of reinsurance agreements in which we share portions of our mortgage insurance risk written on loans originated or purchased by lenders with captive reinsurance companies,
30
or captive reinsurers, affiliated with these lenders. In return, we cede an agreed portion of our gross premiums on insurance written to the captive reinsurers. Substantially all of our captive mortgage reinsurance arrangements are structured on an excess-of-loss basis. As of December 31, 2006, our total mortgage insurance risk reinsured to all captive reinsurers was $3.1 billion, and the total capital held in trust for our benefit by all captive reinsurers was $0.7 billion. These captive reinsurers are not rated, and their claims-paying obligations to us are secured by an amount of capital held in trust. We believe the capital held in trust by these captive reinsurers is sufficient to meet their anticipated obligations to us. However, we cannot ensure that each captive with which we do business can or will meet all its obligations to us.
Financial Strength Ratings
Ratings with respect to financial strength are an important factor in establishing the competitive position of insurance companies. Ratings are important to maintaining public confidence in us and our ability to market our products. Rating organizations review the financial performance and condition of most insurers and provide opinions regarding financial strength, operating performance and ability to meet obligations to policyholders. Short-term financial strength ratings are an assessment of the credit quality of an issuer with respect to an instrument considered short-term in the relevant market, typically one year or less.
Our principal life insurance subsidiaries are rated by A.M. Best, S&P, Moody’s and Fitch as follows:
| Company |
A.M. Best rating |
S&P rating |
Moody’s rating |
Fitch rating | ||||
| Genworth Life Insurance Company of New York |
A+ (Superior) | AA- (Very Strong) | Aa3 (Excellent) | AA- (Very Strong) | ||||
| Genworth Life and Annuity Insurance Company |
A+ (Superior) | AA- (Very Strong) | Aa3 (Excellent) | AA- (Very Strong) | ||||
| Genworth Life and Annuity Insurance Company (Short term rating) |
Not rated | A-1+ (Strong) | P1 (Superior) | Not Rated | ||||
| Genworth Life and Health Insurance Company |
A (Excellent) | AA- (Very Strong) | Not Rated | Not Rated | ||||
| Genworth Life Insurance Company |
A+ (Superior) | AA- (Very Strong) | Aa3 (Excellent) | AA- (Very Strong) | ||||
| Genworth Life Insurance Company (Short term rating) |
Not rated | A-1+ (Strong) | P1 (Superior) | Not Rated | ||||
| Continental Life Insurance Company of Brentwood, Tennessee |
A- (Excellent) | Not rated | Not rated | Not rated | ||||
31
Our mortgage insurance subsidiaries are rated by S&P, Moody’s, Fitch and DBRS as follows:
| Company |
S&P rating |
Moody’s rating |
Fitch rating |
Dominion Bond Rating Service | ||||
| Genworth Mortgage Insurance Corporation |
AA (Very Strong) | Aa2 (Excellent) | AA (Very Strong) | Not rated | ||||
| Genworth Residential Mortgage Insurance Corporation of North Carolina |
AA (Very Strong) | Aa2 (Excellent) | AA (Very Strong) | Not rated | ||||
| Genworth Financial Mortgage Insurance Company Pty. Ltd |
AA (Very Strong) | Aa2 (Excellent) | AA (Very Strong) | Not rated | ||||
| Genworth Financial Mortgage Insurance Limited |
AA (Very Strong) | Aa2 (Excellent) | AA (Very Strong) | Not rated | ||||
| Genworth Financial Mortgage Insurance Company Canada |
AA (Very Strong) | Not rated | Not rated | AA (Superior) | ||||
| Private Residential Mortgage Insurance Corporation |
Not rated | Aa2 (Excellent) | AA (Very Strong) | Not rated | ||||
| Genworth Financial Mortgage Indemnity Limited |
A- (Strong) | A2 (Strong) | Not rated | Not rated | ||||
The A.M. Best, S&P, Moody’s, Fitch and DBRS ratings included are not designed to be, and do not serve as, measures of protection or valuation offered to investors. These financial strength ratings should not be relied on with respect to making an investment in our securities.
A.M. Best states that its “A+” (Superior) rating is assigned to those companies that have, in its opinion, a superior ability to meet their ongoing obligations to policyholders. The “A+” (Superior) rating is the second-highest of fifteen ratings assigned by A.M. Best, which range from “A++” to “S”.
S&P states that an insurer rated “AA” (Very Strong) has very strong financial security characteristics that outweigh any vulnerabilities, and is highly likely to have the ability to meet financial commitments. The “AA” range is the second-highest of the four ratings ranges that meet these criteria, and also is the second-highest of nine financial strength rating ranges assigned by S&P, which range from “AAA” to “R.” A plus (+) or minus (-) shows relative standing in a rating category. Accordingly, the “AA” and “AA-” ratings are the third- and fourth-highest of S&P’s 20 ratings categories. The short-term “A-1” rating is the highest rating and shows the capacity to meet financial commitments is strong. Within this category, the designation of a plus sign (+) indicates capacity to meet its’ financial commitment is extremely strong.
Moody’s states that insurance companies rated “Aa” (Excellent) offer excellent financial security. Moody’s states that companies in this group constitute what are generally known as high-grade companies. The “Aa” range is the second-highest of nine financial strength rating ranges assigned by Moody’s, which range from “Aaa” to “C.” Numeric modifiers are used to refer to the ranking within the group, with 1 being the highest and 3 being the lowest. Accordingly, the “Aa2” and “Aa3” ratings are the third- and fourth-highest of Moody’s 21 ratings categories. The short-term rating “P1” is the highest rating and shows superior ability for repayment of short-term debt obligations.
32
Fitch states that “AA” (Very Strong) rated insurance companies are viewed as possessing very strong capacity to meet policyholder and contract obligations. Risk factors are modest, and the impact of any adverse business and economic factors is expected to be very small. The “AA” rating category is the second-highest of eight financial strength rating categories, which range from “AAA” to “D.” The symbol (+) or (-) may be appended to a rating to indicate the relative position of a credit within a rating category. These suffixes are not added to ratings in the “AAA” category or to ratings below the “CCC” category. Accordingly, the “AA” and “AA-” ratings are the third- and fourth-highest of Fitch’s 24 ratings categories.
DBRS states that long-term debt rated “AA” is of superior credit quality, and protection of interest and principal is considered high. In many cases they differ from long-term debt rated “AAA”, exceptional, only to a small degree. Given the extremely restrictive definition DBRS has for the “AAA” category, entities rated “AA” are also considered to be strong credits, typically exemplifying above-average strength in key areas of consideration and unlikely to be significantly affected by reasonably foreseeable events.
A.M. Best, S&P, Moody’s, Fitch and DBRS review their ratings periodically and we cannot assure you that we will maintain our current ratings in the future. Other agencies may also rate our company or our insurance subsidiaries on a solicited or an unsolicited basis.
Investments
Overview
As of December 31, 2006, we had total cash, cash equivalents and invested assets of $71.9 billion and an additional $10.9 billion held in our separate accounts, for which we do not bear investment risk. We manage our assets to meet diversification, credit quality, yield and liquidity requirements of our policy and contract liabilities by investing primarily in fixed maturities, including government, municipal and corporate bonds, mortgage-backed and other asset-backed securities and mortgage loans on commercial real estate. We also invest in short-term securities and other investments, including a small position in equity securities. In all cases, investments for our particular insurance company subsidiaries are required to comply with restrictions imposed by applicable laws and insurance regulatory authorities.
The following table sets forth our cash, cash equivalents and invested assets as of the dates indicated:
| December 31, | ||||||||||||
| 2006 | 2005 | |||||||||||
| (Amounts in millions) |
Carrying value |
% of total |
Carrying value |
% of total |
||||||||
| Fixed-maturities, available-for-sale |
||||||||||||
| Public |
$ | 40,160 | 56 | % | $ | 40,539 | 59 | % | ||||
| Private |
15,288 | 21 | 13,398 | 19 | ||||||||
| Commercial mortgage loans |
8,491 | 12 | 7,558 | 11 | ||||||||
| Other investments |
3,846 | 6 | 3,174 | 5 | ||||||||
| Policy loans |
1,494 | 2 | 1,350 | 2 | ||||||||
| Restricted investments held by securitization entities |
— | — | 685 | 1 | ||||||||
| Equity securities, available for sale |
197 | — | 206 | — | ||||||||
| Cash and cash equivalents |
2,469 | 3 | 1,875 | 3 | ||||||||
| Total cash, cash equivalents and invested assets |
$ | 71,945 | 100 | % | $ | 68,785 | 100 | % | ||||
For a discussion of our investment results, see “Management’s Discussion and Analysis of Financial Condition and Results of Operations—Investment Results.”
33
Our primary investment objective is to meet our obligations to policyholders and contractholders while increasing value to our stockholders by investing in a diversified high quality portfolio, income producing securities and other assets. Our investment strategy focuses primarily on:
| • | mitigating interest rate risk through management of asset durations relative to policyholder and contractholder obligations; |
| • | selecting assets based on fundamental, research-driven strategies; |
| • | emphasizing fixed-income, low-volatility assets while pursuing active strategies to enhance yield; |
| • | maintaining sufficient liquidity to meet unexpected financial obligations; |
| • | regularly evaluating our asset class mix and pursuing additional investment classes including catastrophe bonds and collateralized debt obligations; and |
| • | continuously monitoring asset quality. |
Looking forward, we expect to become a more active investor in alternative asset classes to enhance risk adjusted returns. Such alternative asset classes include credit default swaps, bank loans, hedge funds, infrastructure funds and mezzanine and equity commercial real estate investments.
We are exposed to two primary sources of investment risk:
| • | credit risk, relating to the uncertainty associated with the continued ability of a given issuer to make timely payments of principal and interest; and |
| • | interest rate risk, relating to the market price and cash flow variability associated with changes in market interest rates. |
We manage credit risk by analyzing issuers, transaction structures and any associated collateral. We use sophisticated analytic techniques to monitor credit risk. For example, we continually measure the probability of credit default and estimated loss in the event of such a default, which provides us with early notification of worsening credits. We also manage credit risk through industry and issuer diversification and asset allocation practices. For commercial mortgage loans, we manage credit risk through geographic, property type and product type diversification and asset allocation.
We mitigate interest rate risk through rigorous management of the relationship between the duration of our assets and the duration of our liabilities, seeking to minimize risk of loss in both rising and falling interest rate environments. For further information on our management of interest rate risk, see “Item 7A—Quantitative and Qualitative Disclosures About Market Risk.”
Organization
Our investment department, which comprises of more than 160 individuals, includes portfolio management, risk management, finance and accounting functions. Under the direction of the Investment Committee, it is responsible for establishing investment policies and strategies, reviewing asset liability management and performing asset allocation.
We use both internal and external asset managers to take advantage of specific areas of expertise in particular asset classes or to leverage country-specific investing capabilities. We manage certain asset classes for our domestic insurance operations, including commercial mortgage loans, privately placed debt securities and derivatives. GEAM provides investment management services for significant portions of our U.S. and Bermudan investment portfolios pursuant to investment management and services agreements and investment guidelines approved by the boards of directors of our insurance subsidiaries. Over time we expect other external managers to manage a greater percentage of our externally managed assets, with GEAM managing a lesser share than it does currently.
Management of investments for our non-U.S. operations is overseen by the managing director and boards of directors of the applicable non-U.S. legal entities in consultation with our Chief Investment Officer. Substantially
34
all the assets of our payment protection and European mortgage insurance businesses are managed by GE Asset Management Limited (“GEAML”) pursuant to agreements that are substantially similar to our agreements with GEAM in the U.S. The majority of the assets of our Canadian, Australian and New Zealand mortgage insurance businesses continue to be managed by unaffiliated investment managers located in their respective countries. Approximately 9% and 8% of our invested assets, as of December 31, 2006 and 2005, respectively, were held by our international operations and were invested primarily in non-U.S.-denominated securities.
Fixed maturities
Fixed maturities, which are primarily classified as available-for-sale, including tax-exempt bonds, consist principally of publicly traded and privately placed debt securities, and represented 77% and 78% of total cash and invested assets as of December 31, 2006 and 2005, respectively.
We invest in privately placed fixed maturities to increase diversification and obtain higher yields than can ordinarily be obtained with comparable public market securities. Generally, private placements provide us with protective covenants, call protection features and, where applicable, a higher level of collateral. However, our private placements are not generally freely transferable because of restrictions imposed by federal and state securities laws, the terms of the securities and illiquid trading markets.
The Securities Valuation Office of the National Association of Insurance Commissioners (“NAIC”) evaluates bond investments of U.S. insurers for regulatory reporting purposes and assigns securities to one of six investment categories called “NAIC designations.” The NAIC designations parallel the credit ratings of the Nationally Recognized Statistical Rating Organizations for marketable bonds. NAIC designations 1 and 2 include bonds considered investment grade (rated “Baa3” or higher by Moody’s, or rated “BBB-” or higher by S&P) by such rating organizations. NAIC designations 3 through 6 include bonds considered below investment grade (rated “Ba1” or lower by Moody’s, or rated “BB+” or lower by S&P).
The following tables present our public, private and aggregate fixed maturities by NAIC and/or equivalent ratings of the Nationally Recognized Statistical Rating Organizations, as well as the percentage, based upon estimated fair value, that each designation comprises. Our non-U.S. fixed maturities generally are not rated by the NAIC and are shown based upon their equivalent rating of the Nationally Recognized Statistical Rating Organizations. Similarly, certain privately placed fixed maturities that are not rated by the Nationally Recognized Statistical Rating Organizations are shown based upon their NAIC designation. Certain securities, primarily non-U.S. securities, are not rated by the NAIC or the Nationally Recognized Statistical Rating Organizations and are so designated.
| December 31, | ||||||||||||||||||||
| Public fixed maturities |
2006 | 2005 | ||||||||||||||||||
| NAIC rating |
Rating agency equivalent designation |
Amortized cost |
Estimated fair value |
% of total |
Amortized cost |
Estimated fair value |
% of total |
|||||||||||||
| (Amounts in millions) |
||||||||||||||||||||
| 1 |
Aaa/Aa/A |
$ | 30,144 | $ | 30,485 | 76 | % | $ | 28,681 | $ | 29,295 | 72 | % | |||||||
| 2 |
Baa |
7,535 | 7,639 | 19 | 8,787 | 9,072 | 23 | |||||||||||||
| 3 |
Ba |
1,302 | 1,333 | 3 | 1,456 | 1,466 | 4 | |||||||||||||
| 4 |
B |
610 | 618 | 2 | 550 | 557 | 1 | |||||||||||||
| 5 |
Caa and lower |
76 | 76 | — | 87 | 79 | — | |||||||||||||
| 6 |
In or near default |
8 | 9 | — | 11 | 13 | — | |||||||||||||
| Not rated |
— | — | — | 57 | 57 | — | ||||||||||||||
| Total public fixed maturities |
$ | 39,675 | $ | 40,160 | 100 | % | $ | 39,629 | $ | 40,539 | 100 | % | ||||||||
35
| December 31, | ||||||||||||||||||||
| Private fixed maturities |
2006 | 2005 | ||||||||||||||||||
| NAIC Rating |
Rating agency equivalent designation |
Amortized cost |
Estimated fair value |
% of total |
Amortized cost |
Estimated fair value |
% of total |
|||||||||||||
| (Amounts in millions) |
||||||||||||||||||||
| 1 |
Aaa/Aa/A | $ | 8,922 | $ | 8,970 | 59 | % | $ | 7,326 | $ | 7,452 | 56 | % | |||||||
| 2 |
Baa | 5,492 | 5,558 | 36 | 5,147 | 5,252 | 39 | |||||||||||||
| 3 |
Ba | 584 | 597 | 4 | 451 | 470 | 4 | |||||||||||||
| 4 |
B | 127 | 132 | 1 | 157 | 157 | 1 | |||||||||||||
| 5 |
Caa and lower | 5 | 6 | — | 15 | 16 | — | |||||||||||||
| 6 |
In or near default | 6 | 7 | — | 41 | 34 | — | |||||||||||||
| Not rated | 18 | 18 | — | 16 | 17 | — | ||||||||||||||
| Total private fixed maturities | $ | 15,154 | $ | 15,288 | 100 | % | $ | 13,153 | $ | 13,398 | 100 | % | ||||||||
| December 31, | ||||||||||||||||||||
| Total fixed maturities |
2006 | 2005 | ||||||||||||||||||
| NAIC rating |
Rating agency equivalent designation |
Amortized cost |
Estimated fair value |
% of total |
Amortized cost |
Estimated fair value |
% of total |
|||||||||||||
| (Amounts in millions) |
||||||||||||||||||||
| 1 |
Aaa/Aa/A | $ | 39,066 | $ | 39,455 | 71 | % | $ | 36,007 | $ | 36,747 | 68 | % | |||||||
| 2 |
Baa | 13,027 | 13,197 | 24 | 13,934 | 14,324 | 27 | |||||||||||||
| 3 |
Ba | 1,886 | 1,930 | 4 | 1,907 | 1,936 | 4 | |||||||||||||
| 4 |
B | 737 | 750 | 1 | 707 | 714 | 1 | |||||||||||||
| 5 |
Caa and lower | 81 | 82 | — | 102 | 95 | — | |||||||||||||
| 6 |
In or near default | 14 | 16 | — | 52 | 47 | — | |||||||||||||
| Not rated | 18 | 18 | — | 73 | 74 | — | ||||||||||||||
| Total fixed maturities | $ | 54,829 | $ | 55,448 | 100 | % | $ | 52,782 | $ | 53,937 | 100 | % | ||||||||
Based upon estimated fair value, public fixed maturities represented 72% and 75% of total fixed maturities as of December 31, 2006 and 2005, respectively. Private fixed maturities represented 28% and 25% of total fixed maturities as of December 31, 2006 and 2005, respectively.
We diversify our fixed maturities by security sector. The following table sets forth the estimated fair value of our fixed maturities by sector as well as the percentage of the total fixed maturities holdings that each security sector comprised as of the dates indicated:
| December 31, | ||||||||||||
| 2006 | 2005 | |||||||||||
| (Amounts in millions) |
Estimated fair value |
% of total |
Estimated fair value |
% of total |
||||||||
| U.S. government, agencies and government sponsored entities |
$ | 888 | 2 | % | $ | 805 | 2 | % | ||||
| Tax exempt |
2,231 | 4 | 2,890 | 6 | ||||||||
| Government—non-U.S. |
1,765 | 3 | 1,806 | 3 | ||||||||
| U.S. corporate |
25,008 | 45 | 26,122 | 48 | ||||||||
| Corporate—non-U.S. |
10,741 | 19 | 9,390 | 17 | ||||||||
| Mortgage-backed |
9,406 | 17 | 8,834 | 16 | ||||||||
| Asset-backed |
5,409 | 10 | 4,090 | 8 | ||||||||
| Total fixed maturities |
$ | 55,448 | 100 | % | $ | 53,937 | 100 | % | ||||
36
The following table sets forth the major industry types that comprise our corporate bond holdings, based primarily on industry codes established by Lehman Brothers, as well as the percentage of the total corporate bond holdings that each industry comprised as of the dates indicated:
| December 31, | ||||||||||||
| 2006 | 2005 | |||||||||||
| (Amounts in millions) |
Estimated fair value |
% of total |
Estimated fair value |
% of total |
||||||||
| Finance and insurance |
$ | 12,594 | 35 | % | $ | 11,385 | 32 | % | ||||
| Utilities and energy |
6,313 | 18 | 6,836 | 19 | ||||||||
| Consumer—non cyclical |
4,190 | 12 | 4,632 | 13 | ||||||||
| Consumer—cyclical |
2,524 | 7 | 2,642 | 7 | ||||||||
| Technology and communications |
2,489 | 7 | 2,424 | 7 | ||||||||
| Capital goods |
2,148 | 6 | 2,043 | 6 | ||||||||
| Industrial |
1,803 | 5 | 2,141 | 6 | ||||||||
| Transportation |
1,250 | 3 | 1,325 | 4 | ||||||||
| Other |
2,438 | 7 | 2,084 | 6 | ||||||||
| Total |
$ | 35,749 | 100 | % | $ | 35,512 | 100 | % | ||||
We diversify our corporate bond holdings by industry and issuer. The portfolio does not have significant exposure to any single issuer. As of December 31, 2006, our combined corporate bond holdings in the ten issuers to which we had the greatest exposure was $2.6 billion, which was approximately 3.6% of our total cash and invested assets as of such date. The exposure to the largest single issuer of corporate bonds held as of December 31, 2006 was $302 million, which was less than 1% of our total cash, cash equivalents and invested assets as of such date.
We do not have material unhedged exposure to foreign currency risk in our invested assets. In our non-U.S. insurance operations, both our assets and liabilities are generally denominated in local currencies.
Commercial mortgage loans and other invested assets
Our mortgage loans are collateralized by commercial properties, including multifamily residential buildings. Commercial mortgage loans are stated at principal amounts outstanding, net of deferred expenses and allowance for loan loss.
We diversify our commercial mortgage loans by both property type and geographic region. See note 5 to our consolidated financial statements under “Item 8—Financial Statements and Supplementary Data” for additional information on distribution across property type and geographic region for commercial mortgage loans, as well as information on our interest in equity securities and other investments.
Selected financial information regarding our derivative financial instruments as of December 31, 2006 and 2005 is included under “Item 8—Financial Statements and Supplementary Data” in note 18 to our consolidated financial statements.
Employees
As of December 31, 2006, we had approximately 7,200 full-time and part-time employees. We believe our employee relations are satisfactory. To the best of our knowledge, none of our employees are subject to collective bargaining agreements. Some of our employees in Europe may be members of trade unions, but local data privacy laws prohibit us from asking them about their membership in trade unions, and they are not required to inform us.
Directors and Executive Officers
See Part III, Item 10. of this Annual Report on Form 10-K for information about our directors and executive officers.
37
Available Information
Our Annual Report on Form 10-K, Quarterly Reports on Form 10-Q, Current Reports on Form 8-K and amendments to those reports filed or furnished pursuant to Section 13(a) or 15(d) of the Exchange Act are available, without charge, on our website, www.genworth.com, as soon as reasonably practicable after we file such reports with the SEC. Our SEC filings are also accessible through the Internet at the SEC’s web site at www.sec.gov. Copies are also available, without charge, from Genworth Investor Relations, 6620 West Broad Street, Richmond, VA 23230. This Annual Report on Form 10-K is being distributed to stockholders in lieu of a separate annual report.
Our website also includes the charters of our Audit Committee, Nominating and Corporate Governance Committee, Legal and Public Affairs Committee, and Management Development and Compensation Committee, any key practices of these committees, our Governance Principles, and our company’s code of ethics. Copies of these materials also are available, without charge, from Genworth Investor Relations, at the above address. Within the time period required by the SEC and the New York Stock Exchange, we will post on our website any amendment to our code of ethics and any waiver applicable to any of our directors, executive officers or senior financial officers.
On June 12, 2006, our Chairman of the Board, President and Chief Executive Officer certified to the New York Stock Exchange that he was not aware of any violation by us of the New York Stock Exchange’s corporate governance listing standards.
Transfer Agent and Registrar
Our Transfer Agent and Registrar is The Bank of New York, P.O. Box 11258, Church Street Station, New York, NY 10286. Telephone: (800) 524-4458; (610) 382-7833 (outside the U.S. call collect); and (888) 269-5221 (for hearing impaired).
38
Regulation
Our businesses are subject to extensive regulation and supervision.
General
Our insurance operations are subject to a wide variety of laws and regulations. State insurance laws regulate most aspects of our U.S. insurance businesses, and our U.S. insurance subsidiaries are regulated by the insurance departments of the states in which they are domiciled and licensed. Our non-U.S. insurance operations are principally regulated by insurance regulatory authorities in the jurisdictions in which they are domiciled. Our insurance products and thus our businesses also are affected by U.S. federal, state and local tax laws, and the tax laws of non-U.S. jurisdictions. Insurance products that constitute “securities,” such as variable annuities and variable life insurance, also are subject to U.S. federal and state and non-U.S. securities laws and regulations. The Securities and Exchange Commission (“SEC”), the National Association of Securities Dealers (“NASD”), state securities authorities and non-U.S. authorities regulate and supervise these products.
Our securities operations are subject to U.S. federal and state and non-U.S. securities and related laws. The SEC, state securities authorities, the NASD and similar non-U.S. authorities are the principal regulators of these operations.
The purpose of the laws and regulations affecting our insurance and securities businesses is primarily to protect our customers and not our stockholders. Many of the laws and regulations to which we are subject are regularly re-examined, and existing or future laws and regulations may become more restrictive or otherwise adversely affect our operations.
In addition, insurance and securities regulatory authorities (including state law enforcement agencies and attorneys general or their non-U.S. equivalents) increasingly make inquiries regarding compliance by us and our subsidiaries with insurance, securities and other laws and regulations regarding the conduct of our insurance and securities businesses. We cooperate with such inquiries and take corrective action when warranted.
Many of our customers and independent sales intermediaries also operate in regulated environments. Changes in the regulations that affect their operations also may affect our business relationships with them and their decision to purchase or distribute our products.
U.S. Insurance Regulation
Our U.S. insurance subsidiaries are licensed and regulated in all jurisdictions in which they conduct insurance business. The extent of this regulation varies, but most jurisdictions have laws and regulations governing the financial condition of insurers, including standards of solvency, types and concentration of permissible investments, establishment and maintenance of reserves, credit for reinsurance and requirements of capital adequacy, and the business conduct of insurers, including marketing and sales practices and claims handling. In addition, statutes and regulations usually require the licensing of insurers and their agents, the approval of policy forms and related materials and the approval of rates for certain lines of insurance.
The types of U.S. insurance laws and regulations applicable to us or our U.S. insurance subsidiaries are described below. Our U.S. mortgage insurance subsidiaries are subject to additional insurance laws and regulations applicable specifically to mortgage insurers discussed below under “—Mortgage Insurance.”
Insurance holding company regulation
All U.S. jurisdictions in which our U.S. insurance subsidiaries conduct insurance business have enacted legislation that requires each U.S. insurance company in a holding company system, except captive insurance
39
companies, to register with the insurance regulatory authority of its jurisdiction of domicile and to furnish that regulatory authority financial and other information concerning the operations of, and the interrelationships and transactions among, companies within its holding company system that may materially affect the operations, management or financial condition of the insurers within the system. These laws and regulations also regulate transactions between insurance companies and their parents and affiliates. Generally, these laws and regulations require that all transactions within a holding company system between an insurer and its affiliates be fair and reasonable and that the insurer’s statutory surplus following any transaction with an affiliate be both reasonable in relation to its outstanding liabilities and adequate to its financial needs. Statutory surplus is the excess of admitted assets over the sum of statutory liabilities and capital. For certain types of agreements and transactions between an insurer and its affiliates, these laws and regulations require prior notification to, and non-disapproval or approval by, the insurance regulatory authority of the insurer’s jurisdiction of domicile.
Periodic reporting
Our insurance subsidiaries must file reports, including detailed annual financial statements, with insurance regulatory authorities in each of the jurisdictions in which they do business, and their operations and accounts are subject to periodic examination by such authorities.
Policy forms
Our U.S. insurance subsidiaries’ policy forms are subject to regulation in every U.S. jurisdiction in which such subsidiaries are licensed to transact insurance business. In most U.S. jurisdictions, policy forms must be filed prior to their use, and in some U.S. jurisdictions, the filed forms must be approved prior to use.
Dividend limitations
As a holding company with no significant business operations of our own, we depend on dividends or other distributions from our subsidiaries as the principal source of cash to meet our obligations, including the payment of interest on, and repayment of principal of, any debt obligations. The payment of dividends or other distributions to us by our U.S. insurance subsidiaries is regulated by the insurance laws and regulations of their respective states of domicile. In general, an insurance company subsidiary may not pay an “extraordinary” dividend or distribution until 30 days after the applicable insurance regulator has received notice of the intended payment and has not objected in such period or has approved the payment within the 30-day period. In general, an “extraordinary” dividend or distribution is defined by these laws and regulations as a dividend or distribution that, together with other dividends and distributions made within the preceding 12 months, exceeds the greater (or, in some jurisdictions, the lesser) of:
| • | 10% of the insurer’s statutory surplus as of the immediately prior year end; or |
| • | the statutory net gain from the insurer’s operations (if a life insurer) or the statutory net income (if not a life insurer) during the prior calendar year. |
The laws and regulations of some of these jurisdictions also prohibit an insurer from declaring or paying a dividend except out of its earned surplus or require the insurer to obtain regulatory approval before it may do so. In addition, insurance regulators may prohibit the payment of ordinary dividends or other payments by our insurance subsidiaries to us (such as a payment under a tax sharing agreement or for employee or other services) if they determine that such payment could be adverse to our policyholders or contractholders.
Market conduct regulation
The laws and regulations of U.S. jurisdictions include numerous provisions governing the marketplace activities of insurers, including provisions governing the form and content of disclosure to consumers, product illustrations, advertising, product replacement, sales and underwriting practices, complaint handling and claims handling. The regulatory authorities in U.S. jurisdictions generally enforce these provisions through periodic market conduct examinations.
40
Statutory examinations
As part of their regulatory oversight process, insurance departments in U.S. jurisdictions conduct periodic detailed examinations of the books, records, accounts and business practices of insurers domiciled in their jurisdictions. These examinations generally are conducted in cooperation with the insurance departments of two or three other states or jurisdictions, representing each of the NAIC zones, under guidelines promulgated by the NAIC.
In the three-year period ended December 31, 2006, we have not received any material adverse findings resulting from any insurance department examinations of our U.S. insurance subsidiaries.
Guaranty associations and similar arrangements
Most of the jurisdictions in which our U.S. insurance subsidiaries are licensed to transact business require life insurers doing business within the jurisdiction to participate in guaranty associations, which are organized to pay contractual benefits owed pursuant to insurance policies of insurers who become impaired or insolvent. These associations levy assessments, up to prescribed limits, on all member insurers in a particular jurisdiction on the basis of the proportionate share of the premiums written by member insurers in the lines of business in which the impaired, insolvent or failed insurer is engaged. Some jurisdictions permit member insurers to recover assessments paid through full or partial premium tax offsets. Aggregate assessments levied against our U.S. insurance subsidiaries were not material to our consolidated financial statements.
Change of control
The laws and regulations of the jurisdictions in which our U.S. insurance subsidiaries are domiciled require that a person obtain the approval of the insurance commissioner of the insurance company’s jurisdiction of domicile prior to acquiring control of the insurer. Generally, such laws provide that control over an insurer is presumed to exist if any person, directly or indirectly, owns, controls, holds with the power to vote, or holds proxies representing, 10% or more of the voting securities of the insurer. In considering an application to acquire control of an insurer, the insurance commissioner generally will consider such factors as the experience, competence and financial strength of the applicant, the integrity of the applicant’s board of directors and executive officers, the acquirer’s plans for the management and operation of the insurer, and any anti-competitive results that may arise from the acquisition. Additionally, in some states, a person seeking to acquire control of an insurance company must make filings prior to completing an acquisition if the acquirer and the target insurance company and their affiliates have sufficiently large market shares in the same lines of insurance in those states. Approval of an acquisition is not required in these states, but the state insurance departments could take action to impose conditions on an acquisition that could delay or prevent its consummation. These laws may discourage potential acquisition proposals and may delay, deter or prevent a change of control involving us, including through transactions, and in particular unsolicited transactions, that some or all of our stockholders might consider to be desirable.
Policy and contract reserve sufficiency analysis
Under the laws and regulations of their jurisdictions of domicile, our U.S. life insurance subsidiaries are required to conduct annual analyses of the sufficiency of their life and health insurance and annuity statutory reserves. In addition, other jurisdictions in which these subsidiaries are licensed may have certain reserve requirements that differ from those of their domiciliary jurisdictions. In each case, a qualified actuary must submit an opinion that states that the aggregate statutory reserves, when considered in light of the assets held with respect to such reserves, make good and sufficient provision for the associated contractual obligations and related expenses of the insurer. If such an opinion cannot be provided, the affected insurer must set up additional reserves by moving funds from surplus. Our U.S. life insurance subsidiaries submit these opinions annually to applicable insurance regulatory authorities. Different reserve requirements exist for our U.S. mortgage insurance subsidiaries. See “—Reserves—Mortgage Insurance.”
41
Surplus and capital requirements
Insurance regulators have the discretionary authority, in connection with the ongoing licensing of our U.S. insurance subsidiaries, to limit or prohibit the ability of an insurer to issue new policies if, in the regulators’ judgment, the insurer is not maintaining a minimum amount of surplus or is in hazardous financial condition. Insurance regulators may also limit the ability of an insurer to issue new life insurance policies and annuity contracts above an amount based upon the face amount and premiums of policies of a similar type issued in the prior year. We do not believe that the current or anticipated levels of statutory surplus of our U.S. insurance subsidiaries present a material risk that any such regulator would limit the amount of new policies that our U.S. insurance subsidiaries may issue.
Risk-based capital
The NAIC has established risk-based capital standards for U.S. life insurance companies as well as a model act with the intention that these standards be applied at the state level. The model act provides that life insurance companies must submit an annual risk-based capital report to state regulators reporting their risk-based capital based upon four categories of risk: asset risk, insurance risk, interest rate risk and business risk. For each category, the capital requirement is determined by applying factors to various asset, premium and reserve items, with the factor being higher for those items with greater underlying risk and lower for less risky items. The formula is intended to be used by insurance regulators as an early warning tool to identify possibly weak capitalized companies for purposes of initiating further regulatory action.
If an insurer’s risk-based capital falls below specified levels, the insurer would be subject to different degrees of regulatory action depending upon the level. These actions range from requiring the insurer to propose actions to correct the capital deficiency to placing the insurer under regulatory control. As of December 31, 2006, the risk-based capital of each of our U.S. life insurance subsidiaries exceeded the level of risk-based capital that would require any of them to take or become subject to any corrective action.
Statutory accounting principles
Statutory accounting principles (“SAP”) is a basis of accounting developed by U.S. insurance regulators to monitor and regulate the solvency of insurance companies. In developing SAP, insurance regulators were primarily concerned with assuring an insurer’s ability to pay all its current and future obligations to policyholders. As a result, statutory accounting focuses on conservatively valuing the assets and liabilities of insurers, generally in accordance with standards specified by the insurer’s domiciliary jurisdiction. Uniform statutory accounting practices are established by the NAIC and generally adopted by regulators in the various U.S. jurisdictions. These accounting principles and related regulations determine, among other things, the amounts our insurance subsidiaries may pay to us as dividends.
U.S. GAAP is designed to measure a business on a going-concern basis. It gives consideration to matching of revenue and expenses and, as a result, certain expenses are capitalized when incurred and then amortized over the life of the associated policies. The valuation of assets and liabilities under U.S. GAAP is based in part upon best estimate assumptions made by the insurer. Stockholders’ equity represents both amounts currently available and amounts expected to emerge over the life of the business. As a result, the values for assets, liabilities and equity reflected in financial statements prepared in accordance with U.S. GAAP are materially different from those reflected in financial statements prepared under SAP.
Regulation of investments
Each of our U.S. insurance subsidiaries is subject to laws and regulations that require diversification of its investment portfolio and limit the proportion of investments in certain asset categories, such as below investment grade fixed maturities, equity real estate, other equity investments and derivatives. Failure to comply with these
42
laws and regulations renders assets invested contrary to such regulatory limitations to be treated as non-admitted assets for purposes of measuring surplus, and, in some instances, would require divestiture of such non-complying investments. We believe the investments made by our U.S. insurance subsidiaries comply with these laws and regulations.
Federal regulation
Our variable life insurance and variable annuity products generally are “securities” within the meaning of federal and state securities laws. As a result, they are registered under the Securities Act of 1933 and are subject to regulation by the SEC, the NASD and state securities authorities. Federal and state securities regulation similar to that discussed below under “—Securities Regulation” affect investment advice and sales and related activities with respect to these products. In addition, although the federal government does not comprehensively regulate the business of insurance, federal legislation and administrative policies in several other areas, including taxation, financial services regulation and pension and welfare benefits regulation, can also significantly affect the insurance industry.
Federal initiatives
Although the federal government generally does not directly regulate the insurance business, federal initiatives often, and increasingly, have an impact on the business in a variety of ways. From time to time, federal measures are proposed which may significantly affect the insurance business, including limitations on antitrust immunity, tax incentives for lifetime annuity payouts, simplification bills affecting tax-advantaged or tax-exempt savings and retirement vehicles, and proposals to modify or make permanent the estate tax repeal enacted in 2001. In addition, various forms of direct federal regulation of insurance have been proposed in recent years. We cannot predict whether any such proposals will be adopted, or what impact, if any, such proposals or, if adopted, such laws may have on our business, financial condition or results of operation.
Changes in tax laws
Changes in tax laws could make some of our products less attractive to consumers. For example, the gradual repeal of the federal estate tax, begun in 2001, is continuing to be phased in through 2010. The repeal and continuing uncertainty created by the repeal of the federal estate tax has resulted in reduced sales, and could continue to adversely affect sales and surrenders, of some of our estate planning products, including survivorship/second-to-die life insurance policies. In May 2003, the Jobs and Growth Tax Relief Reconciliation Act of 2003 was signed into law to lower the federal income tax rate on capital gains and certain ordinary dividends. This reduction may provide an incentive for certain of our customers and potential customers to shift assets into mutual funds and away from our products, including annuities that are designed to defer taxes payable on investment returns. On the other hand, individual income tax rates are scheduled to revert to previous levels in 2010, and that could have a positive influence on the interest of investors in our products. Similarly, the 2008 expiration of favorable income tax rates for dividend income could increase interest in our products.
U.K. Insurance Regulation
General
Insurance and reinsurance businesses in the U.K. are subject to close regulation by the Financial Services Authority (“FSA”). We have U.K. subsidiaries that have received authorization from the FSA to effect and carry out contracts of insurance in the U.K. An authorized insurer in the U.K. is generally able to operate throughout the European Union, subject to satisfying certain requirements of the FSA and in some cases, certain local regulatory requirements. Certain of our U.K. subsidiaries operate in other member states of the European Union through the establishment of branch offices.
43
Supervision
The FSA has adopted a risk-based approach to the supervision of insurance companies. Under this approach the FSA periodically performs a formal risk assessment of insurance companies or groups carrying on business in the U.K. After each risk assessment, the FSA will inform the insurer of its views on the insurer’s risk profile. This will include details of any remedial action that the FSA requires and the likely consequences if this action is not taken.
The FSA also supervises the management of insurance companies through the approved persons regime, by which any appointment of persons to perform certain specified “controlled functions” within a regulated entity, must be approved by the FSA.
In addition, in January 2005, the FSA began to supervise the sale of general insurance, including payment protection insurance and mortgage insurance. Under FSA rules, persons who are involved in the sale of general insurance (including insurers and distributors) are prohibited from offering or accepting any inducement in connection with the sale of general insurance that is likely to conflict materially with their duties to insureds. Although the rules do not generally require disclosure of broker compensation, the insurer or distributor must disclose broker compensation at the insured’s request.
Solvency requirements
Under FSA rules, insurance companies must maintain a minimum amount of capital resources for solvency purposes at all times, the calculation of which in any particular case depends on the type, amount and claims history of insurance business a company writes. Failure to maintain the required minimum amount of capital resources is one of the grounds on which wide powers of intervention conferred upon the FSA may be exercised. In addition, an insurer that is part of a group is required to perform and submit to the FSA a capital resources calculation return in respect of the following:
| • | The solvency capital resources available to the European group to which the U.K. insurance company belongs. The European group is defined by reference to the U.K. insurance company’s ultimate parent company domiciled in the European Economic Area. Prior to December 31, 2006, this requirement was only a reporting requirement. However, after December 31, 2006, the FSA will be required to take action where the solvency capital requirements of the European group exceed that group’s available capital resources. |
| • | The solvency capital resources available to the worldwide group to which the U.K. insurance company belongs. The worldwide group is defined by reference to the U.K. insurance company’s ultimate insurance parent company. This requirement is only a reporting requirement. |
Restrictions on dividend payments
English company law prohibits our U.K. subsidiaries from declaring a dividend to their stockholders unless they have “profits available for distribution.” The determination of whether a company has profits available for distribution is based on its audited accumulated realized profits less its accumulated realized losses.
Change of control
The acquisition of “control” of any U.K. insurance company will require prior FSA approval. For these purposes, a party that “controls” a U.K. insurance company includes any company or individual that (together with its or his associates) directly or indirectly acquires 10% or more of the shares in a U.K. authorized insurance company or its parent company, or (amongst others) is entitled to exercise or control the exercise of 10% or more of the voting power in such authorized insurance company or its parent company or is able to exercise significant influence over the management of the authorized insurance company or its parent company by virtue of its shareholding or voting power. The requirement for prior FSA approval also exists where an existing approved
44
controller increases its “control” through certain thresholds (20%, 33% and 50%). In considering whether to approve an application for approval, the FSA must be satisfied that both the acquirer is a fit and proper person to have such “control” and that the interests of consumers would not be threatened by such acquisition of “control.” Failure to make the relevant prior application could result in action being taken against our U.K. subsidiaries by the FSA.
Intervention and enforcement
The FSA has extensive powers to intervene in the affairs of an insurance company or authorized person and has the power, among other things, to enforce, and take disciplinary measures in respect of, breaches of its rules, which includes the variation or withdraw of any authorizations.
Mortgage Insurance
State regulation
General
Mortgage insurers generally are restricted by state insurance laws and regulations to writing mortgage insurance business only. This restriction prohibits our mortgage insurance subsidiaries from directly writing other types of insurance. Mortgage insurers are not subject to the NAIC’s risk-based capital requirements, but are subject to other capital requirements placed directly on mortgage insurers. Generally, mortgage insurers are required by certain states and other regulators to maintain a risk in-force to capital ratio not to exceed 25:1. As of December 31, 2006, none of our U.S. mortgage insurance subsidiaries had a risk in-force to capital ratio in excess of 25:1.
Reserves
Our U.S. mortgage insurance subsidiaries are required under state insurance laws to establish a special statutory contingency reserve in their statutory financial statements to provide for losses in the event of significant economic declines. Annual additions to the statutory contingency reserve must be equal to the greater of (i) 50% of net earned premiums or (ii) the required level of policyholder’s position, as defined by state insurance laws. These contingency reserves generally are held until the earlier of (i) the time that loss ratios exceed 35% or (ii) ten years. The statutory contingency reserve as of December 31, 2006 for our U.S. mortgage insurance subsidiaries was approximately $2.4 billion. This reserve reduces our policyholder surplus.
Federal regulation
In addition to federal laws that directly affect mortgage insurers, private mortgage insurers are affected indirectly by federal legislation and regulation affecting mortgage originators and lenders, by purchasers of mortgage loans such as Freddie Mac and Fannie Mae, and by governmental insurers such as the FHA and VA. For example, changes in federal housing legislation and other laws and regulations that affect the demand for private mortgage insurance may have a material effect on private mortgage insurers. Legislation or regulation that increases the number of people eligible for FHA or VA mortgages could have a materially adverse effect on our ability to compete with the FHA or VA.
The Homeowners Protection Act provides for the automatic termination, or cancellation upon a borrower’s request, of private mortgage insurance upon satisfaction of certain conditions. The Homeowners Protection Act applies to owner-occupied residential mortgage loans regardless of lien priority and to borrower-paid mortgage insurance closed after July 29, 1999. FHA loans are not covered by the Homeowners Protection Act. Under the Homeowners Protection Act, automatic termination of mortgage insurance would generally occur once the loan-to-value ratio reaches 78%. A borrower generally may request cancellation of mortgage insurance once the actual payments reduce the loan balance to 80% of the home’s original value. For borrower-initiated cancellation of mortgage insurance, the borrower must have a “good payment history” as defined by the Homeowners Protection Act.
45
The Real Estate Settlement and Procedures Act of 1974 (“RESPA”) applies to most residential mortgages insured by private mortgage insurers. Mortgage insurance has been considered in some cases to be a “settlement service” for purposes of loans subject to RESPA. Subject to limited exceptions, RESPA precludes us from providing services to mortgage lenders free of charge, charging fees for services that are lower than their reasonable or fair market value, and paying fees for services that others provide that are higher than their reasonable or fair market value. In addition, RESPA prohibits persons from giving or accepting any portion or percentage of a charge for a real estate settlement service, other than for services actually performed. Although many states prohibit mortgage insurers from giving rebates, RESPA has been interpreted to cover many non-fee services as well. Both mortgage insurers and their customers are subject to the possible sanctions of this law, which may be enforced by HUD, state insurance departments, state attorneys general and other enforcement authorities.
The Equal Credit Opportunity Act (“ECOA”) and the Fair Credit Reporting Act (“FCRA”) also affect the business of mortgage insurance in various ways. ECOA, for example, prohibits discrimination against certain protected classes in credit transactions. FCRA governs the access and use of consumer credit information in credit transactions and requires notices to consumers in certain circumstances.
Most originators of mortgage loans are required to collect and report data relating to a mortgage loan applicant’s race, nationality, gender, marital status and census tract to HUD or the Federal Reserve under the Home Mortgage Disclosure Act of 1975 (“HMDA”). The purpose of HMDA is to detect possible impermissible discrimination in home lending and, through disclosure, to discourage such discrimination. Mortgage insurers are not required to report HMDA data although, under the laws of several states, mortgage insurers currently are prohibited from discriminating on the basis of certain classifications. Mortgage insurers have, through MICA, entered voluntarily into an agreement with the Federal Financial Institutions Examinations Council to report the same data on loans submitted for insurance as is required for most mortgage lenders under HMDA.
International regulation
Canada
The Office of the Superintendent of Financial Institutions (“OSFI”) provides oversight to all federally incorporated financial institutions, including our Canadian mortgage insurance company. OSFI does not have enforcement powers over market conduct issues in the insurance industry. Market conduct issues are a provincial responsibility. The Federal Bank Act, Insurance Companies Act and Trust and Loan Companies Act prohibits Canadian banks, trust companies and insurers from extending mortgage loans where the loan value exceeds 75% of the property’s value, unless mortgage insurance is obtained in connection with the loan. As a result, all mortgages issued by these financial institutions with a loan-to-value ratio exceeding 75% must be insured by a qualified insurer or the CMHC.
On November 27, 2006, legislation was introduced in the Canadian Parliament to raise from 75% to 80% the loan-to-value threshold above which mortgage insurance is required by federal statute. This was a result of a periodic review of the federal financial services regulatory framework that was commenced in February 2005 by the Canadian Department of Finance and may be passed by the Canadian Parliament before the end of April 2007. The increase in the loan-to value threshold from 75% to 80% above which mortgage insurance is required by federal statute may result in a reduction in the amount of business we write in future years in Canada.
We have an agreement with the Canadian government under which it guarantees the benefits payable under a mortgage insurance policy, less 10% of the original principal amount of an insured loan, in the event that we fail to make claim payments with respect to that loan because of insolvency. We pay the Canadian government a risk premium for this guarantee and make other payments to a reserve fund in respect of the government’s obligation. Because banks are not required to maintain regulatory capital on an asset backed by a sovereign guarantee, our 90% sovereign guarantee permits lenders purchasing our mortgage insurance to reduce their regulatory capital charges for credit risks on mortgages by 90%.
46
The legislative requirement in Canada to obtain mortgage insurance on high loan-to-value mortgages and the favorable capital treatment given to financial institutions because of our 90% sovereign guarantee effectively precludes these financial institutions from issuing simultaneous second mortgage products similar to those offered in the U.S.
Australia
APRA regulates all financial institutions in Australia, including general, life and mortgage insurance companies. Effective July 1, 2002, APRA provided new regulatory standards for all general insurers, including mortgage insurance companies. APRA’s license conditions currently require Australian mortgage insurance companies, including us, to be mono-line insurers, which are insurance companies that offer just one type of insurance product.
APRA also sets authorized capital levels and regulates corporate governance requirements, including our risk management strategy. In this regard, APRA reviews our management, controls, processes, reporting and methods by which all risks are managed, including a periodic review of outstanding insurance liabilities by an approved actuary, and a reinsurance management strategy, which outlines our use of reinsurance in Australia.
In addition, APRA determines the capital requirements for depository institutions and provides for reduced capital requirements for depository institutions that insure residential mortgages with an “acceptable” mortgage insurance company with loan-to-value ratios above 80% (in the case of standard loans) and, from October 1, 2004, with loan-to-value ratios above 60% (in the case of non-standard type loans). APRA’s regulations currently set out a number of circumstances in which a loan may be considered to be non-standard from a depositary institution’s perspective.
Effective January 1, 2006, APRA adopted new regulations regarding:
| • | Minimum capital requirements for mortgage insurance companies; |
| • | Reporting obligations of mortgage insurance companies; and |
| • | The conditions under which depositary institutions will be entitled to reduced capital requirements for insured loans. |
The new regulations impose significantly higher minimum capital requirements on mortgage insurance companies to assure that they have sufficient capital to withstand a hypothetical three-year stress loss scenario. In addition, the new regulations increase mortgage insurance companies’ capital requirements for insured loans that are considered to be non-standard. Our Australian mortgage insurance subsidiary met these new minimum capital requirements as of January 1, 2006 by holding capital sufficient to maintain financial-strength ratings of “AA” (Very Strong) from S&P and Fitch and “Aa2” (Excellent) from Moody’s.
The new regulations also impose additional quarterly reporting obligations on mortgage insurance companies with respect to risk profiles and reinsurance arrangements, amend the definition of an ‘acceptable’ mortgage insurance company and eliminate the reduced capital requirements for depositary institutions in the event that the mortgage insurance company has contractual recourse to the depositary institution or a member of its consolidated group. The new regulations did not make any change to the loan-to-value-ratios at which a loan may be eligible for reduced capital treatment if insured with an ‘acceptable’ mortgage insurance company (which ratios remain at 80% and 60% in the case of standard and non-standard loans, respectively).
United Kingdom and Europe
The U.K. is a member of the European Union and applies the harmonized system of regulation set out in the European Union directives. Our authorization to provide mortgage insurance in the U.K. enables us to offer our products in all the European Union member states, subject to certain regulatory requirements of the FSA and, in
47
some cases, local regulatory requirements. We can provide mortgage insurance only in the classes for which we have authorization under applicable regulations and must maintain required risk capital reserves. We are also subject to the oversight of other regulatory agencies in other countries where we do business throughout Europe. For more information about U.K. insurance regulation that affects our mortgage subsidiaries that operate in the U.K., see “—U.K. Insurance Regulation.”
Other Non-U.S. Insurance Regulation
We operate in a number of countries around the world in addition to the U.S., Canada, Australia and the United Kingdom. These countries include Mexico, Japan, Spain, Guernsey and Bermuda. Generally, our subsidiaries (and in some cases our branches) conducting business in these countries must obtain licenses from local regulatory authorities and satisfy local regulatory requirements, including those relating to rates, forms, capital, reserves and financial reporting.
Other Laws and Regulations
Securities regulation
Certain of our U.S. subsidiaries and certain policies, contracts and services offered by them, are subject to regulation under federal and state securities laws and regulations of the SEC, state securities regulators and the NASD. Certain of our U.S. subsidiaries are investment advisers registered under the Investment Advisers Act of 1940 or applicable state securities laws. Certain of their employees are licensed as investment advisory representatives in states as required by state law. Two of our U.S. investment adviser subsidiaries manage investment companies that are registered with the SEC under the Investment Company Act of 1940. In addition, some of our insurance company separate accounts are registered under the Investment Company Act of 1940. Some annuity contracts and insurance policies issued by some of our U.S. subsidiaries are funded by separate accounts, the interests in which are registered under the Securities Act of 1933. Certain of our U.S. subsidiaries are registered and regulated as broker/dealers under the Securities Exchange Act of 1934 and are members of, and subject to regulation by, the NASD, as well as by various state and local regulators. The registered representatives of our broker/dealers are also regulated by the SEC and NASD and are further subject to applicable state and local laws.
These laws and regulations are primarily intended to protect investors in the securities markets and generally grant supervisory agencies broad administrative powers, including the power to limit or restrict the conduct of business for failure to comply with such laws and regulations. In such event, the possible sanctions that may be imposed include suspension of individual employees, limitations on the activities in which the investment adviser or broker/dealer may engage, suspension or revocation of the investment adviser or broker/dealer registration, censure or fines. We may also be subject to similar laws and regulations in the states and other countries in which we provide investment advisory services, offer the products described above or conduct other securities-related activities.
Certain of our U.S. subsidiaries also sponsor and manage investment vehicles that rely on certain exemptions from registration under the Investment Company Act of 1940 and the Securities Act of 1933. Nevertheless, certain provisions of the Investment Company Act of 1940 and the Securities Act of 1933 apply to these investment vehicles and the securities issued by such vehicles. The Investment Company Act of 1940, the Investment Advisers Act of 1940 and the Securities Act of 1933, including the rules promulgated thereunder, are subject to change, which may affect our U.S. subsidiaries that sponsor and manage such investment vehicles.
The SEC, NASD, state attorneys general, other federal offices and the NYSE may conduct periodic examinations, in addition, to special or targeted examinations of us and/or specific products. These examinations or inquiries may include, but are not necessarily limited to, product disclosures and sales issues, financial and accounting disclosure and operational issues. Often examinations are “sweep exams” whereby the regulator reviews current issues facing the financial or insurance industry.
48
Environmental considerations
As an owner and operator of real property, we are subject to extensive U.S. federal and state and non-U.S. environmental laws and regulations. Potential environmental liabilities and costs in connection with any required remediation of such properties also is an inherent risk in property ownership and operation. In addition, we hold equity interests in companies and have made loans secured by properties that could potentially be subject to environmental liabilities. We routinely have environmental assessments performed with respect to real estate being acquired for investment and real property to be acquired through foreclosure. We cannot provide assurance that unexpected environmental liabilities will not arise. However, based upon information currently available to us, we believe that any costs associated with compliance with environmental laws and regulations or any remediation of such properties will not have a material adverse effect on our business, financial condition or results of operations.
ERISA considerations
We provide certain products and services to certain employee benefit plans that are subject to ERISA or the Internal Revenue Code. As such, our activities are subject to the restrictions imposed by ERISA and the Internal Revenue Code, including the requirement under ERISA that fiduciaries must perform their duties solely in the interests of ERISA plan participants and beneficiaries and the requirement under ERISA and the Internal Revenue Code that fiduciaries may not cause a covered plan to engage in certain prohibited transactions with persons who have certain relationships with respect to such plans. The applicable provisions of ERISA and the Internal Revenue Code are subject to enforcement by the U.S. Department of Labor, the IRS and the Pension Benefit Guaranty Corporation.
USA PATRIOT Act
The USA PATRIOT Act of 2001 (“the Patriot Act”), enacted in response to the terrorist attacks on September 11, 2001, contains anti-money laundering and financial transparency laws and mandates the implementation of various new regulations applicable to broker/dealers and other financial services companies including insurance companies. The Patriot Act seeks to promote cooperation among financial institutions, regulators and law enforcement entities in identifying parties that may be involved in terrorism or money laundering. Anti-money laundering laws outside of the U.S. contain similar provisions. The increased obligations of financial institutions to identify their customers, watch for and report suspicious transactions, respond to requests for information by regulatory authorities and law enforcement agencies, and share information with other financial institutions, require the implementation and maintenance of internal practices, procedures and controls. We believe that we have implemented, and that we maintain, appropriate internal practices, procedures and controls to enable us to comply with the provisions of the Patriot Act. Certain additional requirements will be applicable under the Patriot Act in May 2006, and we will comply with these new provisions as they become applicable.
Privacy of consumer information
U.S. federal and state laws and regulations require financial institutions, including insurance companies, to protect the security and confidentiality of consumer financial information and to notify consumers about their policies and practices relating to their collection and disclosure of consumer information and their policies relating to protecting the security and confidentiality of that information. Similarly, federal and state laws and regulations also govern the disclosure and security of consumer health information. In particular, regulations promulgated by the U.S. Department of Health and Human Services regulate the disclosure and use of protected health information by health insurers and others, the physical and procedural safeguards employed to protect the security of that information and the electronic transmission of such information. Congress and state legislatures are expected to consider additional legislation relating to privacy and other aspects of consumer information.
In Europe, the collection and use of personal information is subject to strict regulation. The European Union’s Data Protection Directive establishes a series of privacy requirements that EU member states are obliged
49
to enact in their national legislation. European countries that are not EU member states have similar privacy requirements in their national laws. These requirements generally apply to all businesses, including insurance companies. In general, companies may process personal information only if consent has been obtained from the persons concerned or if certain other conditions are met. These other requirements include the provision of notice to customers and other persons concerning how their personal information is used and disclosed, limitations on the transfer of personal information to countries outside the European Union, registration with the national privacy authorities, where applicable, and the use of appropriate information security measures against the access or use of personal information by unauthorized persons. Similar laws and regulations protecting the security and confidentiality of consumer and financial information are also in effect in Canada, Australia and other countries in which we operate.
50
| Item 1A. | Risk Factors |
You should carefully consider the following risks. These risks could materially affect our business, results of operations or financial condition, cause the trading price of our common stock to decline materially or cause our actual results to differ materially from those expected or those expressed in any forward looking statements made by us or on our behalf. These risks are not exclusive, and additional risks to which we are subject include, but are not limited to, the factors mentioned under “Item 7. Management’s Discussion and Analysis of Financial Condition and Results of Operations—Cautionary note regarding forward-looking statements” and the risks of our businesses described elsewhere in this Annual Report on Form 10-K.
Risks Relating to Our Businesses
Interest rate fluctuations could adversely affect our business and profitability.
Our insurance and investment products are sensitive to interest rate fluctuations and expose us to the risk that falling interest rates will reduce our “spread,” or the difference between the returns we earn on the investments that support our obligations under these products and the amounts that we must pay policyholders and contractholders. Because we may reduce the interest rates we credit on most of these products only at limited, pre-established intervals, and because some of them have guaranteed minimum crediting rates, declines in interest rates may adversely affect the profitability of those products.
During periods of increasing market interest rates, we may offer higher crediting rates on interest-sensitive products, such as universal life insurance and fixed annuities, and we may increase crediting rates on in-force products to keep these products competitive. In addition, rapidly rising interest rates may cause increased policy surrenders, withdrawals from life insurance policies and annuity contracts and requests for policy loans, as policyholders and contractholders shift assets into higher yielding investments. Increases in crediting rates, as well as surrenders and withdrawals, could have an adverse effect on our financial condition and results of operations.
Our term life and long-term care insurance products also expose us to the risk of interest rate fluctuations. The pricing and expected future profitability of these products are based in part on expected investment returns. Over time, term life and long-term care insurance products generally produce positive cash flows as customers pay periodic premiums, which we invest as we receive them. Low interest rates may reduce our ability to achieve our targeted investment margins and may adversely affect the profitability of our term life and long-term care insurance products.
In the U.S. mortgage market, rising interest rates generally reduce the volume of new mortgage originations. A decline in the volume of new mortgage originations would have an adverse effect on our new mortgage insurance written. Rising interest rates also can increase the monthly mortgage payments for insured homeowners with adjustable rate mortgages (“ARM”) which could have the effect of increasing default rates on ARM loans and thereby increasing our exposure on our mortgage insurance policies. This is particularly relevant in our non-U.S. mortgage insurance business, where ARMs are the predominant mortgage product. ARMs also have increased as a percentage of the U.S. mortgage loans that we insure.
Declining interest rates increase the rate at which insured borrowers refinance their existing mortgages, thereby resulting in cancellations of the mortgage insurance covering the refinanced loans. Declining interest rates may also contribute to home price appreciation, which may provide insured borrowers in the U.S. with the option of canceling their mortgage insurance coverage earlier than we anticipated in pricing that coverage. These cancellations could have an adverse effect on our results from our mortgage insurance business.
Interest rate fluctuations also could have an adverse effect on the results of our investment portfolios. During periods of declining market interest rates, the interest we receive on variable interest rate investments decreases. In addition, during those periods, we are forced to reinvest the cash we receive as interest or return of
51
principal on our investments in lower-yielding high-grade instruments or in lower-credit instruments to maintain comparable returns. Issuers of fixed-income securities also may decide to prepay their obligations in order to borrow at lower market rates, which exacerbates the risk that we may have to invest the cash proceeds of these securities in lower-yielding or lower-credit instruments. Interest rates during 2003 reached an historic low and have increased through 2006.
Downturns and volatility in equity markets could adversely affect our business and profitability.
Significant downturns and volatility in equity markets could have an adverse effect on our financial condition and results of operations in two principal ways. First, market downturns and volatility may discourage purchases of separate account products, such as variable annuities and variable life insurance, that have returns linked to the performance of the equity markets and may cause some existing customers to withdraw cash values or reduce investments in those products.
Second, downturns and volatility in equity markets can have an adverse effect on the revenues and returns from our mutual fund wrapped and separately managed account products and services. Because these products and services generate fees generally from the value of assets under management, a decline in the equity markets could reduce our revenues by reducing the value of the investment assets we manage.
Defaults in our fixed-income securities and commercial mortgage loan portfolio may reduce our income.
Issuers of the fixed-income securities and commercial mortgage loans that we own may default on principal and interest payments. As of December 31, 2006 and 2005, we had fixed maturities in or near default (where the issuer has missed payment of principal or interest or entered bankruptcy) with a fair value of $16 million and $47 million, respectively. An economic downturn, or a variety of other factors could cause declines in the value of our fixed maturities portfolio and cause our net income to decline.
A downgrade or a potential downgrade in our financial strength or credit ratings could result in a loss of business and adversely affect our financial condition and results of operations.
Financial strength ratings, which various ratings organizations publish as measures of an insurance company’s ability to meet contractholder and policyholder obligations, are important to maintaining public confidence in our products, the ability to market our products and our competitive position. Our principal life insurance companies currently have financial strength ratings of “AA-” (Very Strong) from S&P and Fitch and “Aa3” (Excellent) from Moody’s. Our mortgage insurance companies currently have financial strength ratings of “AA” (Very Strong) from S&P and Fitch, “Aa2” (Excellent) from Moody’s and/or “AA” (Superior) from DBRS. The “AA” and “AA-” ratings are the third- and fourth-highest of S&P’s 20 ratings categories, respectively. The “Aa2” and “Aa3” ratings are the third- and fourth-highest of Moody’s 21 ratings categories, respectively. The “AA” and “AA-” ratings are the third- and fourth-highest of Fitch’s 24 ratings categories. The “AA” rating is the second highest of DBRS’s 10 ratings categories.
A downgrade in our financial strength ratings, or the announced potential for a downgrade, could have a significantly adverse effect on our financial condition and results of operations in many ways, including:
| • | reducing new sales of insurance products, annuities and other investment products; |
| • | adversely affecting our relationships with independent sales intermediaries and our dedicated sales specialists; |
| • | materially increasing the number or amount of policy surrenders and withdrawals by contractholders and policyholders; |
| • | requiring us to reduce prices for many of our products and services to remain competitive; |
| • | adversely affecting our ability to obtain reinsurance or obtain reasonable pricing on reinsurance; and |
| • | increasing our cost of borrowing. |
52
If our mortgage insurance companies’ financial strength ratings decrease below the thresholds established by Fannie Mae and Freddie Mac (“AA-” by S&P and “Aa3” by Moody’s), we would not be able to insure mortgages purchased by Fannie Mae or Freddie Mac. As of December 31, 2006, Fannie Mae and Freddie Mac purchased the majority of the flow loans we insured in the U.S. An inability to insure mortgage loans sold to Fannie Mae or Freddie Mac, or their transfer of our existing policies to an alternative mortgage insurer, would have an adverse effect on our financial condition and results of operations.
If our reserves for future policy claims are inadequate, we may be required to increase our reserve liabilities, which could adversely affect our results of operations and financial condition.
We calculate and maintain reserves for estimated future payments of claims to our policyholders and contractholders in accordance with U.S. GAAP and industry accounting practices. We release these reserves as those future obligations are extinguished. The reserves we establish necessarily reflect estimates and actuarial assumptions with regard to our future experience. These estimates and actuarial assumptions involve the exercise of significant judgment. Our future financial results depend significantly upon the extent to which our actual future experience is consistent with the assumptions we have used in pricing our products and determining our reserves. Many factors can affect future experience, including economic and social conditions, inflation, healthcare costs, policyholder persistency (resulting in adverse claims experience), and changes in doctrines of legal liability and damage awards in litigation. Therefore, we cannot determine with precision the ultimate amounts we will pay for actual claims or the timing of those payments.
We regularly monitor our reserves. If we conclude that our reserves are insufficient to cover actual or expected policy and contract benefits and claims payments, we would be required to increase our reserves and incur income statement charges for the period in which we make the determination, which could adversely affect our results of operations and financial condition.
As a holding company, we depend on the ability of our subsidiaries to transfer funds to us to pay dividends and to meet our obligations.
We act as a holding company for our insurance subsidiaries and do not have any significant operations of our own. Dividends from our subsidiaries and permitted payments to us under our tax sharing arrangements with our subsidiaries are our principal sources of cash to pay stockholder dividends and to meet our obligations. These obligations include our operating expenses, interest and principal on our current and any future borrowings and contract adjustment payments on our Equity Units. These obligations also include amounts we owe to GE under the tax matters agreement that we and GE entered into in connection with our IPO. If the cash we receive from our subsidiaries pursuant to dividend payment and tax sharing arrangements is insufficient for us to fund any of these obligations, we may be required to raise cash through the incurrence of debt, the issuance of additional equity or the sale of assets.
The payment of dividends and other distributions to us by our insurance subsidiaries is regulated by insurance laws and regulations. In general, dividends in excess of prescribed limits are deemed “extraordinary” and require insurance regulatory approval. In addition, insurance regulators may prohibit the payment of ordinary dividends or other payments by our insurance subsidiaries to us (such as a payment under a tax sharing agreement or for employee or other services) if they determine that such payment could be adverse to our policyholders or contractholders. The ability of our insurance subsidiaries to pay dividends to us, and our ability to pay dividends to our stockholders, are also subject to various conditions imposed by the rating agencies for us to maintain our ratings.
Intense competition could negatively affect our ability to maintain or increase our market share and profitability.
Our businesses are subject to intense competition. We believe the principal competitive factors in the sale of our products are product features, price, commission structure, marketing and distribution arrangements, brand, reputation, financial strength ratings and service.
53
Many other companies actively compete for sales in our protection and retirement income and investments markets, including other major insurers, banks, other financial institutions, mutual fund and money asset management firms and specialty and capital markets providers. In addition, alternative products that leverage the capital markets could compete with traditional insurance products and reduce our market share. The principal direct and indirect competitors for our U.S. and increasingly, international mortgage insurance businesses include other private mortgage insurers and structured transactions in the capital markets and with other financial instruments designed to manage credit risk, such as credit default swaps and credit linked notes, with lenders who forego mortgage insurance, or self-insure, on loans held in their portfolios, and with lenders that provide mortgage reinsurance through captive mortgage reinsurance programs. Further, we also compete with governmental and quasi-governmental agencies, including in the U.S., the FHA and to a lesser degree, the VA, Fannie Mae and Freddie Mac. In Canada and some European countries, our mortgage insurance business competes directly with government entities, which provide comparable mortgage insurance. Government entities with which we compete typically do not have the same capital requirements and do not have the same profit objectives as we do.
In many of our product lines, we face competition from competitors that have greater market share or breadth of distribution, offer a broader range of products, services or features, assume a greater level of risk, have lower profitability expectations or have higher financial strength ratings than we do. Many competitors offer similar products and use similar distribution channels. The substantial expansion of banks’ and insurance companies’ distribution capacities and expansion of product features in recent years have intensified pressure on margins and production levels and have increased the level of competition in many of our business lines. In addition, in recent years, banks, insurance companies and other financial services companies, many of which offer products similar to ours and use similar distribution channels, have consolidated. Further consolidation among banks, insurance companies and other financial services companies could have an adverse effect on our financial condition and results of operations if the surviving entity requires more favorable terms than we had previously been offering to one or more of the combined companies or if it elects not to continue to do business with us following the consolidation.
Reinsurance may not be available, affordable or adequate to protect us against losses.
As part of our overall risk and capacity management strategy, we purchase reinsurance for certain risks underwritten by our various business segments. Market conditions beyond our control determine the availability and cost of the reinsurance protection we purchase. Accordingly, we may be forced to incur additional expenses for reinsurance or may not be able to obtain sufficient reinsurance on acceptable terms, which could adversely affect our ability to write future business.
If the counterparties to our reinsurance arrangements or to the derivative instruments we use to hedge our business risks default or fail to perform, we may be exposed to risks we had sought to mitigate, which could adversely affect our financial condition and results of operations.
We use reinsurance and derivative instruments to mitigate our risks in various circumstances. Reinsurance does not relieve us of our direct liability to our policyholders, even when the reinsurer is liable to us. Accordingly, we bear credit risk with respect to our reinsurers. We cannot assure you that our reinsurers will pay the reinsurance recoverable owed to us now or in the future or that they will pay these recoverables on a timely basis. A reinsurer’s insolvency, inability or unwillingness to make payments under the terms of its reinsurance agreement with us could have an adverse effect on our financial condition and results of operations.
Prior to the completion of the IPO, we ceded to UFLIC, effective as of January 1, 2004, policy obligations under our structured settlement contracts, which had reserves of $12.0 billion, and our variable annuity contracts, which had general account reserves of $2.8 billion and separate account reserves of $7.9 billion, in each case as of December 31, 2003. These contracts represent substantially all of our contracts that were in-force as of December 31, 2003 for these products. In addition, effective as of January 1, 2004, we ceded to UFLIC policy
54
obligations under a block of long-term care insurance policies that we reinsured from The Travelers Insurance Company (“Travelers”), which had reserves of $1.5 billion as of December 31, 2003. UFLIC has established trust accounts for our benefit to secure its obligations under the reinsurance arrangements, and General Electric Capital Corporation, an indirect subsidiary of GE, or GE Capital, has agreed to maintain UFLIC’s risk-based capital above a specified minimum level. If UFLIC becomes insolvent notwithstanding this agreement, and the amounts in the trust accounts are insufficient to pay UFLIC’s obligations to us, our financial condition and results of operations could be materially adversely affected.
In addition, we use derivative instruments to hedge various business risks. We enter into a variety of derivative instruments, including options, interest rate and currency swaps with a number of counterparties. If our counterparties fail or refuse to honor their obligations under the derivative instruments, our hedges of the related risk will be ineffective. Such failure could have an adverse effect on our financial condition and results of operations.
Fluctuations in foreign currency exchange rates and international securities markets could negatively affect our profitability.
Our international operations generate revenues denominated in local currencies. For the years ended December 31, 2006, 2005 and 2004, 19%, 20% and 19% of our revenues, respectively, and 35%, 32% and 29% of our net income from continuing operations, respectively, were generated by our international operations. We generally invest cash generated by our international operations in securities denominated in local currencies. As of December 31, 2006 and 2005, approximately 9% and 8%, respectively, of our invested assets were held by our international operations and were invested primarily in non-U.S.-denominated securities. Although investing in securities denominated in local currencies limits the effect of currency exchange rate fluctuation on local operating results, we remain exposed to the impact of fluctuations in exchange rates as we translate the operating results of our foreign operations into our financial statements. We currently do not hedge this exposure, and as a result, period-to-period comparability of our results of operations is affected by fluctuations in exchange rates. For example, our net income for the year ended December 31, 2006 included approximately $12 million, net of tax, due to the favorable impact of changes in foreign exchange rates. In addition, because we derive a significant portion of our income from non-U.S.-denominated revenue, our results of operations could be adversely affected to the extent the dollar value of non-U.S.-denominated revenue is reduced due to a strengthening U.S. dollar.
Our investments in non-U.S.-denominated securities are subject to fluctuations in non-U.S. securities and currency markets, and those markets can be volatile. Non-U.S. currency fluctuations also affect the value of any dividends paid by our non-U.S. subsidiaries to their parent companies in the U.S.
Our insurance businesses are heavily regulated, and changes in regulation may reduce our profitability and limit our growth.
Our insurance operations are subject to a wide variety of laws and regulations. State insurance laws regulate most aspects of our U.S. insurance businesses, and our insurance subsidiaries are regulated by the insurance departments of the states in which they are domiciled and licensed. Our non-U.S. insurance operations are principally regulated by insurance regulatory authorities in the jurisdictions in which they are domiciled.
State laws in the U.S. grant insurance regulatory authorities broad administrative powers with respect to, among other things:
| • | licensing companies and agents to transact business; |
| • | calculating the value of assets to determine compliance with statutory requirements; |
| • | mandating certain insurance benefits; |
| • | regulating certain premium rates; |
| • | reviewing and approving policy forms; |
55
| • | regulating unfair trade and claims practices, including through the imposition of restrictions on marketing and sales practices, distribution arrangements and payment of inducements; |
| • | establishing statutory capital and reserve requirements and solvency standards; |
| • | fixing maximum interest rates on insurance policy loans and minimum rates for guaranteed crediting rates on life insurance policies and annuity contracts; |
| • | approving changes in control of insurance companies; |
| • | restricting the payment of dividends and other transactions between affiliates; and |
| • | regulating the types, amounts and valuation of investments. |
State insurance regulators and the NAIC regularly reexamine existing laws and regulations applicable to insurance companies and their products. Changes in these laws and regulations, or in interpretations thereof, can be made for the benefit of the consumer at the expense of the insurer and thus could have an adverse effect on our financial condition and results of operations.
Our mortgage insurance business is subject to additional laws and regulations. For a discussion of the risks associated with those laws and regulations, see “—Risks Relating to Our Mortgage Insurance Business—Changes in regulations that affect the mortgage insurance business could affect our operations significantly and could reduce the demand for mortgage insurance.”
We have significant operations internationally that could be adversely affected by changes in political or economic stability or government policies where we operate.
We have a presence in more than 25 countries around the world. Global economic and regulatory developments could affect our business in many ways. For example, our operations are subject to local regulations, which in many ways are similar to the state regulations outlined above. Many of our international customers and independent sales intermediaries also operate in regulated environments. Changes in the regulations that affect their operations also may affect our business relationships with them and their ability to purchase or to distribute our products. These changes could have an adverse effect on our financial condition and results of operations. In addition, compliance with applicable laws and regulations is time consuming and personnel-intensive, and changes in these laws and regulations may increase materially our direct and indirect compliance and other expenses of doing business, thus having an adverse effect on our financial condition and results of operations.
Local economic conditions, including inflation, recession and currency fluctuations, as discussed above, also affect our international businesses. Political changes, some of which may be disruptive, can interfere with our customers and all of our activities in a particular location. Attempts to mitigate these risks can be costly and are not always successful.
We also outsource certain services to international providers. For example, through arrangements with outsourcing providers in India, we have a substantial team of professionals who provide a variety of services to our insurance operations, including customer service, transaction processing, and functional support including finance, investment research, actuarial, risk and marketing. A significant change in India’s economic liberalization and deregulation policies could adversely affect business and economic conditions in India generally and our business in particular.
The political or regulatory climate in the U.S., Europe or elsewhere could change so that it would not be practical or legal for us to use international operations centers, such as call centers. For example, changes in privacy regulations, or more stringent interpretation or enforcement of these regulations, could require us to curtail our use of low-cost operations in India to service our businesses, which could reduce the cost benefits we currently realize from these operations.
56
Legal and regulatory investigations and actions are increasingly common in the insurance business and may result in financial losses and harm our reputation.
We face a significant risk of litigation and regulatory investigations and actions in the ordinary course of operating our businesses, including the risk of class action lawsuits. Our pending legal and regulatory actions include proceedings specific to us and others generally applicable to business practices in the industries in which we operate. In our insurance operations, we are, have been, or may become subject to class actions and individual suits alleging, among other things, issues relating to sales or underwriting practices, payment of contingent or other sales commissions, claims payments and procedures, product design, product disclosure, administration, additional premium charges for premiums paid on a periodic basis, denial or delay of benefits, charging excessive or impermissible fees on products, recommending unsuitable products to customers, our pricing structures and business practices in our mortgage insurance business, such as captive reinsurance arrangements with lenders and contract underwriting services, violations of RESPA or related state anti-inducement laws and breaching fiduciary or other duties to customers. In our investment-related operations, we are subject to litigation involving commercial disputes with counterparties. We are also subject to litigation arising out of our general business activities such as our contractual and employment relationships. Plaintiffs in class action and other lawsuits against us may seek very large or indeterminate amounts, including punitive and treble damages, which may remain unknown for substantial periods of time. We are also subject to various regulatory inquiries, such as information requests, subpoenas and books and record examinations, from state, federal and international regulators and other authorities. A substantial legal liability or a significant regulatory action against us could have an adverse effect on our business, financial condition and results of operations. Moreover, even if we ultimately prevail in the litigation, regulatory action or investigation, we could suffer significant reputational harm, which could have an adverse effect on our business, financial condition and results of operations.
For further discussion of current investigations and proceedings in which we are involved, see “Item 3—Legal Proceedings.” We cannot assure you that these investigations and proceedings will not have a material adverse effect on our business, financial condition or results of operations. It is also possible that we could become subject to further investigations and have lawsuits filed or enforcement actions initiated against us. In addition, increased regulatory scrutiny and any resulting investigations or proceedings could result in new legal precedents and industry-wide regulations or practices that could adversely affect our business, financial condition and results of operation. For example, the NAIC and certain state insurance departments have adopted or proposed additional reporting and disclosure requirements relating to finite risk reinsurance.
Our computer systems may fail or their security may be compromised, which could damage our business and adversely affect our financial condition and results of operation.
Our business is highly dependent upon the effective operation of our computer systems. We rely on these systems throughout our business for a variety of functions, including processing claims and applications, providing information to customers and distributors, performing actuarial analyses and maintaining financial records. Despite the implementation of security and back-up measures, our computer systems may be vulnerable to physical or electronic intrusions, computer viruses or other attacks, programming errors and similar disruptive problems. The failure of these systems for any reason could cause significant interruptions to our operations, which could result in a material adverse effect on our business, financial condition or results of operation.
We retain confidential information in our computer systems, and we rely on sophisticated commercial technologies to maintain the security of those systems. Anyone who is able to circumvent our security measures and penetrate our computer systems could access, view, misappropriate, alter, or delete any information in the systems, including personally identifiable customer information and proprietary business information. In addition, an increasing number of states and foreign countries require that customers be notified if a security breach results in the disclosure of personally identifiable customer information. Any compromise of the security of our computer systems that results in inappropriate disclosure of personally identifiable customer information could damage our reputation in the marketplace, deter people from purchasing our products, subject us to significant civil and criminal liability and require us to incur significant technical, legal and other expenses.
57
The occurrence of natural or man-made disasters or a disease pandemic could adversely affect our financial condition and results of operation.
We are exposed to various risks arising out of natural disasters, including earthquakes, hurricanes, floods and tornadoes, and man-made disasters, including acts of terrorism and military actions and disease pandemics (such as could arise from the avian flu). For example, a natural or man-made disaster or a disease pandemic could lead to unexpected changes in persistency rates as policyholders and contractholders who are affected by the disaster may be unable to meet their contractual obligations, such as payment of premiums on our insurance policies, deposits into our investment products, and mortgage payments on loans insured by our mortgage insurance policies. They could also significantly increase our mortality and morbidity experience above the assumptions we used in pricing our insurance and investment products. The continued threat of terrorism and ongoing military actions may cause significant volatility in global financial markets, and a natural or man-made disaster or a disease pandemic could trigger an economic downturn in the areas directly or indirectly affected by the disaster. These consequences could, among other things, result in a decline in business and increased claims from those areas, as well as an adverse effect on home prices in those areas, which could result in increased loss experience in our mortgage insurance business. Disasters or a disease pandemic also could disrupt public and private infrastructure, including communications and financial services, which could disrupt our normal business operations.
A natural or man-made disaster or a disease pandemic also could disrupt the operations of our counterparties or result in increased prices for the products and services they provide to us. For example, a natural or man-made disaster or a disease pandemic could lead to increased reinsurance prices and potentially cause us to retain more risk than we otherwise would retain if we were able to obtain reinsurance at lower prices. In addition, a disaster or a disease pandemic could adversely affect the value of the assets in our investment portfolio if it affects companies’ ability to pay principal or interest on their securities. See “—We may face losses if there are significant deviations from our assumptions regarding the future persistency of our insurance policies and annuity contracts” and “—A deterioration in economic conditions or a decline in home price appreciation may adversely affect our loss experience in mortgage insurance.”
Risks Relating to Our Protection and Retirement Income and Investments Segments
We may face losses if morbidity rates, mortality rates or unemployment rates differ significantly from our pricing expectations.
We set prices for our insurance and some annuity products based upon expected claims and payment patterns, using assumptions for, among other things, morbidity rates, or likelihood of sickness, and mortality rates, or likelihood of death, of our policyholders and contractholders. The long-term profitability of these products depends upon how our actual experience compares with our pricing assumptions. For example, if morbidity rates are higher, or mortality rates are lower, than our pricing assumptions, we could be required to make greater payments under long-term care insurance policies and annuity contracts than we had projected. Conversely, if mortality rates are higher than our pricing assumptions, we could be required to make greater payments under our life and payment protection insurance policies and annuity contracts with guaranteed minimum death benefits than we had projected.
The risk that our claims experience may differ significantly from our pricing assumptions is particularly significant for our long-term care insurance products. Long-term care insurance policies provide for long-duration coverage and, therefore, our actual claims experience will emerge over many years after pricing assumptions have been established. Moreover, as a relatively new product in the market, long-term care insurance does not have the extensive claims experience history of life insurance, and as a result, our ability to forecast future claim rates for long-term care insurance is more limited than for life insurance.
In pricing our payment protection insurance, we also use assumptions regarding unemployment levels. If unemployment levels are higher than our pricing assumptions, the claims frequency could be higher for our payment protection insurance business than we had projected.
58
We may be required to accelerate the amortization of deferred acquisition costs and the present value of future profits, which would increase our expenses and reduce profitability.
Deferred acquisition costs (“DAC”) represent costs which vary with and are primarily related to the sale and issuance of our insurance policies and investment contracts that are deferred and amortized over the estimated life of the related insurance policies. These costs include commissions in excess of ultimate renewal commissions, solicitation and printing costs, sales material and some support costs, such as underwriting and contract and policy issuance expenses. Under U.S. GAAP, DAC is subsequently amortized to income, over the lives of the underlying contracts, in relation to the anticipated recognition of premiums or gross profits. In addition, when we acquire a block of insurance policies or investment contracts, we assign a portion of the purchase price to the right to receive future net cash flows from existing insurance and investment contracts and policies. This intangible asset, called the present value of future profits (“PVFP”), represents the actuarially estimated present value of future cash flows from the acquired policies. We amortize the value of this intangible asset in a manner similar to the amortization of DAC.
Our amortization of DAC and PVFP generally depends upon anticipated profits from investments, surrender and other policy and contract charges, mortality, morbidity and maintenance expense margins. Unfavorable experience with regard to expected expenses, investment returns, mortality, morbidity, withdrawals or lapses may cause us to increase the amortization of DAC or PVFP, or both, or to record a charge to increase benefit reserves.
We regularly review DAC and PVFP to determine if they are recoverable from future income. If these costs are not recoverable, they are charged to expenses in the financial period in which we make this determination. For example, if we determine that we are unable to recover DAC from profits over the life of a block of insurance policies or annuity contracts, or if withdrawals or surrender charges associated with early withdrawals do not fully offset the unamortized acquisition costs related to those policies or annuities, we would be required to recognize the additional DAC amortization as a current-period expense. As of December 31, 2006 and 2005, respectively, we had $6.3 billion and $5.6 billion of DAC, and $0.7 billion and $0.7 billion of PVFP. Our net amortization of DAC and PVFP was $0.7 billion, $0.8 billion and $1.1 billion for the years ended December 31, 2006, 2005 and 2004, respectively.
We may be required to recognize impairment in the value of our goodwill, which would increase our expenses and reduce our profitability.
Goodwill represents the excess of the amount we paid to acquire our subsidiaries and other businesses over the fair value of their net assets at the date of the acquisition. Under U.S. GAAP, we test the carrying value of goodwill for impairment at least annually at the “reporting unit” level, which is either an operating segment or a business one level below the operating segment. Goodwill is impaired if the fair value of the reporting unit as a whole is less than the fair value of the identifiable assets and liabilities of the reporting unit, plus the carrying value of goodwill, at the date of the test. For example, goodwill may become impaired if the fair value of a reporting unit as a whole were to decline by an amount greater than the decline in the value of its individual identifiable assets and liabilities. This may occur for various reasons, including changes in actual or expected income or cash flows of a reporting unit, generation of income by a reporting unit at a lower rate of return than similar businesses or declines in market prices for publicly traded businesses similar to our reporting units. If any portion of our goodwill becomes impaired, we would be required to recognize the amount of the impairment as a current-period expense. As of December 31, 2006 and 2005, we had $1.7 billion and $1.4 billion, respectively, of goodwill related to our Protection and Retirement Income and Investments segments.
Our reputation in the long-term care insurance market may be adversely affected if we were to raise premiums on our in-force long-term care insurance products.
While we have not increased premiums on any direct in-force long-term care policies that we have issued, the terms of all our long-term care insurance policies permit us to increase premiums during the premium-paying
59
period. Any premium increase could have an adverse effect on our reputation, our ability to market and sell new long-term care insurance products, our ability to retain existing policyholders, agent attrition, independent channel market share and morbidity trends.
Medical advances, such as genetic research and diagnostic imaging, and related legislation could adversely affect the financial performance of our life insurance, long-term care insurance and annuities businesses.
Genetic research includes procedures focused on identifying key genes that render an individual predisposed to specific diseases, such as particular types of cancer and other diseases. Other medical advances, such as diagnostic imaging technologies, also may be used to detect the early onset of diseases such as cancer and cardiovascular disease. We believe that if individuals learn through medical advances that they are predisposed to particular conditions that may reduce life longevity or require long-term care, they will be more likely to purchase our life and long-term care insurance policies or not to permit existing polices to lapse. In contrast, if individuals learn that they lack the genetic predisposition to develop the conditions that reduce longevity or require long-term care, they will be less likely to purchase our life and long-term care insurance products but more likely to purchase certain annuity products. In addition, such individuals that are existing policyholders will be more likely to permit their policies to lapse.
If we were to gain access to the same genetic or medical information as our prospective policyholders and contractholders, then we would be able to take this information into account in pricing our life and long-term care insurance policies and annuity contracts. However, there are a number of legislative and regulatory actions and proposals that make, or could make, genetic and other medical information confidential and unavailable to insurance companies. Pursuant to these legislative and regulatory actions and proposals, prospective policyholders and contractholders would only disclose this information if they chose to do so voluntarily. These factors could lead us to reduce sales of products affected by these legislative and regulatory actions and proposals and could result in a deterioration of the risk profile of our portfolio, which could lead to payments to our policyholders and contractholders that are higher than we anticipated.
Medical advances also could lead to new forms of preventative care. Preventative care could extend the life and improve the overall health of individuals. If this were to occur, the duration of payments under certain of our annuity products likely would increase, thereby reducing net income in that business.
We may face losses if there are significant deviations from our assumptions regarding the future persistency of our insurance policies and annuity contracts.
The prices and expected future profitability of our insurance and deferred annuity products are based in part upon expected patterns of premiums, expenses and benefits, using a number of assumptions, including those related to persistency, which is the probability that a policy or contract will remain in-force from one period to the next. The effect of persistency on profitability varies for different products. For most of our life insurance, group life and health insurance, and deferred annuity products, actual persistency that is lower than our persistency assumptions could have an adverse impact on profitability, especially in the early years of a policy or contract primarily because we would be required to accelerate the amortization of expenses we deferred in connection with the acquisition of the policy or contract. For our universal life insurance policies, increased persistency that is the result of the sale of policies by the insured to third parties that continue to make premium payments on policies that would otherwise have lapsed, also known as life settlements, could have an adverse impact on profitability because of the higher claims rate associated with settled policies.
For our long-term care insurance and some other health insurance policies, actual persistency in later policy durations that is higher than our persistency assumptions could have a negative impact on profitability. If these policies remain in-force longer than we assumed, then we could be required to make greater benefit payments than we had anticipated when we priced these products. This risk is particularly significant in our long-term care insurance business because we do not have the experience history that we have in many of our other businesses.
60
As a result, our ability to predict persistency for long-term care insurance is more limited than for many other products. Some of our long-term care insurance policies have experienced higher persistency than we had assumed, which has resulted in adverse claims experience.
Because our assumptions regarding persistency experience are inherently uncertain, reserves for future policy benefits and claims may prove to be inadequate if actual persistency experience is different from those assumptions. Although some of our products permit us to increase premiums during the life of the policy or contract, we cannot guarantee that these increases would be sufficient to maintain profitability. Moreover, many of our products do not permit us to increase premiums or limit those increases during the life of the policy or contract. Significant deviations in experience from pricing expectations regarding persistency could have an adverse effect on the profitability of our products.
Regulation XXX may have an adverse effect on our financial condition and results of operations by requiring us to increase our statutory reserves for term life and universal life insurance or incur higher operating costs.
The Model Regulation entitled “Valuation of Life Insurance Policies,” commonly known as “Regulation XXX,” requires insurers to establish additional statutory reserves for term life insurance policies with long-term premium guarantees. In addition, Valuation of Life Insurance Policies Regulation, as clarified by Actuarial Guideline 38 (more commonly known as “Regulation AXXX”) requires insurers to establish additional statutory reserves for certain universal life policies with secondary guarantees. Virtually all our newly issued term and universal life insurance business is now affected by Regulation XXX and AXXX, respectively.
In response to this regulation, we have increased term and universal life insurance statutory reserves and changed our premium rates for term life insurance products. We also have implemented reinsurance and capital management actions to mitigate the capital and tax impact of Regulation XXX and AXXX. However, we cannot assure you that there will not be regulatory, tax or other challenges to the actions we have taken to date. The result of those potential challenges could require us to increase statutory reserves or incur higher operating and/or tax costs. Any change to or repeal of Regulation XXX or AXXX could reduce the competitive advantage of our reinsurance and capital management actions and could adversely affect our market position in the life insurance market.
We also cannot assure you that we will be able to continue to implement actions to mitigate the impact of Regulation XXX or AXXX on future sales of term and universal life insurance products. If we are unable to continue to implement those actions, we may be required to increase statutory reserves, incur higher operating costs than we currently anticipate, or reduce our sales of these products. We also may have to implement measures that may be disruptive to our business. For example, because term and universal life insurance are particularly price-sensitive products, any increase in premiums charged on these products in order to compensate us for the increased statutory reserve requirements or higher costs of reinsurance may result in a significant loss of volume and adversely affect our life insurance operations.
If demand for long-term care insurance continues to decline, we will not be able to execute our strategy to expand our long-term care business.
We have devoted significant resources to developing our long-term care insurance business, and our growth strategy relies partly upon continued growth of the sale of this product. In recent years, industry sales of individual long-term care insurance have declined. Annualized first-year premiums for individual long-term care insurance achieved a historical high in 2002 at approximately $1.0 billion and decreased by 41% to $607.7 million in 2006, according to LIMRA International. We believe this decrease was due primarily to decisions by several providers to cease offering long-term care insurance, to raise premiums on in-force policies and/or to introduce new products with higher prices. These actions resulted in decreased purchases of long-term care insurance products and have caused some distributors to reduce their sales focus on these products. While our
61
individual long-term care sales have grown 11% over the preceding year, our annualized first-year premiums of long-term care insurance from 2004 to 2006 were relatively flat. If the market for long-term care insurance continues to decline, we may be unable to realize our growth strategy in this area and our financial condition and results of operations could be adversely affected.
Risks Relating to Our Mortgage Insurance Segment
Fannie Mae, Freddie Mac and a small number of large mortgage lenders exert significant influence over the U.S. mortgage insurance market.
Our mortgage insurance products protect mortgage lenders and investors from default-related losses on residential first mortgage loans made primarily to home buyers with high loan-to-value mortgages—generally, those home buyers who make down payments of less than 20% of their home’s purchase price. The largest purchasers and guarantors of mortgage loans in the U.S. are Fannie Mae and Freddie Mac, which were created by Congressional charter to ensure that mortgage lenders have sufficient funds to continue to finance home purchases. Fannie Mae and Freddie Mac purchased approximately 28% for the years ended December 31, 2006 and 2005 and 31% for the year ended December 31, 2004 of all the mortgage loans originated in the U.S., according to statistics published by Inside Mortgage Finance. We believe the reduction in the percentage of mortgages purchased by Fannie Mae and Freddie Mac has reduced the market size for flow private mortgage insurance. Fannie Mae’s and Freddie Mac’s charters generally prohibit them from purchasing any mortgage with a face amount that exceeds 80% of the home’s value, unless that mortgage is insured by a qualified insurer or the mortgage seller retains at least a 10% participation in the loan or agrees to repurchase the loan in the event of default. As a result, high loan-to-value mortgages purchased by Fannie Mae or Freddie Mac generally are insured with private mortgage insurance. These provisions in Fannie Mae’s and Freddie Mac’s charters create much of the demand for private mortgage insurance in the U.S. Fannie Mae and Freddie Mac are also subject to regulatory oversight by HUD and OFHEO. As of December 31, 2006, Fannie Mae and Freddie Mac purchased the majority of the flow mortgage loans that we insured. As a result, a change in the charter provisions or other statutes or regulations relating to their purchase or guarantee activity could have an adverse effect on our financial condition and results of operations.
Increasing consolidation among mortgage lenders resulted in significant customer concentration for U.S. mortgage insurers. As a result of this significant concentration, Fannie Mae, Freddie Mac and the largest mortgage lenders possess substantial market power, which enables them to influence our business and the mortgage insurance industry in general. Although we actively monitor and develop our relationships with Fannie Mae, Freddie Mac and our largest mortgage lending customers, a deterioration in any of these relationships, or the loss of business from any of our key customers, could have an adverse effect on our financial condition and results of operations. In addition, if the FHLB’s reduce their purchases of mortgage loans, purchase uninsured mortgage loans or use other credit-enhancement products, this could have an adverse affect on our financial condition and results of operations.
A decrease in the volume of high loan-to-value home mortgage originations or an increase in the volume of mortgage insurance cancellations could result in a decline in our revenue.
We provide mortgage insurance primarily for high loan-to-value mortgages. Factors that could lead to a decrease in the volume of high loan-to-value mortgage originations include:
| • | a change in the level of home mortgage interest rates; |
| • | a decline in economic conditions generally, or in conditions in regional and local economies; |
| • | the level of consumer confidence, which may be adversely affected by economic instability, war or terrorist events; |
| • | declines in the price of homes; |
| • | adverse population trends, including lower homeownership rates; |
62
| • | high rates of home price appreciation, which in times of heavy refinancing affect whether refinanced loans have loan-to-value ratios that require mortgage insurance; and |
| • | changes in government housing policy encouraging loans to first-time homebuyers. |
A decline in the volume of high loan-to-value mortgage originations would reduce the demand for mortgage insurance and, therefore, could have an adverse effect on our financial condition and results of operations.
In addition, a significant percentage of the premiums we earn each year in our U.S. mortgage insurance business are renewal premiums from insurance policies written in previous years. We estimate that approximately 85% of our U.S. gross premiums written in each of the years ended December 31, 2006 and 2005, were renewal premiums. As a result, the length of time insurance remains in-force is an important determinant of our mortgage insurance revenues. Fannie Mae, Freddie Mac and many other mortgage investors in the U.S. generally permit a homeowner to ask his loan servicer to cancel his mortgage insurance when the principal amount of the mortgage falls below 80% of the home’s value. Factors that tend to reduce the length of time our mortgage insurance remains in-force include:
| • | declining interest rates, which may result in the refinancing of the mortgages underlying our insurance policies with new mortgage loans that may not require mortgage insurance or that we do not insure; |
| • | significant appreciation in the value of homes, which causes the size of the mortgage to decrease below 80% of the value of the home and enables the borrower to request cancellation of the mortgage insurance; and |
| • | changes in mortgage insurance cancellation requirements under applicable federal law or mortgage insurance cancellation practices by mortgage lenders and investors. |
Our U.S. policy persistency rates increased from 46% for the year ended December 31, 2003 to 65% and 73% for the years ended December 31, 2005 and 2006, respectively. A decrease in persistency in the U.S. generally would reduce the amount of our insurance in-force and have an adverse effect on our financial condition and results of operations. These factors are less significant in our international mortgage insurance operations because we generally receive a single payment for mortgage insurance at the time a loan closes, and this premium typically is not refundable if the policy is canceled.
The amount of mortgage insurance we write could decline significantly if alternatives to private mortgage insurance are used or lower coverage levels of mortgage insurance are selected.
There are a variety of alternatives to private mortgage insurance that may reduce the amount of mortgage insurance we write. These alternatives include:
| • | origination of mortgages consisting of two simultaneous loans, known as “simultaneous seconds,” comprising a first mortgage with a loan-to-value ratio of 80% and a simultaneous second mortgage for the excess portion of the loan, instead of a single mortgage with a loan-to-value ratio of more than 80%. Over the past several years, the volume of simultaneous second loans as an alternative to loans requiring private mortgage insurance has increased substantially; |
| • | using government mortgage insurance programs, including those of the FHA, the VA and CMHC; |
| • | holding mortgages in the lenders’ own loan portfolios and self insuring; |
| • | using programs, such as those offered by Fannie Mae and Freddie Mac, requiring lower mortgage insurance coverage levels; |
| • | originating and securitizing loans in mortgage backed securities whose underlying mortgages are not insured with private mortgage insurance or which are structured so that the risk of default lies with the investor, rather than a private mortgage insurer; and |
| • | using credit default swaps or similar instruments, instead of private mortgage insurance, to transfer credit risk on mortgages. |
63
A decline in the use of private mortgage insurance in connection with high loan-to-value home mortgages for any reason would reduce the demand for flow mortgage insurance. We believe in recent quarters there has been a reduction in this demand in part as the result of increasing originations of mortgages that do not meet the eligibility requirements of Fannie Mae and Freddie Mac and mortgages that are securitized in mortgage-backed securities that do not use private mortgage insurance. A prolonged decline of this nature could have an adverse effect on our financial condition and results of operations.
Our claims expenses would increase and our results of operations would suffer if the rate of defaults on mortgages covered by our mortgage insurance increases or the severity of such defaults exceeds our expectations.
Our premium rates vary with the perceived risk of a claim on the insured loan, which takes into account factors such as the loan-to-value ratio, our long-term historical loss experience, whether the mortgage provides for fixed payments or variable payments, the term of the mortgage, the borrower’s credit history and the level of documentation and verification of the borrower’s income and assets. Our ability to properly determine eligibility and accurate pricing for the mortgage insurance we issue is dependent upon our underwriting and other operational routines. These routines may vary across the jurisdictions in which we do business. Deficiencies in actual practice in this area could have an adverse impact on our results. We establish renewal premium rates for the life of a mortgage insurance policy upon issuance, and we cannot cancel the policy or adjust the premiums after the policy is issued. As a result, we cannot offset the impact of unanticipated claims with premium increases on policies in-force, and we cannot refuse to renew mortgage insurance coverage. The premiums we agree to charge upon writing a mortgage insurance policy may not adequately compensate us for the risks and costs associated with the coverage we provide for the entire life of that policy.
The long-term profitability of our mortgage insurance business depends upon the accuracy of our pricing assumptions and availability and reliability of underwriting data, which may vary across jurisdictions. If defaults on mortgages increase because of an economic downturn or for reasons we failed to take into account adequately, we would be required to make greater claim payments than we planned when we priced our policies. Future claims on our mortgage insurance policies may not match the assumptions made in our pricing. An increase in the amount or frequency of claims beyond the levels contemplated by our pricing assumptions could have an adverse effect on our financial condition and results of operations. In recent years, our results of operations have benefited from historically low loss ratios because of significant home price appreciation and low levels of defaults. Increases from these recent historic lows could have an adverse effect on our financial condition and results of operations.
As of December 31, 2006, approximately 63% of our U.S. mortgage insurance risk in-force and 61% of our international mortgage insurance risk in-force had not yet reached its anticipated highest claim frequency years, which are generally between the third and seventh year of the loan. As a result, we expect our loss experience on these loans will increase as policies continue to age. If the claim frequency on the risk in-force significantly exceeds the claim frequency that was assumed in setting premium rates, our financial condition, results of operations and cash flows would be adversely affected.
In our U.S. mortgage insurance business, we also provide mortgage insurance for “Alt A” loans, loans with an initial “Interest Only” payment option and other “non-traditional” loans. Alt A loans are originated under programs in which there is a reduced level of verification or disclosure of the borrower’s income or assets. Alt A loans typically have a higher default rate than fully documented loans, and we generally charge higher premiums for mortgage insurance on Alt A loans than on fully documented loans. The Interest Only payment option allows the borrower flexibility to pay interest only or pay interest and as much principal as desired, during an initial period of time. We impose credit score, occupancy type and loan-to-value restrictions on these loans. Although historical information is limited, we believe interest only loans may pose a higher risk of claims due to features such as deferred amortization of the loan. If defaults on Alt A or Interest Only or other “non-traditional” loans
64
are higher than the assumptions we made in pricing our mortgage insurance on those loans, then we would be required to make greater claims payments than we had projected, which could have an adverse effect on our financial condition and results of operations.
A deterioration in economic conditions or a decline in home price appreciation may adversely affect our loss experience in mortgage insurance.
Losses in our mortgage insurance business generally result from events, such as reduction of income, unemployment, divorce, illness and inability to manage credit and interest-rate levels that reduce a borrower’s ability to continue to make mortgage payments. The amount of the loss we suffer, if any, depends in part on whether the home of a borrower who defaults on a mortgage can be sold for an amount that will cover unpaid principal and interest and the expenses of the sale. A deterioration in economic conditions generally increases the likelihood that borrowers will not have sufficient income to pay their mortgages and can also adversely affect housing values, which increases our risk of loss. A decline in home price appreciation, whether or not in conjunction with deteriorating economic conditions, may also increase our risk of loss.
A substantial economic downturn, or decline in recent significant home-price appreciation across the entire U.S. or globally could have a significant adverse effect on our financial condition and results of operations. We also may be particularly affected by economic downturns or declines in recent significant home-price appreciation in states where a large portion of our business is concentrated. As of December 31, 2006, approximately 49% of our U.S. risk in-force was concentrated in 10 states with 9% in Florida, 7% in Texas and 6% in New York. Similarly, our mortgage insurance operations in Canada, Australia and Europe are concentrated primarily in or around the largest cities in those countries. Continued and prolonged adverse economic conditions or declines in recent significant home-price appreciation in these states or cities could result in high levels of claims and losses, which could have an adverse effect on our financial condition and results of operations.
A significant portion of our risk in-force consists of loans with high loan-to-value ratios, which generally result in more and larger claims than loans with lower loan-to-value ratios.
Mortgage loans with higher loan-to-value ratios typically have claim incidence rates substantially higher than mortgage loans with lower loan-to-value ratios. In Canada, Australia, and New Zealand, the risks of having a portfolio with a significant portion of high loan-to-value mortgages are greater than in the U.S. and Europe because we generally agree to cover 100% of the losses associated with mortgage defaults in those markets, compared to percentages in the U.S. and Europe that are typically 12% to 35% of the loan amount.
Although mortgage insurance premiums for higher loan-to-value ratio loans generally are higher than for loans with lower loan-to-value ratios, the difference in premium rates may not be sufficient to compensate us for the enhanced risks associated with mortgage loans bearing higher loan-to-value ratios.
We cede a portion of our U.S. mortgage insurance business to mortgage reinsurance companies affiliated with our mortgage lending customers, and this reduces our profitability.
We, like other mortgage insurers, offer opportunities to our mortgage lending customers that are designed to allow them to participate in the risks and rewards of the mortgage insurance business. Many of the major mortgage lenders with which we do business have established captive mortgage reinsurance subsidiaries. These reinsurance subsidiaries assume a portion of the risks associated with the lender’s insured mortgage loans in exchange for a percentage of the premiums. In most cases, our reinsurance coverage is an “excess of loss” arrangement with a limited band of exposure for the reinsurer. This means that we are required to pay the first layer of losses arising from defaults in the covered mortgages, the reinsurer indemnifies us for the next layer of losses, and we pay any losses in excess of the reinsurer’s obligations. The effect of these arrangements historically has been a reduction in the profitability and return on capital of this business to us. Approximately 58% of our U.S. primary new risk written as of December 31, 2006 was subject to captive mortgage reinsurance, compared to approximately 61% as of December 31, 2005. U.S. premiums ceded to these reinsurers were
65
approximately $136 million, $135 million and $143 million for the years ended December 31, 2006, 2005 and 2004, respectively. These premium cessions have adversely affected our profitability and could further reduce profitability if the terms of these arrangements require greater premium cessions.
We compete with government-owned and government-sponsored entities in our mortgage insurance business, and this may put us at a competitive disadvantage on pricing and other terms and conditions.
Our mortgage insurance business competes with many different government-owned and government-sponsored entities in the U.S., Canada and some European countries. In the U.S., these entities include principally the FHA and, to a lesser degree, the VA, Fannie Mae and Freddie Mac, as well as local and state housing finance agencies. In Canada, we compete with the CMHC, a Crown corporation owned by the Canadian government. In Europe, these entities include public mortgage guarantee facilities in a number of countries.
Those competitors may establish pricing terms and business practices that may be influenced by motives such as advancing social housing policy or stabilizing the mortgage lending industry, which may not be consistent with maximizing return on capital or other profitability measures. In addition, those governmental entities typically do not have the same capital requirements that we and other mortgage insurance companies have and therefore may have financial flexibility in their pricing and capacity that could put us at a competitive disadvantage in some respects. In the event that a government-owned or sponsored entity in one of our markets determines to reduce prices significantly or alter the terms and conditions of its mortgage insurance or other credit enhancement products in furtherance of social or other goals rather than a profit motive, we may be unable to compete in that market effectively, which could have an adverse effect on our financial condition and results of operations.
We compete in Canada with the CMHC, which is owned by the Canadian government and, as a sovereign entity, provides mortgage lenders with 100% capital relief from bank regulatory requirements on loans that it insures. In contrast, lenders receive only 90% capital relief on loans we insure. CMHC also operates the Canadian Mortgage Bond Program, which provides lenders the ability to efficiently guaranty and securitize their mortgage loan portfolios. If we are unable to effectively distinguish ourselves competitively with our Canadian mortgage lender customers, we may be unable to compete effectively with the CMHC as a result of the more favorable capital relief it can provide or the other products and incentives that it offers to lenders.
Changes in regulations that affect the mortgage insurance business could affect our operations significantly and could reduce the demand for mortgage insurance.
In addition to the general regulatory risks that are described above under “—Our insurance businesses are heavily regulated, and changes in regulation may reduce our profitability and limit our growth,” we are also affected by various additional regulations relating particularly to our mortgage insurance operations.
U.S. federal and state regulations affect the scope of our competitors’ operations, which has an effect on the size of the mortgage insurance market and the intensity of the competition in our mortgage insurance business. This competition includes not only other private mortgage insurers, but also U.S. federal and state governmental and quasi-governmental agencies, principally the FHA, and to a lesser degree, the VA, which are governed by federal regulations. Increases in the maximum loan amount that the FHA can insure, and reductions in the mortgage insurance premiums the FHA charges, can reduce the demand for private mortgage insurance. The FHA has also streamlined its down-payment formula and made FHA insurance more competitive with private mortgage insurance in areas with higher home prices. These and other legislative and regulatory changes could cause demand for private mortgage insurance to decrease.
Our U.S. mortgage insurance business, as a credit enhancement provider in the residential mortgage lending industry, also is subject to compliance with various federal and state consumer protection and insurance laws, including the Real Estate Settlement Procedures Act, the Equal Credit Opportunity Act, the Fair Housing Act, the
66
Homeowners Protection Act, the Federal Fair Credit Reporting Act, the Fair Debt Collection Practices Act and others. Among other things, these laws prohibit payments for referrals of settlement service business, require fairness and non-discrimination in granting or facilitating the granting of credit, require cancellation of insurance and refund of unearned premiums under certain circumstances, govern the circumstances under which companies may obtain and use consumer credit information, and define the manner in which companies may pursue collection activities. Changes in these laws or regulations could adversely affect the operations and profitability of our mortgage insurance business. For example, the Department of Housing and Urban Development was considering a rule that would exempt certain mortgages that provide a single price for a package of settlement services from the prohibition in RESPA against payments for referrals of settlement service business. If mortgage insurance were included among the settlement services that, when offered as a package, would be exempt from this prohibition, then mortgage lenders would have greater leverage in obtaining business concessions from mortgage insurers.
In May 2002, the Office of Thrift Supervision amended its capital regulations to remove the 80% loan-to-value standard from the definition of “qualifying mortgage loan”, instead incorporating the federal Interagency Guidelines for Real Estate lending, which do not contain an explicit loan-to-value standard but provide that an institution should require credit enhancement for a loan with a loan-to-value equal to or exceeding 90%. The capital regulations assign a lower risk weight to qualifying mortgage loans than to non-qualifying loans. As a result, these amended regulations no longer penalize OTS-regulated institutions for retaining loans that have loan-to-value ratios between 80% and 90% without credit enhancements. Other regulators, including the U.S. Federal Deposit Insurance Corporation, also do not explicitly refer to a loan-to-value standard but do refer to the Interagency Guidelines.
Regulations in Canada require the use of mortgage insurance for all mortgage loans extended by banks, trust companies and insurers with loan-to-value ratios greater than 75%. In November 2006, as a result of a periodic review of the federal financial services regulatory framework, the Canadian government introduced a bill on setting out a wide variety of changes to the regulations of financial services, including increasing the statutory requirement for mortgage insurance on all loans with loan-to-value ratios from 75% LTV to greater than 80% LTV. This may result in a reduction in the amount of business we write in future years in Canada.
The Canadian Department of Finance has informed us that they intend to review the guarantee agreement with the Canadian government and target completion of this by the end of 2007. Although we believe the Canadian government will preserve the guarantee and maintain competition in the Canadian mortgage industry, we cannot be sure what, if any, changes will be made to the terms of the guarantee. The failure of the Canadian government to maintain the guarantee on terms similar to the current guarantee could have an adverse effect on our ability to offer mortgage insurance products in Canada and could adversely affect our financial condition and results of operations.
APRA regulates all financial institutions in Australia, including general, life and mortgage insurance companies. APRA also determines the minimum regulatory capital requirements for depository institutions. APRA’s current regulations provide for reduced capital requirements for depository institutions that insure residential mortgages with loan-to-value ratios above 80% (in the case of “standard” loans) and, from October 1, 2004, with loan-to-value ratios above 60% (in the case of “non-standard” type loans). APRA’s regulations currently require APRA-regulated lenders to determine the criteria for determining if a loan is a “non-standard” type loan within certain parameters determined by APRA.
Under proposed rules released by APRA during 2005 in connection with the Basel II framework, certain approved deposit-taking institutions (“ADIs”) in Australia would be required to hold less capital on high loan-to-value mortgage loans and would also receive a capital incentive for using mortgage insurance, but at a reduced level when compared to current regulations in Australia. APRA has also proposed that ADIs would need to acquire mortgage insurance coverage levels lower than existing requirements in order to obtain these reduced capital incentives. We continue to work with APRA on this proposed rulemaking, which is expected to become
67
effective January 1, 2008. If the final rules retain these provisions, lenders in Australia may be able to reduce their use of mortgage insurance for high loan-to-value ratio mortgages, which may have an adverse affect on our Australian business.
We believe the revisions to a set of regulatory rules and procedures governing global bank capital standards that were introduced by the Basel Committee of the Bank for International Settlements, known as Basel II, may encourage growth of international mortgage insurance. Basel II has been designed to reward banks that have developed effective risk management systems by allowing them to hold less capital than banks with less effective systems. Basel II was finalized and issued in June 2004; however, its adoption by individual countries internationally and in the U.S. is ongoing. Therefore, we cannot predict the benefits that ultimately will be provided to lenders, or how any such benefits may affect the opportunities for the growth of mortgage insurance. If countries implement Basel II in a manner that does not reward lenders for using mortgage insurance as a credit risk mitigant on high loan-to-value mortgage loans, or if lenders conclude that mortgage insurance does not provide sufficient capital incentives, then we may have to revise our product offerings to meet the new requirements and our results of operations may be adversely affected.
Our U.S. mortgage insurance business could be adversely affected by legal actions under RESPA.
RESPA prohibits paying lenders for the referral of settlement services, including mortgage insurance. This precludes us from providing services to mortgage lenders free of charge, charging fees for services that are lower than their reasonable or fair market value, and paying fees for services that others provide that are higher than their reasonable or fair market value. In addition, RESPA prohibits persons from giving or accepting any portion or percentage of a charge for a real estate settlement service, other than for services actually performed. A number of lawsuits, including some that were class actions, have challenged the actions of private mortgage insurers, including our company, under RESPA, alleging that the insurers have provided or received products or services at improperly set prices in return for the referral of mortgage insurance. We and several other mortgage insurers, without admitting any wrongdoing, reached a settlement in these cases. We cannot predict whether plaintiffs will institute new litigation against private mortgage insurers, including us, seeking damages or under relief under RESPA. In addition, U.S. federal and state officials are authorized to enforce RESPA and to seek civil and criminal penalties, and we cannot predict whether these proceedings might be brought against us or other mortgage insurers. Any such proceedings could have an adverse effect on our financial condition and results of operations.
Potential liabilities in connection with our U.S. contract underwriting services could have an adverse effect on our financial condition and results of operations.
We offer contract underwriting services to many of our mortgage lenders in the U.S., pursuant to which our employees and contractors work directly with the lender to determine whether the data relating to a borrower and a proposed loan contained in a mortgage loan application file complies with the lender’s loan underwriting guidelines or the investor’s loan purchase requirements. In connection with that service, we also compile the application data and submit it to the automated underwriting systems of Fannie Mae and Freddie Mac, which independently analyze the data to determine if the proposed loan complies with their investor requirements.
Under the terms of our contract underwriting agreements, we agree to indemnify the lender against losses incurred in the event that we make material errors in determining whether loans processed by our contract underwriters meet specified underwriting or purchase criteria, subject to contractual limitations on liability. As a result, we assume credit and interest rate risk in connection with our contract underwriting services. Worsening economic conditions, a deterioration in the quality of our underwriting services or other factors could cause our contract underwriting liabilities to increase and have an adverse effect on our financial condition and results of operations. Although we have established reserves to provide for potential claims in connection with our contract underwriting services, we have limited historical experience that we can use to establish reserves for these potential liabilities, and these reserves may not be adequate to cover liabilities that may arise.
68
If the European and other mortgage insurance markets do not grow as we expect, we will not be able to execute our strategy to expand our business into these markets.
We have devoted resources to marketing our mortgage insurance products in Europe and other parts of the world, and we plan to continue these efforts. Our growth strategy depends partly upon the development of favorable legislative and regulatory policies throughout Europe that support increased homeownership and provide capital relief for institutions that insure their mortgage loan portfolios with private mortgage insurance. In furtherance of these policies, we have collaborated with government agencies to develop bank regulatory capital requirements that provide incentives to lenders to implement risk transfer strategies such as mortgage insurance, as well as governmental policies that encourage homeownership as a wealth accumulation strategy for borrowers with limited resources to make large down payments. We have invested, and we will continue to invest, significant resources to advocate such a regulatory environment at the national and regional levels. However, if legislative and regulatory agencies fail to adopt these policies, then these markets for high loan-to-value lending and mortgage insurance may not expand as we currently anticipate, and our growth strategy in those markets may not be successful.
Other Risks
We have agreed to make payments to GE based on the projected amounts of certain tax savings we expect to realize as a result of the IPO. We will remain obligated to make these payments even if we do not realize the related tax savings and the payments could be accelerated in the event of certain changes in control.
We entered into a tax matters agreement with GE in connection with the IPO. We refer to this agreement as the Tax Matters Agreement. Under the Tax Matters Agreement, we have an obligation to pay GE a fixed amount over approximately the next 16 years. This fixed obligation, the estimated present values of which were $380 million and $379 million as of December 31, 2006 and 2005, respectively, equals 80% (subject to a cumulative $640 million maximum amount) of the tax savings projected as a result of the IPO. Even if we fail to generate sufficient taxable income to realize the projected tax savings, we will remain obligated to pay GE, and this could have a material adverse effect on our financial condition and results of operation. We could also, subject to regulatory approval, be required to pay GE on an accelerated basis in the event of certain changes in control of our company. In connection with the sale of our group life and health insurance business previously mentioned, we are required to pay GE approximately $30 million pursuant to the Tax Matters Agreement at or prior to the closing of the sale. This payout represents accelerated tax benefits.
Provisions of our certificate of incorporation and by-laws and our Tax Matters Agreement with GE may discourage takeover attempts and business combinations that stockholders might consider in their best interests.
Our certificate of incorporation and by-laws include provisions that may have anti-takeover effects and may delay, deter or prevent a takeover attempt that our stockholders might consider in their best interests. For example, our certificate of incorporation and by-laws:
| • | permit our board of directors to issue one or more series of preferred stock; |
| • | limit the ability of stockholders to remove directors; |
| • | limit the ability of stockholders to fill vacancies on our board of directors; |
| • | limit the ability of stockholders to call special meetings of stockholders and take action by written consent; and |
| • | impose advance notice requirements for stockholder proposals and nominations of directors to be considered at stockholder meetings. |
Under our Tax Matters Agreement with GE, if any person or group of persons other than GE or its affiliates gains the power to direct the management and policies of our company, we could become obligated immediately
69
to pay to GE the total present value of all remaining tax benefit payments due to GE over the full term of the agreement. The estimated present value of our fixed obligation as of December 31, 2006 was $380 million. Similarly, if any person or group of persons other than us or our affiliates gains effective control of one of our subsidiaries, we could become obligated to pay to GE the total present value of all such payments due to GE allocable to that subsidiary, unless the subsidiary assumes the obligation to pay these future amounts under the Tax Matters Agreement and certain conditions are met. The acceleration of payments would be subject to the approval of certain state insurance regulators, and we are obligated to use our reasonable best efforts to seek these approvals. This feature of the agreement could adversely affect a potential merger or sale of our company. It could also limit our flexibility to dispose of one or more of our subsidiaries, with adverse implications for any business strategy dependent on such dispositions.
| Item 1B. | Unresolved Staff Comments |
We have no unresolved comments from the staff of the SEC.
| Item 2. | Properties |
We own our headquarters facility in Richmond, Virginia, which consists of approximately 461,000 square feet in four buildings, as well as several facilities in Lynchburg, Virginia with approximately 462,000 square feet. In addition, we lease approximately 743,000 square feet of office space in 66 locations throughout the U.S. We also own two buildings outside the U.S. with approximately 40,000 square feet, and we lease approximately 419,000 square feet in 72 locations outside the U.S.
Most of our leases in the U.S. and other countries have lease terms of three to five years, although some leases have terms of up to 17 years. Our aggregate annual rental expense under all these leases was $29 million during the year ended December 31, 2006.
We believe our properties are adequate for our business as presently conducted.
70
| Item 3. | Legal Proceedings |
We face a significant risk of litigation and regulatory investigations and actions in the ordinary course of operating our businesses, including the risk of class action lawsuits. Our pending legal and regulatory actions include proceedings specific to us and others generally applicable to business practices in the industries in which we operate. In our insurance operations, we are, have been, or may become subject to class actions and individual suits alleging, among other things, issues relating to sales or underwriting practices, payment of contingent or other sales commissions, bidding practices in connection with our management and administration of a third-party’s municipal guaranteed investment contract business, claims payments and procedures, product design, product disclosure, administration, additional premium charges for premiums paid on a periodic basis, denial or delay of benefits, charging excessive or impermissible fees on products, recommending unsuitable products to customers, our pricing structures and business practices in our mortgage insurance business, such as capital reinsurance arrangements with lenders and contract underwriting services, violations of RESPA or related state anti-inducement laws, and breaching fiduciary or other duties to customers. Plaintiffs in class action and other lawsuits against us may seek very large or indeterminate amounts, including punitive and treble damages, which may remain unknown for substantial periods of time. In our investment-related operations, we are subject to litigation involving commercial disputes with counterparties. We are also subject to litigation arising out of our general business activities such as our contractual and employment relationships. We are also subject to various regulatory inquiries, such as information requests, subpoenas and books and record examinations, from state, federal and international regulators and other authorities. A substantial legal liability or a significant regulatory action against us could have an adverse effect on our business, financial condition and results of operations. Moreover, even if we ultimately prevail in the litigation, regulatory action or investigation, we could suffer significant reputational harm, which could have an adverse effect on our business, financial condition and results of operations.
Recently, the insurance industry has become the focus of increased scrutiny by regulatory and law enforcement authorities concerning certain practices within the insurance industry. In this regard, in May 2005, we received a subpoena from the Northeast Regional Office of the SEC, requiring the production of documents related to “certain loss mitigation insurance products,” such as finite risk reinsurance. We responded to the SEC’s subpoena in June and July 2005, and will cooperate with respect to any follow-up requests or inquiries. Additionally, in May and June 2005, certain of our subsidiaries received information requests from the State of Delaware Department of Insurance and the State of Connecticut Insurance Department on the same general subject, to which we responded. We will cooperate with respect to any follow-up requests or inquiries. In June 2005, GE received a subpoena from the United States Attorney’s Office for the Southern District of New York, also on the same general subject. In the subpoena, GE is defined as including, among other things, its subsidiaries and affiliates. We cooperated with GE in connection with GE’s response to the subpoena, and will cooperate with respect to any follow-up requests or inquiries. In May 2005, each of our U.S. mortgage insurance subsidiaries received an information request from the State of New York Insurance Department with respect to captive reinsurance transactions with lender-affiliated reinsurers and other types of arrangements in which lending institutions receive from our subsidiary any form of payment, compensation or other consideration in connection with issuance of a policy covering a mortgagor of the lending institution. In February 2006, we received a follow-up industry-wide inquiry from New York requesting supplemental information. In addition, in January 2006 as part of an industry-wide review, our U.S. mortgage insurance subsidiary received an administrative subpoena from the Minnesota Department of Commerce, which has jurisdiction over insurance matters, with respect to our reinsurance arrangements, including captive reinsurance transactions. We have responded to these industry-wide regulatory inquiries and follow-up inquiries, and will cooperate with respect to any follow-up requests or inquiries.
In November 2006, one of our subsidiaries received a grand jury subpoena from the United States Department of Justice, Antitrust Division, and a subpoena from the SEC, each requiring the production of documents and information related to an investigation into alleged bid-rigging involving the sale of GICs to municipalities. We have not issued and do not currently issue GICs to municipalities, but from January 2004 to
71
December 2006, our subsidiary provided management and administrative services to a third-party that does issue GICs to municipalities. We plan to cooperate fully with respect to these investigations and responding to the subpoenas.
Antitrust authorities in the U.K. conducted an investigation of the store card sector of the retail financial services market in the U.K. to ascertain whether there are any characteristics that restrict or distort competition in this market. As part of the investigation, the authorities also examined various insurance products sold to store cardholders. These products include payment protection insurance, purchase protection and price protection. Our U.K. payment protection insurance business currently underwrites these products that are sold by one of the largest providers of store cards in the U.K. As part of that investigation, we responded to an information request. The provisional findings of the U.K. antitrust authorities were published in September 2005. In March 2006, the U.K. antitrust authorities published their final report confirming their provisional findings that there are features in the store card sector that have had an adverse effect on competition. The report contains remedies (aimed at mitigating these adverse effects on competition) relating to the various insurance products sold to store cardholders, including a requirement that the store card sector of the retail financial services market in the U.K. offer payment protection insurance separately from other elements of store card insurance. The report requires these remedies to be implemented by March 2007. We cannot predict the effect that this final report, including the remedies, may have on the store card sector in the U.K. and the sale of insurance products linked to store cards, the wider payment protection insurance sector in the U.K. or our payment protection business in the U.K.
The U.K. antitrust authorities have also conducted a review of the payment protection insurance sector. The review was initiated in response to a complaint lodged under U.K. anti-trust law by a consumer activist group (the Citizens Advice Bureau). In October 2006, the antitrust authorities published their provisional findings, which concluded that there are features of the payment protection insurance market, which may be adversely affecting competition. In February 2007, the antitrust authorities announced that a further and more thorough investigation of the payment protection insurance market is being undertaken. Further to that investigation, we have received an information request from the antitrust authorities. We are responding to this industry-wide information request, and we will cooperate with the respect to any follow-up requests or inquiries.
Also in the U.K., the FSA has conducted an industry-wide review of payment protection insurance products in 2005 and issued a report that was critical of some of the sales methods used by distributors of payment protection insurance products. Our U.K. payment protection insurance business only acts as an underwriter of payment protection insurance products. The FSA in 2006 completed a further review of payment protection insurance products. Although the FSA concluded that there have been improvements since 2005, the FSA identified a number of areas of concern, in particular relating to sales practices. During 2007, the FSA intends to examine whether additional regulation of payment protection insurance products is required.
We cannot predict the effect these investigations may have on the wider payment protection insurance sector in the U.K or our payment protection business in the U.K.
We cannot ensure that the current investigations and proceedings will not have a material adverse effect on our business, financial condition or results of operations. In addition, it is possible that related investigations and proceedings may be commenced in the future, and we could become subject to further investigations and have lawsuits filed against us. In addition, increased regulatory scrutiny and any resulting investigations or proceedings could result in new legal precedents and industry-wide regulations or practices that could adversely affect our business, financial condition and results of operation.
One of our insurance subsidiaries was named as a defendant in a lawsuit, Wilma Juanita Kern, et al. v. General Electric Capital Assurance Company, filed on February 16, 2005 in the Circuit Court for the Third Judicial Circuit in Madison County, Illinois. The plaintiffs sought to proceed on the basis of a class action, brought on behalf of Illinois purchasers of long-term care insurance. Plaintiffs alleged the improper refusal to provide long-term care benefits to long-term care insureds who were cared for in unlicensed facilities in Illinois,
72
and the improper sale of policies requiring insureds to reside in licensed assisted care facilities during a time period when no licensed facilities, or too few licensed facilities were available in Illinois. Plaintiffs sought unspecified damages for breach of contract, violation of the Illinois Consumer Fraud Act and unjust enrichment. On January 10, 2007, the Court approved the settlement agreement reached by the parties and dismissed the case with prejudice.
| Item 4. | Submission of Matters to a Vote of Security Holders |
None.
73
| Item 5. | Market for Registrant’s Common Equity, Related Stockholder Matters and Issuer Purchases of Equity Securities |
Market for Common Stock
Our Class A Common Stock is listed on The New York Stock Exchange under the symbol “GNW.” The following table sets forth the high and low intra-day sales prices per share of our Class A Common Stock, as reported by The New York Stock Exchange, for the periods indicated.
| High | Low | |||||
| 2006 |
||||||
| First Quarter |
$ | 35.37 | $ | 31.53 | ||
| Second Quarter |
$ | 35.22 | $ | 31.37 | ||
| Third Quarter |
$ | 36.27 | $ | 33.06 | ||
| Fourth Quarter |
$ | 36.47 | $ | 32.18 | ||
| High | Low | |||||
| 2005 |
||||||
| First Quarter |
$ | 29.80 | $ | 25.72 | ||
| Second Quarter |
$ | 31.00 | $ | 26.80 | ||
| Third Quarter |
$ | 33.50 | $ | 29.26 | ||
| Fourth Quarter |
$ | 35.25 | $ | 29.73 | ||
As of February 15, 2007, we had 133 holders of record of our Class A Common Stock.
74
Common Stock Performance Graph
The following performance graph and related information shall not be deemed “soliciting material” or to be “filed” with the SEC, nor shall such information be incorporated by reference into any future filings under the Securities Act of 1933 or the Securities Exchange Act of 1934, each as amended, except to the extent we specifically incorporate it by reference into such filing.
The following graph compares the cumulative stockholder return on our Class A Common Stock with the cumulative total return on the Standard & Poor’s 500 Stock Index and the Standard & Poor’s 500 Insurance Index. The graph assumes that $100 was invested on May 25, 2004 (the date on which public trading in our Class A Common Stock commenced) in our Class A Common Stock and each of the indices described, and that all dividends were reinvested.
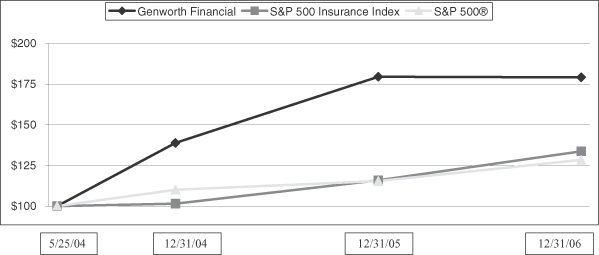
| May 25, 2004 | December 31, 2004 | December 31, 2005 | December 31, 2006 | |||||||||
| Genworth Financial |
$ | 100.00 | $ | 138.83 | $ | 179.47 | $ | 179.17 | ||||
| S&P 500 Insurance Index |
$ | 100.00 | $ | 101.52 | $ | 115.84 | $ | 133.69 | ||||
| S&P 500® |
$ | 100.00 | $ | 110.05 | $ | 115.46 | $ | 128.47 | ||||
Dividends
In the first and second quarters of 2006, we declared common stock dividends of $0.075 per share, or $34 million and $35 million, respectively, which were paid in the second and third quarters of 2006, respectively. During the third quarter of 2006, we raised the quarterly dividend by 20% to $0.09 per share and declared dividends on our common stock of $40 million, which was paid during the fourth quarter of 2006. In the fourth quarter, we declared common stock dividends of $0.09 per share, or $40 million, which was paid in January 2007. The declaration and payment of future dividends to holders of our common stock will be at the discretion of our board of directors and will depend on many factors including our receipt of dividends from our insurance and other operating subsidiaries, financial condition, net income, capital requirements of our subsidiaries, legal requirements, regulatory constraints and other factors as the board of directors deems relevant.
In the first and second quarter of 2005, we declared quarterly dividends of $0.065 per share of common stock of our Class A and Class B Common Stock, or $61 million in the aggregate, which were paid in the second and third quarters of 2005, respectively. In the third and fourth quarters of 2005, we declared quarterly dividends of $0.075 per share of common stock, or $71 million in the aggregate, which were paid in the fourth quarter of 2005 and first quarter of 2006, respectively. The third quarter dividend represented an increase of 15% per share from our previous quarterly dividends.
75
Our Series A Preferred Stock bears dividends at an annual rate of 5.25% of the liquidation value of $50 per share. We also pay quarterly contract adjustment payments with respect to our Equity Units at an annual rate of 2.16% of the stated amount of $25 per Equity Unit.
We are a holding company and have no direct operations. As a result, our ability to pay dividends in the future will depend on receiving dividends from our subsidiaries. Our insurance subsidiaries are subject to the laws of the jurisdictions in which they are domiciled and licensed and consequently are limited in the amount of dividends that they can pay. See “Item 1—Business—Regulation.”
Issuer Purchases of Equity Securities
| (Dollar amounts in millions, except per share amounts) |
Total number of shares purchased |
Average price paid per share |
Total number of shares purchased as part of publicly announced plans or programs |
Approximate dollar value of shares that may yet be purchased under the plans or programs(1) | ||||||
| October 1, 2006 through |
360,000 | $ | 33.56 | 360,000 | $ | 313 | ||||
| November 1, 2006 through November 30, 2006 |
9,756,875 | $ | 32.06 | 9,756,875 | — | |||||
| December 1, 2006 through December 31, 2006 |
— | $ | — | — | — | |||||
| Total |
10,116,875 | $ | 32.11 | 10,116,875 | $ | — | ||||
| (1) | On December 21, 2005, our Board of Directors approved a stock repurchase program, authorizing Genworth to repurchase up to $750 million of our common stock over the succeeding 18 months. Additionally, on October 26, 2006, our Board of Directors increased the size of the stock repurchase program by $250 million to $1.0 billion. On November 8, 2006, we completed our planned repurchases under this program. Additionally on December 8, 2006, our Board of Directors approved another stock repurchase program, authorizing the repurchase of up to $500 million of our common stock over the 12-month period commencing January 1, 2007. |
| Item 6. | Selected Financial Data |
The following table sets forth selected financial information. The selected financial information as of December 31, 2006 and 2005 and for the years ended December 31, 2006, 2005 and 2004 has been derived from our consolidated financial statements, which have been audited by KPMG LLP and are included elsewhere in this Annual Report on Form 10-K. You should read this information in conjunction with the information under “Item 7—Management’s Discussion and Analysis of Financial Condition and Results of Operations,” our consolidated financial statements, the related notes and the accompanying independent registered public accounting firm’s report (which refers to changes in accounting for share-based payments and pension and other postretirement plan obligations in 2006 and for certain nontraditional long-duration contracts and for separate accounts in 2004), which are included elsewhere in this Annual Report. The selected financial information as of December 31, 2003 and 2002 and for the years ended December 31, 2003 and 2002 has been derived from our consolidated financial statements, which have been audited by KPMG LLP, but are not included in this Annual Report on Form 10-K.
The financial information in this Annual Report on Form 10-K has been derived from our financial statements, which have been prepared as if Genworth had been in existence throughout all periods. Our consolidated financial statements include, for all periods, the insurance businesses that we acquired from GE subsidiaries in connection with our corporate formation on May 24, 2004. Until the corporate formation, our financial statements also included the businesses that were owned by GEFAHI but not transferred to us in connection with our corporate formation.
76
| Years ended December 31, | ||||||||||||||||||||
| (Amounts in millions, except per share amounts) |
2006 | 2005 | 2004 | 2003(1) | 2002 | |||||||||||||||
| Consolidated Statements of Income Information |
||||||||||||||||||||
| Revenues: |
||||||||||||||||||||
| Premiums |
$ | 6,487 | $ | 6,297 | $ | 6,559 | $ | 6,707 | $ | 6,107 | ||||||||||
| Net investment income |
3,837 | 3,536 | 3,648 | 4,051 | 3,979 | |||||||||||||||
| Net investment gains (losses) |
(69 | ) | (2 | ) | 26 | 10 | 204 | |||||||||||||
| Policy fees and other income |
774 | 673 | 824 | 915 | 939 | |||||||||||||||
| Total revenues |
11,029 | 10,504 | 11,057 | 11,683 | 11,229 | |||||||||||||||
| Benefits and expenses: |
||||||||||||||||||||
| Benefits and operating expense |
8,747 | 8,413 | 9,202 | 10,161 | 9,314 | |||||||||||||||
| Interest expense |
364 | 293 | 217 | 140 | 124 | |||||||||||||||
| Total benefits and expenses |
9,111 | 8,706 | 9,419 | 10,301 | 9,438 | |||||||||||||||
| Income from continuing operations before income taxes |
1,918 | 1,798 | 1,638 | 1,382 | 1,791 | |||||||||||||||
| Provision for income taxes |
594 | 577 | 493 | 413 | 411 | |||||||||||||||
| Income from continuing operations |
$ | 1,324 | $ | 1,221 | $ | 1,145 | $ | 969 | $ | 1,380 | ||||||||||
| Net earnings from continuing operations per common share(2): |
||||||||||||||||||||
| Basic |
$ | 2.90 | $ | 2.57 | $ | 2.34 | $ | 1.98 | $ | 2.82 | ||||||||||
| Diluted |
$ | 2.82 | $ | 2.52 | $ | 2.33 | $ | 1.98 | $ | 2.82 | ||||||||||
| Shares outstanding(2): |
||||||||||||||||||||
| Basic |
455.9 | 475.3 | 489.5 | 489.5 | 489.5 | |||||||||||||||
| Diluted |
469.4 | 484.6 | 490.5 | 489.5 | 489.5 | |||||||||||||||
| Cash dividends declared per common share(3) |
$ | 0.33 | $ | 0.28 | $ | 0.13 | ||||||||||||||
| Selected Segment Information |
||||||||||||||||||||
| Total revenues: |
||||||||||||||||||||
| Protection |
$ | 6,460 | $ | 6,179 | $ | 6,117 | $ | 6,193 | $ | 5,651 | ||||||||||
| Retirement Income and Investments |
2,932 | 2,912 | 3,361 | 3,803 | 3,756 | |||||||||||||||
| Mortgage Insurance |
1,511 | 1,214 | 1,090 | 982 | 946 | |||||||||||||||
| Affinity(4) |
— | — | 218 | 566 | 588 | |||||||||||||||
| Corporate and Other |
126 | 199 | 271 | 139 | 288 | |||||||||||||||
| Total |
$ | 11,029 | $ | 10,504 | $ | 11,057 | $ | 11,683 | $ | 11,229 | ||||||||||
| Income (loss) from continuing operations: |
||||||||||||||||||||
| Protection |
$ | 618 | $ | 568 | $ | 530 | $ | 489 | $ | 551 | ||||||||||
| Retirement Income and Investments |
203 | 247 | 153 | 151 | 186 | |||||||||||||||
| Mortgage Insurance |
618 | 507 | 426 | 369 | 451 | |||||||||||||||
| Affinity(4) |
— | — | (14 | ) | 16 | (3 | ) | |||||||||||||
| Corporate and Other |
(115 | ) | (101 | ) | 50 | (56 | ) | 195 | ||||||||||||
| Total |
$ | 1,324 | $ | 1,221 | $ | 1,145 | $ | 969 | $ | 1,380 | ||||||||||
77
| December 31, | |||||||||||||||
| (Amounts in millions) |
2006 | 2005 | 2004 | 2003(1) | 2002 | ||||||||||
| Consolidated Balance Sheet Information |
|||||||||||||||
| Total investments |
$ | 69,476 | $ | 66,910 | $ | 65,176 | $ | 78,693 | $ | 72,080 | |||||
| All other assets(5) |
41,395 | 38,744 | 38,702 | 24,738 | 45,277 | ||||||||||
| Total assets |
$ | 110,871 | $ | 105,654 | $ | 103,878 | $ | 103,431 | $ | 117,357 | |||||
| Policyholder liabilities |
$ | 72,350 | $ | 71,267 | $ | 69,262 | $ | 66,545 | $ | 63,195 | |||||
| Non-recourse funding obligations |
2,765 | 1,400 | 900 | 600 | — | ||||||||||
| Short-term borrowings |
199 | 152 | 559 | 2,239 | 1,850 | ||||||||||
| Long-term borrowings |
3,321 | 2,736 | 2,442 | 529 | 472 | ||||||||||
| All other liabilities |
18,906 | 16,789 | 17,849 | 17,718 | 35,088 | ||||||||||
| Total liabilities |
$ | 97,541 | $ | 92,344 | $ | 91,012 | $ | 87,631 | $ | 100,605 | |||||
| Accumulated other comprehensive income |
$ | 1,157 | $ | 1,404 | $ | 1,608 | $ | 1,672 | $ | 835 | |||||
| Total stockholders’ equity |
$ | 13,330 | $ | 13,310 | $ | 12,866 | $ | 15,800 | $ | 16,752 | |||||
| U.S. Statutory Financial Information(6) |
|||||||||||||||
| Statutory capital and surplus(7) |
$ | 7,234 | $ | 6,672 | $ | 6,439 | $ | 7,021 | $ | 7,207 | |||||
| Asset valuation reserve |
$ | 439 | $ | 416 | $ | 427 | $ | 413 | $ | 390 | |||||
| (1) | On August 29, 2003, we sold our Japanese life insurance and domestic auto and homeowners’ insurance businesses for aggregate cash proceeds of approximately $2.1 billion, consisting of $1.6 billion paid to us and $0.5 billion paid to other GE affiliates, plus pre-closing dividends. Refer to note 4 in our consolidated financial statements under “Item 8—Financial Statements and Supplementary Data.” |
| (2) | Basic and diluted net earnings from continuing operations per common share are calculated by dividing net income from continuing operations for the year ended December 31, 2006 and 2005 by 455.9 million and 475.3 million weighted average basic shares outstanding, respectively, and by 469.4 million and 484.6 million weighted average diluted shares outstanding, respectively. Weighted average shares outstanding for the year ended December 31, 2004 are determined as if our reorganization had occurred at the beginning of the year. Basic and diluted net earnings from continuing operations per common share are calculated by dividing net income from continuing operations by 489.5 million shares outstanding for the years ended December 31, 2003 and 2002. The number of shares used in our calculation of diluted net earnings per common share in 2004, 2005 and 2006 is affected by the additional shares of Class A Common Stock issuable under Equity Units, stock options and restricted stock units and is calculated using the treasury method. |
| (3) | Following the completion of the IPO, we declared quarterly dividends of $0.065 per common share in the third and fourth quarters of 2004 and first and second quarters of 2005. We declared quarterly dividends of $0.075 per common share in the third and fourth quarters of 2005 and first and second quarter of 2006. During the third quarter of 2006, we increased the quarterly dividend 20% and declared dividends of $0.09 per common share in the third and fourth quarters of 2006. |
| (4) | Reflects the results of businesses that were owned by GEFAHI but were not transferred to us in connection with our corporate formation, including (a) the Partnership Marketing Group business, (b) an institutional asset management business, and (c) several other small businesses that were not part of our core ongoing business. See “Item 7—Management’s Discussion and Analysis of Financial Condition and Results of Operations—Overview—Our financial information.” |
| (5) | Prior to the completion of the IPO, we entered into several significant reinsurance transactions with UFLIC, an indirect, wholly-owned subsidiary of GE, in which we ceded certain blocks of structured settlement annuities, variable annuities and long-term care insurance. As a result of these transactions, we transferred investment securities to UFLIC and recorded a reinsurance recoverable that is included in “all other assets.” For a discussion of this transaction, refer to note 9 in our consolidated financial statements under “Item 8—Financial Statements and Supplementary Data.” |
78
| (6) | We derived the U.S. Statutory Information from Annual Statements of our U.S. insurance company subsidiaries that were filed with the insurance departments in states where we are domiciled and are prepared in accordance with statutory accounting practices prescribed or permitted by the insurance departments in states where we are domiciled. These statutory accounting practices vary in certain material respects from U.S. GAAP. |
| (7) | Combined statutory capital and surplus for our U.S. domiciled insurance subsidiaries includes surplus notes issued by our U.S. life subsidiaries and statutorily required contingency reserves held by our U.S. mortgage insurance subsidiaries. |
Reconciliation of net income to net operating income
Net operating income for the years ended December 31, 2006, 2005 and 2004 were $1,358 million, $1,222 million and $1,058 million, respectively. We define net operating income as net income from continuing operations, excluding after-tax net investment gains (losses) (which can fluctuate significantly from period to period) and other adjustments, changes in accounting principles and infrequent or unusual non-operating items. There were no infrequent or unusual non-operating items excluded from net operating income other than a $46 million IPO-related net tax benefit recorded during 2004 and a $25 million after-tax gain related to our waiver of contractual rights under an outsourcing services agreement with a third-party service provider recorded during 2004.
We believe that analysis of net operating income enhances understanding and comparability of performance by highlighting underlying business activity and profitability drivers. However, net operating income should not be viewed as a substitute for U.S. GAAP net income. In addition, our definition of net operating income may differ from the definitions used by other companies. The table below includes a reconciliation of net income from continuing operations to net operating income:
| Years ended December 31, | ||||||||||
| (Amounts in millions) |
2006 | 2005 | 2004 | |||||||
| Net income from continuing operations |
$ | 1,324 | $ | 1,221 | $ | 1,145 | ||||
| Net investment (gains) losses, net of taxes and other adjustments |
34 | 1 | (16 | ) | ||||||
| Net tax benefit related to IPO |
— | — | (46 | ) | ||||||
| Gain on outsourcing service agreements, net of taxes |
— | — | (25 | ) | ||||||
| Net operating income |
$ | 1,358 | $ | 1,222 | $ | 1,058 | ||||
79
| Item 7. | Management’s Discussion and Analysis of Financial Condition and Results of Operations |
The following discussion and analysis of our financial condition and results of operations should be read in conjunction with our audited financial statements and related notes included herein.
Cautionary note regarding forward-looking statements
This Annual Report contains certain “forward-looking statements” within the meaning of the Private Securities Litigation Reform Act of 1995. Forward-looking statements may be identified by words such as “expects,” “intends,” “anticipates,” “plans,” “believes,” “seeks,” “estimates,” “will,” or words of similar meaning and include, but are not limited to, statements regarding the outlook for our future business and financial performance. Forward-looking statements are based on management’s current expectations and assumptions, which are subject to inherent uncertainties, risks and changes in circumstances that are difficult to predict. Actual outcomes and results may differ materially due to global political, economic, business, competitive, market, regulatory and other factors, including the items identified above under “Item 1A—Risk Factors.”
We undertake no obligation to publicly update any forward-looking statement, whether as a result of new information, future developments or otherwise.
Overview
Our business
We are a leading financial security company in the U.S., with an expanding international presence. We have three operating segments: Protection, Retirement Income and Investments, and Mortgage Insurance.
| • | Protection. In the United States, we are a leading provider of life insurance and long-term care insurance, have developed linked benefit products such as long-term care insurance linked with life insurance or an annuity and offer selected senior services and products including Medicare supplement insurance. We also offer group life and health insurance primarily to companies with fewer than 1,000 employees. In January 2007, we announced an agreement to sell the group life and health business and expect to close the transaction in the second quarter of 2007. Outside the U.S., we offer payment protection insurance, which helps consumers meet specified payment obligations should they become unable to pay due to accident, illness, involuntary unemployment, disability or death. For the year ended December 31, 2006, our Protection segment had segment net operating income of $614 million. |
| • | Retirement Income and Investments. We offer our U.S. customers a variety of wealth accumulation, income distribution and institutional investment products. Retail products include: individual fixed and variable annuities; group variable annuities offered through retirement plans; single premium immediate annuities; variable life insurance; and a variety of managed account programs and services, financial planing advisory services and managed proprietary and third-party mutual funds. Institutional products include: funding agreements FABNs, asset management products and services and GICs. For the year ended December 31, 2006, our Retirement Income and Investments segment had segment net operating income of $237 million. |
| • | Mortgage Insurance. In the U.S., Canada, Australia, New Zealand, Mexico, Japan and multiple European countries, we offer mortgage insurance products that enable borrowers to buy homes with low-down-payments. We also provide mortgage insurance on a structured, or bulk basis, that aids in the sale of mortgages to the capital markets, and which helps lenders manage capital and risks. Additionally, we offer services, analytical tools and technology that enable lenders to operate more efficiently and more effectively manage risk. For the year ended December 31, 2006, our Mortgage Insurance segment had segment net operating income of $614 million. |
We also have Corporate and Other activities, which consists primarily of unallocated corporate income and expenses, the results of a small, non-core business that is managed outside our operating segments, and most of our interest and other financing expenses. For the year ended December 31, 2006, Corporate and Other had net operating losses of $107 million.
80
Our corporate formation
We were incorporated in Delaware on October 23, 2003 in preparation for our corporate formation and the IPO. In connection with the IPO, we acquired substantially all of the assets and liabilities of GEFAHI. GEFAHI is an indirect subsidiary of GE and prior to the completion of the IPO, was a holding company for a group of companies that provide life insurance, long-term care insurance, group life and health insurance, annuities and other investment products and U.S. mortgage insurance. We also acquired certain other insurance businesses that were owned by other GE subsidiaries but managed by members of the Genworth management team. These businesses include international mortgage insurance, payment protection insurance based in Europe, a Bermuda reinsurer and mortgage contract underwriting. In consideration for the assets that we acquired and the liabilities that we assumed in connection with our corporate formation, we issued to GEFAHI 489.5 million shares of our Class B Common Stock, $600 million of our Equity Units, $100 million of our Series A Preferred Stock, a $2.4 billion short-term note and a $550 million contingent non-interest-bearing note. We refinanced the $2.4 billion note with $1.9 billion of senior notes and $500 million of commercial paper shortly after the IPO, and we repaid the contingent note in December 2004.
In connection with our corporate formation and the IPO, we entered into a number of arrangements with GE governing our separation from GE and a variety of transition and other matters, including our relationship with GE while GE remained a significant stockholder in our company. These arrangements include several significant reinsurance transactions with UFLIC, an indirect subsidiary of GE. As part of these transactions, effective as of January 1, 2004, we ceded to UFLIC all of our structured settlement contracts and substantially all of our variable annuity contracts, and a block of long-term care insurance policies that we reinsured in 2000 from The Travelers Insurance Company. In the aggregate, these blocks of business did not meet our target return thresholds, and although we remain liable under these contracts and policies as the ceding insurer, the reinsurance transactions have the effect of transferring the financial results of the reinsured blocks to UFLIC. We continue to service the blocks of business that we reinsured, which preserves our operating scale and enables us to service and grow our new sales of these products. In addition, as part of the reinsurance transactions, UFLIC ceded to us substantially all of its in-force blocks of Medicare supplement insurance.
Our financial information
The financial information in this Annual Report on Form 10-K has been derived from our financial statements, which have been prepared as if Genworth had been in existence throughout all periods. Our financial statements include, for all periods, the insurance businesses that we acquired from GE subsidiaries in connection with our corporate formation on May 24, 2004. Until the corporate formation, our financial statements also included the businesses that were owned by GEFAHI but not transferred to us in connection with our corporate formation. In addition to our three operating segments and our Corporate and Other activities, our financial statements also include the results of (1) the Partnership Marketing Group business, which offers life and health insurance, auto club memberships and other financial products and services directly to consumers through affinity marketing arrangements with a variety of organizations, (2) an institutional asset management business owned by GEFAHI, and (3) several other small businesses owned by GEFAHI that are not part of our core ongoing business.
The Partnership Marketing Group historically included UFLIC, a subsidiary that offered life and health insurance products through affinity marketing arrangements. In connection with the IPO, GEFAHI transferred UFLIC to General Electric Capital Services, Inc., a direct wholly-owned subsidiary of GE. We did not acquire the Partnership Marketing Group business, the institutional asset management business or these other small businesses from GEFAHI, and their results are presented as a separate operating segment under the caption Affinity.
Our financial statements also include our Japanese life insurance and domestic auto and homeowners’ insurance businesses, which we sold on August 29, 2003, and which are presented in our financial statements as discontinued operations.
81
Revenues and expenses
Our revenues consist primarily of the following:
| • | Protection. The revenues in our Protection segment consist primarily of: |
| • | net premiums earned on individual life, individual and group long-term care, Medicare supplement insurance, group life and health and payment protection insurance policies; |
| • | net investment income and net investment gains (losses) on the separate investment portfolio held by our payment protection insurance business, and net investment income and net investment gains (losses) allocated to this segment’s other lines of business; and |
| • | policy fees and other income, including fees for mortality and surrender charges primarily from universal life insurance policies, and other administrative charges. |
| • | Retirement Income and Investments. The revenues in our Retirement Income and Investments segment consist primarily of: |
| • | net premiums earned on single premium immediate annuities and structured settlements with life contingencies; |
| • | net investment income and net investment gains (losses) allocated to this segment; and |
| • | policy fees and other income, including surrender charges, mortality and expense charges, investment management fees and commissions. |
| • | Mortgage Insurance. The revenues in our Mortgage Insurance segment consist primarily of: |
| • | net premiums earned on mortgage insurance policies; |
| • | net investment income and net investment gains (losses) on the segment’s separate investment portfolio; and |
| • | policy fees and other income, including fees from contract underwriting services. |
| • | Corporate and Other. The revenues in Corporate and Other consist primarily of: |
| • | net premiums, policy fees and other income from small non-core insurance businesses in this segment; |
| • | unallocated net investment income and net investment gains (losses). |
In 2006, we began to allocate net investment gains (losses) from Corporate and Other to our Protection (except payment protection insurance) and Retirement Income and Investments segments using an approach based principally upon the investment portfolios established to support each of those segments’ products and targeted capital levels. We do not allocate net investment gains (losses) from Corporate and Other to our Mortgage Insurance segment or to our payment protection insurance business within the Protection segment because they have their own separate investment portfolios, and net investment gains (losses) from those portfolios are reflected in the Mortgage Insurance and Protection segment results, respectively.
Prior to 2006, all net investment gains (losses) were recorded in Corporate and Other and were not reflected in the results of any of our other segments.
Our expenses consist primarily of the following:
| • | benefits provided to policyholders and contractholders and changes in reserves; |
| • | interest credited on general account balances; |
| • | operating expenses, including commissions, marketing expenses, policy and contract servicing costs, overhead and other general expenses that are not capitalized (shown net of deferrals); |
82
| • | amortization of deferred policy acquisition costs and other intangible assets; |
| • | interest and other financing expenses; and |
| • | income taxes. |
We allocate corporate expenses to each of our operating segments based on the amount of capital allocated to that segment.
Business trends and conditions
In recent years, our business has been, and we expect will continue to be, influenced by a number of industry-wide and product-specific trends and conditions. For discussion of the market and economic environment, see “Item 1—Business—Market Environment and Opportunities.”
General conditions and trends affecting our businesses
Interest rate fluctuations. Fluctuations in market interest rates and the related yield curve may have a significant effect on our sales of insurance and investment products and our margins on these products. Interest rates are highly sensitive to many factors, including governmental monetary policies, domestic and international economic and political conditions and other factors beyond our control.
In our Retirement Income and Investments and Protection segments, low market interest rates may reduce the spreads between the amounts we credit fixed annuity and individual life policyholders and contractholders and the yield we earn on the investments that support these obligations. In response to the unusually low interest rates that have prevailed during the last several years, we have reduced the guaranteed minimum crediting rates on newly issued fixed annuity contracts and have reduced crediting rates on in-force contracts where permitted to do so. These actions have helped mitigate the adverse impact of low interest rates on our spreads and profitability on these products. In addition, the recent inverting of the yield curve reduces the attractiveness of certain fixed annuity products relative to other short-term investment alternatives. A gradual increase in longer-term interest rates along with an upwardly sloping yield curve generally will have a favorable effect on the profitability of these products. However, rapidly rising interest rates also could result in reduced persistency in our spread-based retail products as contractholders shift assets into higher yielding investments.
In our Protection segment, the pricing and expected future profitability of our long-term care insurance products are based in part on expected investment returns. Over time, term life and long-term care insurance products generally produce positive cash flows as customers pay periodic premiums, which we invest as we receive them. Low interest rates may reduce our ability to achieve our targeted investment margins and may adversely affect the profitability of our long-term care insurance products. The impact of interest rate fluctuations on our term life insurance products is similar, but less than its impact on long-term care products.
In our Mortgage Insurance segment, increasing interest rates in 2004 through 2006 contributed to a general decrease in new mortgage originations in the U.S. since 2003. The level of new mortgage originations was $2,980 billion, $3,120 billion and $2,920 billion for the years ended December 31, 2006, 2005 and 2004, respectively. This compares to $3,945 billion of new mortgage originations for the year ended December 31, 2003. We believe the decrease in mortgage originations since 2003 was principally driven by two factors. First, increasing interest rates in 2004 through 2006 made refinancing of existing mortgages less attractive to consumers than in recent years. Second, with historically low interest rates in 2002 and 2003, many mortgages for which refinancing would otherwise have been economically attractive were already refinanced. This reduction in refinancing activity in turn contributed to an increase in persistency in our U.S. flow business, from 46% for the year ended December 31, 2003 to 65%, 65% and 73% for the years ended December 31, 2004, 2005 and 2006, respectively. Continued interest rate increases may have a favorable impact on persistency and could have an adverse impact on new mortgage originations. In addition, home price appreciation has slowed in 2006, causing policy cancellations to decline, which has positively affected our U.S. flow persistency rate.
83
Investment portfolio. Our current investment strategy is to optimize investment income without relying on realized investment gains. Our overall investment yield increased from 5.5% for the year ended December 31, 2004 to 5.6% for the year ended December 31, 2005 and increased to 5.8% for the year ended December 31, 2006. We seek to improve our investment yield by continuously evaluating our asset class mix, pursuing additional investment classes and accepting additional credit risk with higher returns when we believe that it is prudent to do so.
Credit default risk. As a result of the economic downturn in 2000 through 2002 and some high-profile corporate bankruptcies and scandals, the number of companies defaulting on their debt obligations increased dramatically in 2001 and 2002. These defaults and other declines in the value of some of our investments resulted in impairment charges. Credit defaults have decreased in recent years as the economy has improved. Charges associated with impairments of investments were $8 million, $71 million and $26 million for the years ended December 31, 2006, 2005 and 2004, respectively. A weakening in the economic recovery could lead to increased credit defaults.
Globalization. Historically, we have derived a majority of our net income from our operations in the U.S. However, in recent years, our international business has grown and has had an increasing impact on our financial condition and results of operations. For the years ended December 31, 2006, 2005 and 2004, 37%, 32% and 29% of our net income from continuing operations, respectively, were generated by our international operations. These increases were largely due to growth in our international mortgage insurance business. We are exposed to the impact of fluctuations in exchange rates as we translate the operating results of our foreign operations into our financial statements. As a result, period-to-period comparability of our results of operations is affected by fluctuations in exchange rates. Our net income for the years ended December 31, 2006, 2005 and 2004 included approximately $12 million, $4 million and $31 million, respectively, due to the favorable impact of changes in foreign exchange rates. Our four principal foreign currencies are the Canadian dollar, the Australian dollar, the British pound and the Euro.
Ongoing operating cost reductions and efficiencies. We continually focus on efficiently managing our cost base while maintaining strong service levels for our customers. We expect to accomplish this goal in each of our operating units through a wide range of cost management disciplines, including consolidating operations, using low-cost operating locations, reducing supplier costs, leveraging process improvement efforts, forming dedicated teams to identify opportunities for efficiencies and investing in new technology, particularly for web-based, digital end-to-end processes.
Developments affecting our product lines
Life insurance. Results in our life insurance business are impacted by sales, mortality, persistency, investment yields, and statutory reserve requirements. Additionally, sales of our products are dependent on pricing and other competitive product features, distribution penetration, and customer service. Regulation XXX requires insurers to establish additional statutory reserves for term life insurance policies with long-term premium guarantees, which increases the capital required to write these products. For term life insurance, we have implemented capital management actions that improve our new business returns and have, in part, enabled us to decrease our premium rates. Several competitors have executed similar capital management actions. Additionally, we have seen some competitors lower their term prices, which has made the market more competitive and could affect our future sales levels.
In addition, Regulation AXXX requires insurers to establish additional statutory reserves for certain universal life policies with secondary guarantees. In 2006, we were the first company to issue non-recourse funding obligations to fund statutory reserves required by Regulation AXXX for certain blocks of our universal life business.
As previously noted, we have recently experienced heightened price competition in the term life marketplace and we have experienced a shifted focus by our distribution customers to universal life products. In
84
response to this, we are broadly building our universal life capabilities and maintaining a disciplined approach to term life sales. Our future sales levels and returns on new business could be impacted by the increased competition and shift in distribution focus.
Long-term care insurance. Results of our long-term care insurance business are influenced by morbidity, persistency, investment yields, new product sales, expenses and reinsurance. Industry-wide first-year annualized premiums of individual long-term care insurance decreased approximately 8% for the year ended December 31, 2006 compared to the year ended December 31, 2005 according to the most recently published data by LIMRA International. Our sales growth in a challenging market reflects the breadth of our distribution and progress across multiple growth initiatives with an emphasis on broadening our product offerings, although, sales growth has been slower than anticipated over the last couple of years. However, the continued low interest rate environment and the impact of lower termination rates on older issued policies, some with expiring reinsurance coverage, are causing higher benefits and other changes in policy reserves, resulting in lower net operating income. In response to these trends, we will continue to pursue multiple growth initiatives, invest in claims process improvements, maintain tight expense management, actively explore reinsurance and capital market solutions, execute investment strategies and, if appropriate, consider rate increases to improve profitability of the block.
During the second quarter of 2006, we completed the acquisition of Continental Life, a provider of Medicare supplement insurance, for approximately $145 million, plus contingent consideration of up to $10 million. This acquisition enhances our presence in the senior supplemental insurance market by more than doubling our existing annualized premiums for this product and giving us access to approximately 4,200 independent agents.
Payment protection insurance. Growth of our payment protection insurance business is dependent on economic conditions including consumer lending levels, client account penetration and the number of countries and markets we enter. Additionally, the types and mix of our products will vary based on regulatory and consumer acceptance of our products. Our payment protection insurance business continues to show growth from increased penetration of existing relationships, and the addition of new distribution relationships in existing and new countries.
Retirement products. Retirement Income and Investments segment results are affected by investment performance, interest rate levels, slope of the interest rate yield curve, net interest spreads, equity market fluctuations, mortality and the impact of new product sales and lapses. In addition, our competitive position within many of our distribution channels, as well as our ability to retain business, depends significantly upon product features, including current and minimum crediting rates on spread-based products relative to our competitors, surrender charge periods in fixed annuities as well as guaranteed features we offer in variable products. We continually evaluate our competitive position based upon each of those features, and we make adjustments as appropriate to meet our target return thresholds.
The recent flat to inverted yield curve has reduced the attractiveness of certain fixed annuities relative to investment alternatives, such as certificates of deposit. These trends are having an adverse impact on both sales and retention of fixed annuities with the latter resulting in an acceleration of DAC amortization. In recent quarters, we have experienced improved spreads in fixed annuities primarily due to the runoff and crediting rate resets of lower return business. We expect these trends to continue.
We continue to focus on our Income Distribution Series of variable annuity products and riders. We have witnessed a decline in defined benefit retirement plans in favor of defined contribution plans with more of the responsibility for retirement income planning falling on the individual. Additionally, U.S. savings rates are at historical lows. We believe these factors support demand for individual and group retirement income products that provide various forms of guaranteed benefits with the opportunity to realize upside market performance. Our Income Distribution Series provides the contractholder with the ability to receive a guaranteed minimum income stream that they cannot outlive, along with an opportunity to participate in market appreciation. However,
85
through various techniques, these products are designed to reduce some of our risks that generally accompany traditional products with guaranteed living benefits. We are targeting individuals who are focused on building a personal portable retirement plan or are moving from the accumulation to the distribution phase of their retirement planning.
We offer asset management products to individual investors and support services for independent broker-dealers and registered investment advisors. The industry is witnessing rapid increases of independent broker-dealer representatives and registered investment advisors as registered representatives are leaving large national firms to form their own small firms. These new small firms need client and back office support services and access to technology. Further, individuals are increasingly transferring their assets to managed products from mutual funds. We expect these trends to continue and possibly accelerate in the future. As a result of these trends, we are expanding our presence in this market and have completed the acquisition of AssetMark, a leading provider of open architecture asset management solutions to independent financial advisors, with more than $9 billion in assets under management. Our asset management products consist of separately managed accounts and managed mutual fund accounts. We receive a management fee based upon the amount of assets under management. The results of our asset management business are a function of net flows and investment performance of assets under management, which are influenced by the relative performance of our products’ underlying investments and the overall equity market environment.
Mortgage insurance. The results of our Mortgage Insurance segment are affected by employment and other economic and housing markets trends, including interest rate trends, home price appreciation, mortgage origination volume and levels of mortgage delinquencies (including seasonal effects). In addition, movements in foreign currency exchange rates affect our international mortgage insurance results.
We believe the U.S. economy overall remains relatively strong based on continued gross domestic product growth and low levels of unemployment. However, we believe the U.S. housing market has slowed and home price appreciation has declined. In particular, certain areas of the Great Lakes region have experienced an economic slowdown and have seen a more pronounced weakness in their housing market as well as a decline in home prices. While our portfolio concentration in the impacted areas is limited to less than 10% of our total risk in-force, these areas of weakness have contributed disproportionately to the increase in our U.S. losses and loss ratio. Continued low home price appreciation may cause further increases in our U.S. losses and loss ratio.
The recent rise in interest rates and lower home price appreciation in the U.S. have contributed to rising persistency rates. We believe that sustained higher interest rates, increased persistency and our ongoing growth strategy will lead to stable to growing levels of insurance in-force. Primary insurance in-force in our U.S. mortgage insurance business increased from $100 billion as of December 31, 2005 to $113 billion as of December 31, 2006. This increase in primary insurance-in-force reflects an increase in our bulk product writings and the first year-over-year increase in flow insurance in-force in 5 years.
The demand for flow private mortgage insurance declined in the year ended December 31, 2006 as compared to the same period in 2005, according to data published by Inside Mortgage Finance. We believe this was driven principally by the origination of mortgages that did not meet the eligibility requirements of Fannie Mae and Freddie Mac and mortgages that were securitized in mortgage-backed securities that did not use private mortgage insurance, in addition to the continued usage of simultaneous second mortgages as an alternative to private mortgage insurance. However, we believe the usage of simultaneous second mortgages began to decline during 2006 driven by a smaller spread between short-term and long-term interest rates, which reduced the competitive advantage of simultaneous second loans.
The bulk mortgage insurance market is increasing as a percentage of the overall primary mortgage insurance market, which we believe is driven in part, by an increase in non-prime mortgage-backed security issuances. We have increased our participation in selected segments of the bulk market where we believe we will be able to meet our targeted risk-adjusted returns and continue to evaluate additional opportunities this market presents.
86
Our international mortgage insurance business has continued to expand with favorable operating results. We expect that the growth of our established international mortgage insurance business and our entry into new international markets will continue to contribute an increasing portion of this segment’s total revenues and profits.
As a result of the significant U.S. refinancing activity since 2002 and the expansion of our international business in recent years, as of December 31, 2006, approximately 63% of our U.S. risk in-force and 61% of our international risk in-force have not yet reached its anticipated highest claim frequency years, which are generally between the third and seventh year of the loan. We expect our loss experience on these loans will increase as these books of business continue to mature.
In the second quarter of 2006, the Canadian government passed legislation expanding its authority to guarantee mortgage insurance to cover any Canadian licensed mortgage insurer without the need for further legislation, which may enable potential new competitors to enter the market. The aggregate cap for all Canadian licensed mortgage insurers guaranteed policies was also increased to CDN $200 billion, which facilitates our ongoing ability to offer mortgage insurance products under the guarantee.
Arrangements with GE
GE historically has provided a variety of products and services to us, and we have provided various products and services to GE. In connection with the IPO, we entered into a transition services agreement and various other agreements with GE that, together with a number of agreements that were in effect before the IPO, govern the relationship between GE and us. Many of these agreements were entered into to provide for our transition to a stand-alone company following the IPO. As of December 31, 2006, we no longer utilize any significant services from GE, although we continue to be a party to the following significant financial arrangements as noted below:
| • | Tax Matters Agreement. As a consequence of our separation from GE, and our election jointly made with GE to treat that separation as an asset sale under section 338 of the Internal Revenue Code, we became entitled to additional tax deductions for post-IPO periods. For further discussion of our Tax Matters Agreement, see note 14 to our consolidated financial statements under “Item 8—Financial Statements and Supplementary Data.” |
| • | UFLIC reinsurance arrangements. Prior to the completion of the IPO, we entered into several significant reinsurance transactions with UFLIC, an indirect subsidiary of GE. For further discussion of our UFLIC reinsurance arrangements, see note 9 to our consolidated financial statements under “Item 8—Financial Statements and Supplementary Data.” |
For information regarding other arrangements with GE, see note 17 to our consolidated financial statements under “Item 8—Financial Statements and Supplementary Data.”
Critical accounting policies
The accounting policies discussed in this section are those that we consider to be particularly critical to an understanding of our financial statements because their application places the most significant demands on our ability to judge the effect of inherently uncertain matters on our financial results. For all of these policies, we caution that future events rarely develop exactly as forecast, and our management’s best estimates may require adjustment.
Valuation of investment securities. We obtain values for actively traded securities from external pricing services. For infrequently traded securities, we obtain quotes from brokers or we estimate values using internally developed pricing models. These models are based upon common valuation techniques and require us to make assumptions regarding credit quality, liquidity and other factors that affect estimated values. We regularly review investment securities for impairment in accordance with our impairment policy, which includes both quantitative and qualitative criteria. Quantitative criteria include length of time and amount that each security position is in an
87
unrealized loss position, and for fixed maturities, whether the issue r is in compliance with terms and covenants of the security. Qualitative criteria include the financial strength and specific prospects for the issuer as well as our intent to hold the security until recovery. Our impairment reviews involve our finance, risk and asset management teams, as well as the portfolio management and research capabilities of GEAM, and other third-party managers, as required. We actively perform comprehensive market research, monitor market conditions and segment our investments by credit risk in order to minimize impairment risks.
Deferred acquisition costs. DAC represents costs which vary with and are primarily related to the sale and issuance of our insurance policies and investment contracts that are deferred and amortized over the estimated life of the related insurance policies. These costs include commissions in excess of ultimate renewal commissions, solicitation and printing costs, sales material and some support costs, such as underwriting and contract and policy issuance expenses. DAC is subsequently amortized to expense, over the lives of the underlying contracts, in relation to the anticipated recognition of premiums or gross profits.
The amortization of DAC for traditional long-duration insurance products (including guaranteed renewable term life, life-contingent structured settlements and immediate annuities and long-term care insurance) is determined as a level proportion of premium based on commonly accepted actuarial methods and reasonable assumptions, established when the contract or policy is issued, about mortality, morbidity, lapse rates, expenses, and future yield on related investments. U.S. GAAP requires that assumptions for these types of products not be modified (or unlocked) unless recoverability testing deems them to be inadequate or a re-pricing event occurs. Amortization is adjusted each period to reflect policy lapse or termination rates as compared to anticipated experience. Accordingly, we could experience accelerated amortization of DAC if policies terminate earlier than originally assumed.
Amortization of DAC for annuity contracts without significant mortality risk and investment and universal life products is based on expected gross profits. Expected gross profits are adjusted quarterly to reflect actual experience to-date or for the unlocking of underlying key assumptions based on experience studies such as mortality, withdrawal or lapse rates, investment margin or maintenance expenses. The estimation of expected gross profits is subject to change given the inherent uncertainty as to the underlying key assumptions employed and the long duration of our policy or contract liabilities. Changes in expected gross profits reflecting the unlocking of key assumptions could result in a material increase or decrease in the amortization of DAC depending on the magnitude of the change in underlying assumptions. Significant factors that could result in a material increase or decrease in DAC amortization for these products include material changes in withdrawal or lapse rates, investment spreads or mortality assumptions. For the years ended December 31, 2006 and 2005, key assumptions were unlocked in our Protection and Retirement Income and Investments segments to reflect our current expectation of future investment spreads and mortality.
The amortization of DAC for mortgage insurance is based on expected gross margins. Expected gross margins, defined as premiums less losses, are set based on assumptions for future persistency and loss development of the business. These assumptions are updated quarterly for actual experience to-date or as our expectations of future experience are revised based on experience studies. Due to the inherent uncertainties in making assumptions about future events, materially different experience from expected results in persistency or loss development could result in a material increase or decrease to DAC amortization for this business. For the years ended December 31, 2006 and 2005, key assumptions were unlocked in our Mortgage Insurance segment to reflect our current expectation of future persistency.
88
The following table sets forth the increase (decrease) on amortization of DAC related to unlocking of key assumptions by segment for the periods indicated:
| Years ended December 31, | |||||||||||
| (Amounts in millions) |
2006 | 2005 | 2004 | ||||||||
| Protection |
$ | (7 | ) | $ | 2 | $ | (6 | ) | |||
| Retirement Income and Investments |
12 | 1 | 3 | ||||||||
| Mortgage insurance |
2 | 4 | (8 | ) | |||||||
| Total |
$ | 7 | $ | 7 | $ | (11 | ) | ||||
The DAC amortization methodology for our variable products (variable annuities and variable universal life insurance) includes a long-term equity market average appreciation assumption of 8.5%. When actual returns vary from the expected 8.5% we assume a reversion to this mean over a 3- to 5-year period, subject to the imposition of ceilings and floors. The assumed returns over this reversion period are limited to the 85th percentile of historical market performance. Variation in equity market returns that could be considered reasonably likely would not have a material effect on the amortization of DAC.
We regularly review DAC to determine if it is recoverable from future income. For deposit products, if the current present value of estimated future gross profits is less than the unamortized DAC for a line of business, a charge to income is recorded for additional DAC amortization or for increased benefit reserves. For other products, if the benefit reserves plus anticipated future premiums and interest income for a line of business are less than the current estimate of future benefits and expenses (including any unamortized DAC), a charge to income is recorded for additional DAC amortization or for increased benefit reserves.
As of December 31, 2006, we believe all of our businesses have sufficient future income, where the related DAC would be recoverable under adverse variations in morbidity, mortality, withdrawal or lapse rate, maintenance expense or interest rates that could be considered reasonably likely to occur. For the years ended December 31, 2006, 2005 and 2004, there were no material charges to income as a result of our DAC recoverability testing.
Present value of future profits. In conjunction with the acquisition of a block of insurance policies or investment contracts, a portion of the purchase price is assigned to the right to receive future gross profits arising from existing insurance and investment contracts. This intangible asset, called PVFP, represents the actuarially estimated present value of future cash flows from the acquired policies. PVFP is amortized, net of accreted interest, in a manner similar to the amortization of DAC.
We regularly review our assumptions and periodically test PVFP for recoverability in a manner similar to our treatment of DAC.
As of December 31, 2006, we believe all of our businesses have sufficient future income, where the related PVFP would be recoverable under adverse variations in morbidity, mortality, withdrawal or lapse rate, maintenance expense or interest rates that could be considered reasonably likely to occur. For the years ended December 31, 2006, 2005 and 2004, there were no material charges to income as a result of our PVFP recoverability testing.
Valuation of goodwill. Goodwill represents the excess of the amount paid to acquire a business over the fair value of its net assets at the date of acquisition. Subsequent to acquisition, goodwill could become impaired if the fair value of a reporting unit as a whole were to decline below the value of its individual identifiable assets and liabilities. This may occur for various reasons, including changes in actual or expected income or cash flows of a reporting unit, generation of income by a reporting unit at a lower rate of return than similar businesses or declines in market prices for publicly traded businesses similar to our reporting unit.
89
Under U.S. GAAP, we test the carrying value of goodwill for impairment annually at the “reporting unit” level, which is either an operating segment or a business one level below the operating segment. Under certain circumstances, interim impairment tests may be required if events occur or circumstances change that would more likely than not reduce the fair value of a reporting unit below its carrying value.
The initial recognition of goodwill and subsequent testing for impairment require management to make assumptions concerning how the reporting unit will perform in the future. These assumptions are based on our historical experience and our expectations of future performance. Our estimates are subject to change given the inherent uncertainty in predicting future performance and cash flows, which are impacted by such as things as policyholder behavior, competitor pricing, new product introductions and specific industry and market conditions.
For the years ended December 31, 2006, 2005 and 2004, there were no charges to income as a result of our goodwill impairment testing.
Insurance liabilities and reserves. We calculate and maintain reserves for the estimated future payment of claims to our policyholders and contractholders based on actuarial assumptions and in accordance with industry practice and U.S. GAAP. Many factors can affect these reserves, including economic and social conditions, inflation, healthcare costs, changes in doctrines of legal liability and damage awards in litigation. Therefore, the reserves we establish are necessarily based on estimates, assumptions and our analysis of historical experience. Our results depend significantly upon the extent to which our actual claims experience is consistent with the assumptions we used in determining our reserves and pricing our products. Our reserve assumptions and estimates require significant judgment and, therefore, are inherently uncertain. We cannot determine with precision the ultimate amounts that we will pay for actual claims or the timing of those payments.
Insurance reserves differ for long- and short-duration insurance policies and annuity contracts. Measurement of long-duration insurance reserves (such as guaranteed renewable term life, whole life and long-term care insurance policies) is based on approved actuarial methods, but necessarily includes assumptions about expenses, mortality, morbidity, lapse rates and future yield on related investments. Short-duration contracts (such as payment protection insurance) are accounted for based on actuarial estimates of the amount of loss inherent in that period’s claims, including losses incurred for which claims have not been reported. Short-duration contract loss estimates rely on actuarial observations of ultimate loss experience for similar historical events.
Estimates of mortgage insurance reserves for losses and loss adjustment expenses are based on notices of mortgage loan defaults and estimates of defaults that have been incurred but have not been reported by loan servicers, using assumptions of claim rates for loans in default and the average amount paid for loans that result in a claim. As is common accounting practice in the mortgage insurance industry and in accordance with U.S. GAAP, loss reserves are not established for future claims on insured loans that are not currently in default.
Unearned premiums. For single premium insurance contracts, we recognize premiums over the policy life in accordance with the expected pattern of risk emergence. We recognize a portion of the revenue in premiums earned in the current period, while the remaining portion is deferred as unearned premiums and earned over time in accordance with the expected pattern of risk emergence. If single premium policies are canceled and the premium is non-refundable, then the remaining unearned premium related to each cancelled policy is recognized to earned premiums upon notification of the cancellation. The expected pattern of risk emergence on which we base premium recognition is inherently judgmental and is based on actuarial analysis of historical experience.
As of December 31, 2006 and 2005, we had $4.2 billion and $3.6 billion, respectively, of unearned premiums of which $2.3 billion and $1.8 billion, respectively, related to our international mortgage insurance business. We recognize international mortgage insurance unearned premiums over a period of up to 25 years, most of which are recognized between 3 and 7 years from issue date. The recognition of earned premiums for our international mortgage insurance business involves significant estimates and assumptions as to future loss
90
development and policy cancellations. These assumptions are based on our historical experience and our expectations of future performance, which are highly dependent on assumptions as to long-term macroeconomic conditions including interest rates, home price appreciation and the rate of unemployment. We periodically review our expected pattern of risk emergence and make adjustments based on actual experience and changes in our expectation of future performance with any adjustments reflected in current period income. For the years ended December 31, 2006 and 2005, increases to international mortgage insurance earned premiums as a result of adjustments made to our expected pattern of risk emergence and policy cancellations were $74 million and $21 million, respectively.
Our expected pattern of risk emergence for our international mortgage insurance business is subject to change given the inherent uncertainty as to the underlying loss development and policy cancellation assumptions and the long duration of our international mortgage insurance policy contracts. Actual experience that is different than assumed for loss development or policy cancellations could result in a material increase or decrease in the recognition of earned premiums depending on the magnitude of the difference between actual and assumed experience. Loss development and policy cancellation variations that could be considered reasonably likely to occur in the future would result in accelerated or decelerated recognition of earned premiums that would result in an increase in net income of up to $50 million or a decrease in net income of up to $25 million, depending on the magnitude of variation experienced. It is important to note that the variation discussed above is not meant to be a best-case or worst-case scenario, and therefore, it is possible that future variation may exceed the amounts discussed above.
The remaining portion of our unearned premiums relates to our payment protection insurance and long-term care insurance businesses where the underlying assumptions as to risk emergence are not subject to significant uncertainty. Accordingly, changes in underlying assumptions as to premium recognition we consider being reasonably likely for these businesses would not result in a material impact on net income.
Derivatives. We enter into freestanding derivative transactions primarily to manage the risk associated with variability in cash flows or changes in fair values related to our financial assets and liabilities. We also use derivative instruments to hedge certain currency exposures. We also purchase investment securities, issue certain insurance policies and engage in certain reinsurance contracts that have embedded derivatives. The associated financial statement risk is the volatility in net income which can result from (1) changes in fair value of derivatives not qualifying as accounting hedges; (2) ineffectiveness of designated hedges; and (3) counterparty default. Accounting for derivatives is complex, as evidenced by significant authoritative interpretations of the primary accounting standards which continue to evolve, as well as the significant judgments and estimates involved in determining fair value in the absence of quoted market values. These estimates are based on valuation methodologies and assumptions deemed appropriate in the circumstances. Such assumptions include estimated volatility and interest rates used in the determination of fair value where quoted market values are not available. The use of different assumptions may have a material effect on the estimated fair value amounts.
Valuation of deferred tax assets. Deferred tax assets represent the tax benefit of future deductible temporary differences and operating loss and tax credit carryforwards. Deferred tax assets are measured using the enacted tax rates expected to be in effect when such benefits are realized. Under U.S. GAAP, we test the value of deferred tax assets for impairment on a quarterly basis at the taxpaying component level of our Company within each tax jurisdiction, consistent with our filed tax returns. Deferred tax assets are reduced by a valuation allowance if, based on the weight of available evidence, it is more likely than not that some portion, or all, of the deferred tax assets will not be realized. In determining the need for a valuation allowance we consider carryback capacity, reversal of existing temporary differences, future taxable income, and tax planning strategies. The determination of the valuation allowance for our deferred tax assets requires management to make certain judgments and assumptions regarding future operations that are based on our historical experience and our expectations of future performance. Our judgments and assumptions are subject to change given the inherent uncertainty in predicting future performance, which is impacted by such things as policyholder behavior, competitor pricing, new product introductions, and specific industry and market conditions. At December 31,
91
2006, we have a net deferred tax liability of $1,550 million with a $56 million valuation allowance related to state and foreign gross deferred tax assets. We have a gross deferred tax asset of $239 million related to net operating loss carryforwards of $684 million at December 31, 2006, which, if not used, will expire beginning in 2020.
Contingent liabilities. A liability is contingent if the amount is not presently known, but may become known in the future as a result of the occurrence of some uncertain future event. We estimate our contingent liabilities based on management’s estimates about the probability of outcomes and their ability to estimate the range of exposure. Accounting standards require that a liability be recorded if management determines that it is probable that a loss has occurred and the loss can be reasonably estimated. In addition, it must be probable that the loss will be confirmed by some future event. As part of the estimation process, management is required to make assumptions about matters that are by their nature highly uncertain.
The assessment of contingent liabilities, including legal and income tax contingencies, involves the use of critical estimates, assumptions and judgments. Management’s estimates are based on their belief that future events will validate the current assumptions regarding the ultimate outcome of these exposures. However, there can be no assurance that future events, such as court decisions or Internal Revenue Service positions, will not differ from management’s assessments. Whenever practicable, management consults with third-party experts (including attorneys, accountants and claims administrators) to assist with the gathering and evaluation of information related to contingent liabilities. Based on internally and/or externally prepared evaluations, management makes a determination whether the potential exposure requires accrual in the financial statements.
92
Results of Operations
The following table sets forth our results of operations. Our results of operations include the results of operations of the Affinity segment and the blocks of business that we ceded to UFLIC through for all periods presented through May 24, 2004, the date of our corporate formation See “—Overview—Our Corporate Formation” for a discussion of our corporation reorganization, including our reinsurance transactions with UFLIC.
| Years ended December 31, | Increase (decrease) and percentage change |
|||||||||||||||||||||||||
| (Amounts in millions) |
2006 | 2005 | 2004 | 2006 vs. 2005 | 2005 vs. 2004 | |||||||||||||||||||||
| Revenues: |
||||||||||||||||||||||||||
| Premiums |
$ | 6,487 | $ | 6,297 | $ | 6,559 | $ | 190 | 3 | % | $ | (262 | ) | (4 | )% | |||||||||||
| Net investment income |
3,837 | 3,536 | 3,648 | 301 | 9 | % | (112 | ) | (3 | )% | ||||||||||||||||
| Net investment gains (losses) |
(69 | ) | (2 | ) | 26 | (67 | ) | NM | (1) | (28 | ) | (108 | )% | |||||||||||||
| Policy fees and other income |
774 | 673 | 824 | 101 | 15 | % | (151 | ) | (18 | )% | ||||||||||||||||
| Total revenues |
11,029 | 10,504 | 11,057 | 525 | 5 | % | (553 | ) | (5 | )% | ||||||||||||||||
| Benefits and expenses: |
||||||||||||||||||||||||||
| Benefits and other changes in policy reserves |
4,485 | 4,205 | 4,804 | 280 | 7 | % | (599 | ) | (12 | )% | ||||||||||||||||
| Interest credited |
1,522 | 1,425 | 1,432 | 97 | 7 | % | (7 | ) | — | % | ||||||||||||||||
| Acquisition and operating expenses, net of deferrals |
2,013 | 1,989 | 1,902 | 24 | 1 | % | 87 | 5 | % | |||||||||||||||||
| Amortization of deferred acquisition costs and intangibles |
727 | 794 | 1,064 | (67 | ) | (8 | )% | (270 | ) | (25 | )% | |||||||||||||||
| Interest expense |
364 | 293 | 217 | 71 | 24 | % | 76 | 35 | % | |||||||||||||||||
| Total benefits and expenses |
9,111 | 8,706 | 9,419 | 405 | 5 | % | (713 | ) | (8 | )% | ||||||||||||||||
| Income before income taxes, gain on sale of discontinued operations and cumulative effect of accounting change |
1,918 | 1,798 | 1,638 | 120 | 7 | % | 160 | 10 | % | |||||||||||||||||
| Provision for income taxes |
594 | 577 | 493 | 17 | 3 | % | 84 | 17 | % | |||||||||||||||||
| Income before gain on sale of discontinued operations and cumulative effect of accounting change |
1,324 | 1,221 | 1,145 | 103 | 8 | % | 76 | 7 | % | |||||||||||||||||
| Gain (loss) on sale of discontinued operations, net of taxes |
— | — | 7 | — | — | % | (7 | ) | (100 | )% | ||||||||||||||||
| Income before cumulative effect of accounting change |
1,324 | 1,221 | 1,152 | 103 | 8 | % | 69 | 6 | % | |||||||||||||||||
| Cumulative effect of accounting change, net of taxes |
4 | — | 5 | 4 | NM | (1) | (5 | ) | (100 | )% | ||||||||||||||||
| Net income |
1,328 | 1,221 | 1,157 | 107 | 9 | % | 64 | 6 | % | |||||||||||||||||
| Adjustments to net income: |
||||||||||||||||||||||||||
| Net investment (gains) losses, net of taxes and other adjustments |
34 | 1 | (16 | ) | 33 | NM | (1) | 17 | 106 | % | ||||||||||||||||
| Net tax benefit related to IPO |
— | — | (46 | ) | — | — | % | 46 | 100 | % | ||||||||||||||||
| Gain on outsourcing services agreement, net of taxes |
— | — | (25 | ) | — | — | % | 25 | 100 | % | ||||||||||||||||
| Gain (loss) on sale of discontinued operations, net of taxes |
— | — | (7 | ) | — | — | % | 7 | 100 | % | ||||||||||||||||
| Cumulative effect of accounting change, net of taxes |
(4 | ) | — | (5 | ) | (4 | ) | NM | (1) | 5 | 100 | % | ||||||||||||||
| Net operating income |
$ | 1,358 | $ | 1,222 | $ | 1,058 | $ | 136 | 11 | % | $ | 164 | 16 | % | ||||||||||||
| Net earnings per common share: |
||||||||||||||||||||||||||
| Basic |
$ | 2.91 | $ | 2.57 | $ | 2.36 | ||||||||||||||||||||
| Diluted |
$ | 2.83 | $ | 2.52 | $ | 2.36 | ||||||||||||||||||||
| Net operating earnings per common share: |
||||||||||||||||||||||||||
| Basic |
$ | 2.98 | $ | 2.57 | $ | 2.16 | ||||||||||||||||||||
| Diluted |
$ | 2.89 | $ | 2.52 | $ | 2.16 | ||||||||||||||||||||
| Weighted-average common shares outstanding: |
||||||||||||||||||||||||||
| Basic |
455.9 | 475.3 | 489.5 | |||||||||||||||||||||||
| Diluted |
469.4 | 484.6 | 490.5 | |||||||||||||||||||||||
| (1) | Not meaningful |
93
2006 vs. 2005
Premiums. Premiums consist primarily of premiums earned on insurance products for individual life, long-term care, Medicare supplement, group life and health, payment protection, single premium immediate annuities and structured settlements with life contingencies and mortgage insurance policies. Increases from our Mortgage Insurance and Protection segments of $250 million and $73 million, respectively, were offset by decreases in Retirement Income and Investments and Corporate and Other of $119 million and $14 million, respectively. Premiums in our Mortgage Insurance segment increased $250 million reflecting growth and aging of our of our international mortgage insurance in-force block of business and the periodic update and methodology refinements to the Australian and Canadian premium recognition factors. Premiums increased $73 million in our Protection segment primarily due to a $178 million increase in our long-term care business mainly from growth in the in-force block principally driven by new sales and renewal premiums and the Continental Life acquisition, which closed in May 2006. Additionally, our Protection segment increased $115 million primarily from growth in the in-force of our term life insurance and group business. Partially offsetting these increases in the Protection segment was a $220 million decrease from our payment protection business as a result of continued runoff of low return blocks of business, our exit from travel insurance and the reclassification of certain reinsurance assumed business from reinsurance accounting to the deposit method of accounting. Our Retirement Income and Investments segment decreased $119 million primarily attributable to a reduction in our life-contingent structured settlement annuities due to our continued pricing discipline in the current relatively low interest rate environment and our decision in the third quarter of 2006 to discontinue sales of this product.
Net investment income. Net investment income represents the income earned on our investments. Net investment income increased primarily as a result of an increase in average invested assets in our Protection segment attributable to growth of our long-term care in-force block and an increase related to assets purchased using proceeds from our issuance of non-recourse funding obligations supporting certain term and universal life insurance excess statutory reserves. Additionally, our Retirement Income and Investments segment average invested assets increased as a result of higher sales of our registered notes. Our Mortgage Insurance segment increased due to an increase in invested assets associated with the growth of our international mortgage business. Additionally, higher net investment income was due to an increase in weighted average investment yields to 5.8% for the year ended December 31, 2006 from 5.6% for the year ended December 31, 2005. The increase in weighted average investment yields was primarily attributable to increased yields on floating rate investments, as a result of a generally high short-term interest rate environment. Net investment income for the year ended December 31, 2006 included $98 million of investment income related to bond calls, commercial mortgage loan prepayments, limited partnership investments and the release of commercial mortgage loan loss reserves as compared to $121 million in 2005.
Net investment gains (losses). Net investment gains losses consist of realized gains and losses from sale or impairment of our investments, unrealized and realized gains and losses from our trading securities, fair value hedging relationships, and embedded derivatives. For the year ended December 31, 2006, gross investment gains were $81 million and gross investment (losses) were ($150) million, including ($8) million of impairments. Gross investment gains for the year ended December 31, 2006 were primarily attributable to $72 million in gains on the sale of available-for-sale fixed maturities and equity securities. Gross investment losses include $118 million of interest rate related losses as a result of the disposition of available-for-sale securities primarily for portfolio repositioning activities, $17 million on the derecognition of assets and liabilities associated with certain securitization entities, and $8 million for impairment charges. For the year ended December 31, 2005, gross investment gains on available-for-sale securities were $108 million and gross investment (losses) on available-for-sale securities were ($110) million, including ($71) million of impairments. The available-for-sale securities impairments related primarily to fixed maturity securities issued by companies in the automotive, transportation, finance and retail industries ($17 million, $16 million, $10 million and $9 million, respectively).
Policy fees and other income. Policy fees and other income consist primarily of cost of insurance and surrender charges assessed on universal life insurance policies, fees assessed against policyholder and contractholder account values, and commission income. The increase in policy fees and other income was
94
primarily due to higher sales and growth in assets under management in our Retirement Income and Investments’ fee-based products that resulted in a $106 million increase in policy fees and other income. This was partially offset by a $14 million reduction in our mortgage insurance business largely driven by lower contract underwriting fees in the U.S. mortgage insurance business and the elimination of Canadian application fees.
Benefits and other changes in policy reserves. Benefits and other changes in policy reserves consist primarily of benefits paid and reserve activity related to current claims and future policy benefits on insurance and investment products for life, long-term care, Medicare supplement, group life and health, payment protection, structured settlements and single premium immediate annuities with life contingencies and claim costs incurred related to mortgage insurance products. The increase in benefits and other changes in policy reserves was primarily driven by a $244 million increase in our long-term care business as a result of aging and growth in the in-force block, some with expiring reinsurance coverage, continued low termination rates on older issued policies as well as the Continental Life acquisition. Adding to this increase was a $131 million increase in our Mortgage Insurance segment primarily driven by higher losses from portfolio seasoning in our international mortgage insurance business, increased losses from a limited number of Australian distribution relationships and higher reserves as a result of a periodic update to our Australian loss reserve factors. Additionally, our U.S. mortgage insurance business increase was primarily attributable to higher average reserves per delinquency associated with higher loan balances in more recent books of business and aging of delinquent loans. Offsetting these increases was a $96 million decrease in our Retirement Income and Investments segment principally from a decrease in sales of life-contingent structured settlement annuities due to our continued pricing discipline in the current relatively low interest rate environment and our decision in the third quarter of 2006 to discontinue sales of this product.
Interest credited. Interest credited represents interest credited on behalf of policyholder and contractholder general account balances. The increase in interest credited from our Retirement Income and Investments segment was primarily due to a $129 million increase related to spread-based institutional products as a result of higher crediting rates on floating rate products, as a result of a generally high short-term interest rate environment, and higher assets under management. This increase was partially offset by a $49 million decrease in interest credited related to spread-based retail products, primarily due to fixed annuities crediting rates being reset to current, lower rates as the fixed annuities reach the end of their initial crediting rate guarantee period. In addition, interest credited increased $12 million in our long-term care insurance business mainly driven by growth in account value of our corporate owned life insurance block of business.
Acquisition and operating expenses, net of deferrals. Acquisition and operating expenses, net of deferrals, represent costs and expenses related to the acquisition and ongoing maintenance of insurance and investment contracts, including commissions, policy issuance expenses and other underwriting and general operating costs. These costs and expenses are net of amounts that are capitalized and deferred, which are primarily costs and expenses that vary with and are primarily related to the sale and issuance of our insurance policies and investment contracts, such as first-year commissions in excess of ultimate renewal commissions and other policy issuance expenses. Acquisition and operating expenses, net of deferrals, increased primarily from a $53 million increase in our long-term care business growth of in-force and the Continental Life acquisition. In addition, our Fee-based products in our Retirement Income and Investments segment increased $67 million primarily due to higher sales and growth in assets under management. These increases were partially offset by a $64 million decrease in our payment protection business and a decline of $27 million in our Corporate and Other.
Amortization of deferred acquisition costs and intangibles. Amortization of deferred acquisition costs and intangibles consists primarily of the amortization of acquisition costs that are capitalized, PVFP and capitalized software. Amortization of deferred acquisition costs and intangibles decreased as a result of a $109 million decrease in our Protection segment primarily attributable to an $88 million decrease in our payment protection insurance business and a $12 million decrease in our life insurance business. The decrease in our payment
95
protection insurance business was largely driven by the reclassification of certain reinsurance assumed business from reinsurance accounting to the deposit method of accounting and lower amortization from our runoff U.K. block of business. These decreases were offset by an $43 million increase in our Retirement Income and Investments segment primarily from accelerated amortization and unlocking of lapse assumptions for our spread-based retail products due to higher lapses in our fixed annuities.
Interest expense. Interest expense increased primarily as a result of the issuances of additional non-recourse funding obligations and an increase in average variable rates paid on those obligations. This was partially offset by a decrease in interest expense associated with the derecognition of borrowings related to securitization entities in the first quarter of 2006.
Provision for income taxes. The effective tax rate decreased to 31.0% for the year ended December 31, 2006 from 32.1% for the year ended December 31, 2005. This decrease in effective tax rate was primarily attributable to favorable examination developments, a reduction in excess foreign tax credits and an increase in lower taxed foreign earnings in 2006.
Net operating income. The increase in net operating income reflects increases in our Protection and Mortgage Insurance segments net operating income, offset by decreases in Retirement Income and Investments and Corporate and Other net operating income, as discussed in the “—Results of Operations by Segment.” Included in net operating income is a $12 million, net of tax, increase attributable to favorable changes in foreign exchange rates.
2005 vs. 2004
Premiums. Premiums decreased primarily due to the $239 million decrease in our Retirement Income and Investments segment primarily attributable to our continued pricing discipline on our life-contingent structured settlements and single premium immediate annuities in a low interest rate environment. Also contributing to the decrease was an $88 million decrease in our Affinity segment due to our corporate formation in 2004 in which we did not acquire the operations of this segment. Partially offsetting these decreases was an $82 million increase in our Mortgage Insurance segment driven by the continued growth and aging of our international mortgage insurance business.
Net investment income. Net investment income decreased as a result of a decrease in average invested assets, primarily due to the transfer of assets to UFLIC in connection with the reinsurance transactions, partially offset by new asset purchases. The decrease in net investment income was partially offset by an increase in weighted average investment yields to 5.6% for the year ended December 31, 2005 from 5.5% for the year ended December 31, 2004. The increase in weighted average investment yields was primarily attributable to a $32 million release of commercial mortgage loan reserves, higher derivative and limited partnership income, partially offset by purchases of new assets in an interest rate environment where current market yields were lower than existing portfolio yields.
Net investment gains (losses). For the year ended December 31, 2005, gross realized gains were $108 million and gross realized (losses) were $(110) million, including $71 million of impairments. These impairments were primarily attributable to fixed maturities, limited partnership investments and common stock investments ($64 million, $5 million and $1 million, respectively). The fixed maturities impairments primarily related to securities issued by companies in the automotive, transportation, finance and retail industries ($17 million, $16 million, $10 million and $9 million, respectively). Realized gains for the year ended December 31, 2005 were attributable to $80 million in gains on the sales of fixed maturities and preferred equities and recoveries on previously impaired securities of $28 million. For the year ended December 31, 2004, gross realized gains were $90 million and gross realized losses were $(64) million, including $26 million of impairments. These impairments were attributable to fixed maturities, mutual funds and limited partnership investments ($17 million, $5 million and $4 million, respectively). The fixed maturities impairments primarily related to securities issued by companies in the timber products, healthcare and consumer products industries ($6 million, $4 million and $3 million, respectively).
96
Policy fees and other income. Policy fees and other income decreased primarily due to a $104 million decrease in our Affinity segment resulting from our corporate formation in 2004. Also contributing to the decrease was a $36 million decrease in Corporate and Other primarily attributable to a gain recorded in 2004 related to our waiver of contractual rights under an outsourcing services agreement with GE’s global outsourcing provider, 60% of which was sold in 2004. Our Retirement Income and Investments segment also experienced a $27 million decrease primarily attributable to the reinsurance transactions with UFLIC, partially offset by increased product fees, management fees, commissions earned and other fees driven by the growth in assets under management.
Benefits and other changes in policy reserves. The decrease in benefits and other changes in policy reserves was primarily driven by a $522 million decrease in our Retirement Income and Investments segment primarily attributable to our reinsurance transactions with UFLIC and lower sales of structured settlements and single premium immediate annuities resulting from our continued pricing discipline. Also contributing to the decrease was an $80 million decrease in our Affinity segment due to the corporate formation in 2004.
Interest credited. The decrease was primarily driven by a $14 million decrease in our Retirement Income and Investments segment primarily attributable to the reinsurance transactions with UFLIC, partially offset by an increase in interest credited on floating rate products driven by higher average interest crediting rates in 2005 due to an increase in the short-term interest rates.
Acquisition and operating expenses, net of deferrals. Acquisition and operating expenses, net of deferrals, increased primarily due to a $153 million increase in our Protection segment, a $27 million increase in our Mortgage Insurance segment and a $21 million increase in Corporate and Other. The increase in our Protection segment was primarily attributable to an increase in commissions and other expenses in our payment protection insurance runoff block and higher non-deferrable acquisition costs in our long-term care and life businesses. The increase in our Mortgage Insurance segment was primarily attributable to increased costs in our existing international platforms and continued investments in potential new international mortgage insurance platforms. The increase in Corporate and Other is attributable to an increase in stand-alone costs as we transition towards full independence from GE and increased equity based compensation expense. These increases were partially offset by a $123 million decrease in our Affinity segment due to our corporate formation in 2004.
Amortization of deferred acquisition costs and intangibles. Amortization costs decreased primarily due to a $189 million decrease in our Protection segment primarily attributable to a decrease in our payment protection insurance business runoff block. Also contributing to the decrease was a $47 million decrease in our Affinity segment due to our corporate formation and a $39 million decrease in our Retirement Income and Investments segment primarily due to the reinsurance transactions with UFLIC.
Interest expense. Interest expense increased primarily as a result of the change in our capital structure in connection with our corporate formation in 2004, and an increase in interest paid on non-recourse funding obligations related to our term life insurance capital management strategy.
Provision for income taxes. The effective tax rate increased to 32.1% for the year ended December 31, 2005 from 30.1% for the year ended December 31, 2004. This increase in effective tax rate was primarily attributable to nonrecurring IPO related transaction tax benefits in 2004, offset in part by reductions in excess foreign tax credits and favorable examination developments in 2005.
Net operating income. The increase in net income from continuing operations reflects increases in segment net income in each of our segments, except for Corporate and Other and our Affinity segment.
Results of Operations by Segment
Management regularly reviews the performance of each of our operating segments (Protection, Retirement Income and Investments and Mortgage Insurance) based on the after-tax net operating income (loss) of the segment, which excludes; (1) cumulative effect of accounting changes and (2) infrequent or unusual
97
non-operating items. Certain other items, including most of our interest and other financing expenses and advertising, marketing and other corporate expenses, are included in Corporate and Other. Although these excluded items are significant to our consolidated financial performance, we believe that the presentation of segment net operating income (loss) enhances our understanding and assessment of the results of operations of our operating segments by highlighting net income (loss) attributable to the normal, recurring operations of our business. However, segment net operating income (loss) is not a substitute for net income determined in accordance with U.S. GAAP.
Protection segment
We offer U.S. customers life insurance, long-term care insurance, linked benefit products, Medicare supplement insurance and, primarily for companies with fewer than 1,000 employees, group life and health insurance. In Europe, we offer payment protection insurance in over 15 countries, which helps consumers meet their payment obligations in the event of illness, involuntary unemployment, disability or death. Effective January 1, 2006, our Mexico-domiciled subsidiary, previously included in Corporate and Other, is now being managed within our Protection segment and whose results are now included as part of the payment protection insurance business for the years ended December 31, 2006, 2005 and 2004.
Segment results of operations
The following table sets forth the results of operations relating to our Protection segment. Prior to our corporate formation, we entered into several significant reinsurance transactions with UFLIC in which we ceded to UFLIC a block of long-term care insurance policies that we reinsured from Travelers in 2000, and we assumed from UFLIC in-force blocks of Medicare supplement insurance policies. The Travelers long-term care block was ceded to UFLIC in connection with our corporate formation on May 24, 2004, and its results are not included after that date. Similarly, the Medicare supplement blocks were assumed from UFLIC in connection with our corporate formation on May 24, 2004, and its results are included after that date. As a result of the foregoing, our results of operations for the years ended December 31, 2006 and 2005 are not comparable to this segment’s results of operations for the year ended December 31, 2004.
| Years ended December 31, | Increase (decrease) and percentage change |
|||||||||||||||||||||||
| (Amounts in millions) |
2006 | 2005 | 2004 | 2006 vs. 2005 | 2005 vs. 2004 | |||||||||||||||||||
| Revenues: |
||||||||||||||||||||||||
| Premiums |
$ | 4,594 | $ | 4,521 | $ | 4,527 | $ | 73 | 2 | % | $ | (6 | ) | — | % | |||||||||
| Net investment income |
1,482 | 1,287 | 1,226 | 195 | 15 | % | 61 | 5 | % | |||||||||||||||
| Net investment gains (losses) |
5 | — | — | 5 | NM | (1) | — | — | % | |||||||||||||||
| Policy fees and other income |
379 | 371 | 364 | 8 | 2 | % | 7 | 2 | % | |||||||||||||||
| Total revenues |
6,460 | 6,179 | 6,117 | 281 | 5 | % | 62 | 1 | % | |||||||||||||||
| Benefits and expenses: |
||||||||||||||||||||||||
| Benefits and other changes in policy reserves |
3,175 | 2,926 | 2,920 | 249 | 9 | % | 6 | — | % | |||||||||||||||
| Interest credited |
384 | 369 | 362 | 15 | 4 | % | 7 | 2 | % | |||||||||||||||
| Acquisition and operating expenses, net of deferrals |
1,339 | 1,350 | 1,197 | (11 | ) | (1 | )% | 153 | 13 | % | ||||||||||||||
| Amortization of deferred acquisition costs and intangibles |
488 | 597 | 786 | (109 | ) | (18 | )% | (189 | ) | (24 | )% | |||||||||||||
| Interest expense |
141 | 52 | 15 | 89 | 171 | % | 37 | 247 | % | |||||||||||||||
| Total benefits and expenses |
5,527 | 5,294 | 5,280 | 233 | 4 | % | 14 | — | % | |||||||||||||||
| Income before income taxes |
933 | 885 | 837 | 48 | 5 | % | 48 | 6 | % | |||||||||||||||
| Provision for income taxes |
315 | 317 | 307 | (2 | ) | (1 | )% | 10 | 3 | % | ||||||||||||||
| Segment net income |
618 | 568 | 530 | 50 | 9 | % | 38 | 7 | % | |||||||||||||||
| Adjustments to segment net income: |
||||||||||||||||||||||||
| Net investment (gains) losses, net of taxes and other adjustments |
(4 | ) | — | — | (4 | ) | NM | (1) | — | — | % | |||||||||||||
| Segment net operating income |
$ | 614 | $ | 568 | $ | 530 | $ | 46 | 8 | % | $ | 38 | 7 | % | ||||||||||
| (1) | Not meaningful |
98
The following table sets forth net operating income for the products included in our Protection segment:
| For the years ended December 31, |
Increase (decrease) and percentage change |
|||||||||||||||||||||
| (Amounts in millions) |
2006 | 2005 | 2004 | 2006 vs. 2005 | 2005 vs. 2004 | |||||||||||||||||
| Segment net operating income: |
||||||||||||||||||||||
| Life insurance |
$ | 313 | $ | 275 | $ | 245 | $ | 38 | 14 | % | $ | 30 | 12 | % | ||||||||
| Long-term care insurance |
153 | 172 | 172 | (19 | ) | (11 | )% | — | — | % | ||||||||||||
| Payment protection insurance |
113 | 90 | 83 | 23 | 26 | % | 7 | 8 | % | |||||||||||||
| Group life and health insurance |
35 | 31 | 30 | 4 | 13 | % | 1 | 3 | % | |||||||||||||
| Total segment net operating income |
$ | 614 | $ | 568 | $ | 530 | $ | 46 | 8 | % | $ | 38 | 7 | % | ||||||||
2006 vs. 2005
Segment net operating income
Segment net operating income in our life insurance business increased primarily due to in-force growth in term life insurance and continued favorable mortality. The increase in our payment protection insurance business net operating income was primarily associated with growth in continental European and Ireland production and a lower effective tax rate, partially offset by lower income in the U.K. and included a $1 million decrease, net of tax, attributable to changes in foreign exchange rates. The decrease in our long-term care insurance business was principally the result of lower terminations on older issued policies and lower investment yields from the investment of net insurance cash flows at new money rates below our current portfolio yield. These factors more than offset growth from the acquisition of Continental Life as well as new business growth.
Our long-term care business net operating income in 2006 benefited from $8 million, net of tax, from reserve and other adjustments and $11 million from the Continental Life acquisition. We benefited in 2005 from an $18 million, net of tax, reserve and other adjustments. Net operating income in our life insurance business for 2005 was reduced by an $8 million unfavorable adjustment, net of tax, on reinsured term life insurance policies.
Revenues
Premiums increased $73 million driven by $178 million in our long-term care insurance business, $87 million in our life business and $28 million in our group business, offset by a decrease of $220 million in our payment protection business. The increase in our long-term care insurance business was attributable to growth in the long-term care insurance in-force block from new sales and renewal premiums and a $114 million increase in Medicare supplement primarily related to the Continental Life acquisition, which closed in May 2006. The increase in our life insurance business was due to in-force growth from new and renewal premiums of term life insurance. The increase in our group insurance business was principally from growth in our non-medical products and individual voluntary products, partially offset by decreases in medical products. Our payment protection insurance business decreased largely from the U.K. market including a $13 million decrease attributable to changes in foreign exchange rates. The decrease from the U.K. market was the result of continued runoff of low return blocks of business and our exit from travel insurance. Also, there was a $73 million decrease related to the reclassification of certain reinsurance assumed business from reinsurance accounting to the deposit method of accounting (“reinsurance accounting change”). This change had no impact on net income and prior year amounts have not been reclassified as such amounts were not material to our financial statements. Partially offsetting these decreases was growth in continental Europe and Ireland from new distribution relationships and an increase in consumer lending in those markets.
The increase in net investment income was primarily the result of growth of our long-term care in-force block and an increase in assets purchased using proceeds from our issuance of non-recourse funding obligations supporting certain term and universal life insurance policies. Net investment income also includes an $1 million
99
increase attributable to changes in foreign exchange rates in our payment protection insurance business. The increase in the payment protection business also included $22 million attributed to the reinsurance accounting change.
For a discussion of net investment gains (losses), see the comparison for this line item under “—Results of Operations.”
Policy fees and other income increased $8 million attributable to $8 million in our long-term care insurance business and $8 million in our life insurance business, offset by $4 million decreases in our group and payment protection insurance businesses. The decrease in our group insurance business was related to an expected drop in lives from exiting a third-party administrator business. The decrease in our payment protection business was largely due to the reinsurance accounting change of $8 million. The increase in our life insurance business was largely due to growth of our universal life insurance products. Partially offsetting this was a $13 million decrease related to an adjustment in unearned revenue in 2006, a $9 million increase related to an adjustment to unearned revenue on a closed block of non-standard business in 2005, and a $12 million decrease related to an adjustment on a reinsured block of term life insurance policies in 2005. The increase in our long-term care insurance business for 2006 is primarily the result of a $6 million reclassification from premiums.
Benefits and expenses
Benefits and other changes in policy reserves increased $249 million attributable to a $244 million increase in our long-term care insurance business, a $52 million increase in our life insurance business and a $29 million increase in our group insurance business, partially offset by a decrease of $76 million in our payment protection business. The increase in our long-term care insurance business was the result of aging and growth of the in-force block, continued low termination rates on older issued policies, some with expiring reinsurance coverage, and also included a $80 million increase from the Continental Life acquisition which closed in May 2006. The increase in our life insurance business was due mainly to growth of our term and universal life in-force that was partially offset by continued favorable mortality in 2006. The increase in our group insurance business was principally driven by growth and higher claims in our non-medical insurance products and individual voluntary products. The decrease in our payment protection insurance business was largely due to a decrease of $26 million related to the reinsurance accounting change and a reduction of claims in our run-off block of business within the U.K., offset by a $2 million increase attributable to changes in foreign exchange rates.
Our long-term care business benefits and other changes in policy reserves also included reserve adjustments in both years. 2006 includes a $27 million decrease due to a favorable adjustment related to group long-term care policies. 2005 included $35 million of net favorable reserve adjustments.
Interest credited increased $15 million principally from $12 million in our long-term care insurance business driven by growth in account value of our corporate owned life insurance block of business.
Acquisition and operating expenses, net of deferrals, decreased $11 million driven by decreases of $64 million in our payment protection insurance business and $8 million in our group insurance business, offset by a $53 million increase from our long-term care insurance business and an $8 million increase from our life insurance business. The increase in our long-term care insurance business was largely the result of growth of the in-force block, $17 million from the Continental Life acquisition and $8 million increase related to a reinsurance adjustment in 2006. The increase in our life insurance business was primarily due to 2005 expense favorability that did not recur in 2006. The decrease in our payment protection insurance business was principally from the $13 million reinsurance accounting change and our run-off block and included a $6 million increase attributable to changes in foreign exchange rates. In addition, there was a decrease of $13 million due to the release of a contingent liability resulting from the settlement reached with one of our distribution relationships.
Amortization of deferred acquisition costs and intangibles decreased $109 million largely the result of a $88 million decrease in our payment protection insurance business and a $12 million decrease in our life insurance
100
business. The decrease in our payment protection insurance business was primarily due to the reinsurance accounting change of $26 million and lower amortization from our runoff block and was partially offset by a $4 million increase attributable to changes in foreign exchange rates. Our long-term care insurance business decreased $8 million as a result of a $27 million unfavorable correction of a long-term care policy rider in 2005. This decrease was partially offset by higher amortization from growth of the in-force block of long-term care insurance and higher terminations in our Medicare supplement product.
Amortization in our life insurance business for 2006 included decreases in our universal life insurance products of $7 million due to an unearned revenue adjustment and $7 million associated with revisions to estimated gross profit assumptions. Amortization for 2005 also included a $10 million adjustment in our universal life product.
Interest expense increased $89 million in our life insurance business primarily attributable to the issuance of additional non-recourse funding obligations and an increase in average variable rates paid on those obligations. This increase was offset by a $6 million reinsurance accounting change in our payment protection business.
Provision for income taxes
The effective tax rate decreased to 33.8% for the year ended December 31, 2006 from 35.8% for the year ended December 31, 2005. This decrease in effective tax rate was primarily attributable to a reduction in excess foreign tax credits, an increase in lower taxed foreign earnings and favorable examination developments in 2006.
2005 vs. 2004
Segment net operating income
The increase in life insurance net income was primarily attributable to growth of the in-force block, lower claims experience and improved universal life insurance investment spreads. The increase in our payment protection insurance net income business was attributable to an increase resulting from growth of our continental European business and $3 million attributable to changes in foreign exchange rates. Net income in our long-term care business benefited from growth of the in-force block, which was more than offset by lower than expected terminations and lower portfolio yields. In addition, our long-term care business benefited from reserve corrections, which were offset in part by strengthening of certain claim reserves.
Revenues
Premiums decreased primarily as a result of a $104 million decrease in the payment protection business. This decrease was due to a decrease of $295 million in the U.K. market partially offset by a $163 million increase in continental Europe and an increase of $29 million attributable to changes in foreign exchange rates. The decrease in the U.K. market was attributable to the continued runoff of low return blocks of business. The increase in continental Europe was attributable to the growth due to new distribution relationships and the growth of consumer lending in those markets. The decrease was partially offset by a $54 million increase in our life insurance business primarily related to growth of the term life insurance in-force blocks and a $36 million increase in our group business that was due to growth of the non-medical in-force blocks. Our long-term care business increased modestly as growth in the in-force block was partially offset by an $83 million decrease attributable to the reinsurance transactions with UFLIC.
The increase in net investment income, which included $2 million due to changes in foreign exchange rates, was primarily the result of an increase in average invested assets, partially offset by declining yields on investments. The increase in average invested assets was primarily the result of new assets backing growth of our long-term care in-force block and an increase related to assets purchased using proceeds from our issuance of non-recourse funding obligations supporting certain term life insurance policies. This increase was partially offset by a decrease of $46 million as a result of a decline in average invested assets related to the reinsurance
101
transactions with UFLIC and a runoff block of payment protection business in Europe. The decrease in weighted average investment yields was attributable to purchases of new assets in an interest rate environment where current market yields are lower than existing portfolio rates as well as investments in floating-rate securities from proceeds of our issuance of non-recourse funding obligations related to our term life insurance capital management strategy.
Benefits and expenses
Benefits and other changes in policy reserves increased primarily due to a $30 million increase in our life business primarily due to growth of term life in-force block and less favorable universal life mortality offset in part by favorable term life mortality, and a $24 million increase in our group business primarily due to growth of the in-force blocks. The increases were partially offset by a $30 million decrease in our payment protection business. The decrease was primarily attributable to a decrease in claims in our runoff business, partially offset by $4 million attributable to changes in foreign exchange rates. Our long-term care business decreased $18 million attributable to a $102 million decrease related to the reinsurance transactions with UFLIC, and a $40 million correction of reserves related to a long-term care policy rider which had been incorrectly coded in our policy valuation system. These decreases were partially offset by an increase of $101 million primarily attributable to lower policy terminations and an increase associated with the aging of the in-force block. Additionally, our long-term care business had a $23 million increase relating to the strengthening of certain claim reserves.
Acquisition and operating expenses, net of deferrals, increased primarily due to a $117 million increase in our payment protection business. This increase was due to an increase in commissions and other expenses in our runoff block and an increase of $11 million attributable to changes in foreign exchange rates. Our long-term care business increased $24 million due to higher non-deferrable acquisition costs partially offset by a $17 million decrease related to the reinsurance transactions with UFLIC. Our life business increased $17 million primarily due to higher non-deferrable acquisition costs related to growth of new business sales.
Amortization of deferred acquisition costs and intangibles decreased primarily due to a $202 million decrease in our payment protection business. This decrease was primarily attributable to our runoff block partially offset by a $12 million increase attributable to changes in foreign exchange rates. Our life business decreased $14 million due to reduced software amortization and less favorable mortality in universal life that contributed to lower amortization. The decreases were partially offset by an $18 million increase in our long-term care primarily attributable to a $27 million increase to correct amortization related to an incorrectly coded long-term care policy rider, partially offset by an $8 million decrease attributable to the reinsurance transactions with UFLIC. Also partially offsetting the decrease was an increase of $9 million in our group business attributable to growth of the in-force block.
Interest expense increased $37 million as the result of an increase in average variable rate yields paid on non-recourse funding obligations supporting our term life insurance capital management strategy and the issuance of additional non-recourse funding obligations in the second and third quarters of 2005.
Provision for income taxes
The effective tax rate decreased to 35.8% for the year ended December 31, 2005 from 36.7% for the year ended December 31, 2004. This decrease in effective tax rate was primarily attributable to a reduction in excess foreign tax credits and a favorable examination development in 2005.
102
Protection selected operating performance measures
Life insurance
The following table sets forth selected operating performance measures regarding our life insurance products as of or for the dates indicated:
| As of or for years ended December 31, |
Increase (decrease) and percentage change |
||||||||||||||||||||||
| (Amounts in millions) |
2006 | 2005 | 2004 | 2006 vs. 2005 | 2005 vs. 2004 | ||||||||||||||||||
| Term life insurance |
|||||||||||||||||||||||
| Net earned premiums |
$ | 876 | $ | 779 | $ | 721 | $ | 97 | 12 | % | $ | 58 | 8 | % | |||||||||
| Annualized first-year premiums |
140 | 138 | 102 | 2 | 1 | % | 36 | 35 | % | ||||||||||||||
| Life insurance in-force, net of reinsurance (face amount) |
429,803 | 379,378 | 329,014 | 50,425 | 13 | % | 50,364 | 15 | % | ||||||||||||||
| Life insurance in-force before reinsurance (face amount) |
595,045 | 540,257 | 481,985 | 54,788 | 10 | % | 58,272 | 12 | % | ||||||||||||||
| Universal and whole life insurance |
|||||||||||||||||||||||
| Net earned premiums and deposits |
$ | 471 | $ | 408 | $ | 373 | $ | 63 | 15 | % | $ | 35 | 9 | % | |||||||||
| Universal life annualized first-year deposits |
41 | 27 | 24 | 14 | 52 | % | 3 | 13 | % | ||||||||||||||
| Universal life excess deposits |
98 | 46 | 18 | 52 | 113 | % | 28 | 156 | % | ||||||||||||||
| Life insurance in-force, net of reinsurance (face amount) |
40,669 | 40,711 | 41,745 | (42 | ) | – | (1,034 | ) | (2 | )% | |||||||||||||
| Life insurance in-force before reinsurance (face amount) |
49,572 | 49,353 | 50,775 | 219 | – | (1,422 | ) | (3 | )% | ||||||||||||||
| Total life insurance |
|||||||||||||||||||||||
| Net earned premiums and deposits |
$ | 1,347 | $ | 1,187 | $ | 1,094 | $ | 160 | 13 | % | $ | 93 | 9 | % | |||||||||
| Annualized first-year premiums |
140 | 138 | 102 | 2 | 1 | % | 36 | 35 | % | ||||||||||||||
| Annualized first-year deposits |
41 | 27 | 24 | 14 | 52 | % | 3 | 13 | % | ||||||||||||||
| Excess deposits |
98 | 46 | 18 | 52 | 113 | % | 28 | 156 | % | ||||||||||||||
| Life insurance in-force, net of reinsurance (face amount) |
470,472 | 420,089 | 370,759 | 50,383 | 12 | % | 49,330 | 13 | % | ||||||||||||||
| Life insurance in-force before reinsurance (face amount) |
644,617 | 598,610 | 532,760 | 46,007 | 8 | % | 65,850 | 12 | % | ||||||||||||||
2006 vs. 2005
Term life insurance. The increase in term life insurance net earned premiums and insurance in-force was primarily due to growth of the in-force block of business as a result of an additional layer of annualized first-year premium from the current and prior year. Annualized first-year premiums were flat as a result of increased price competition and a shift to universal life products by our distribution customers.
Universal and whole life insurance. Universal life annualized first-year deposits increased primarily from a shift from term life products by our distribution customers and new product offerings gaining momentum in the market. The in-force block remained flat mainly as a result of the growth in universal life being offset by the continued runoff on our closed block of whole life insurance.
2005 vs. 2004
Term life insurance. The increase in term life insurance in-force during 2005 was primarily due to net growth of the in-force block as a result of increased competitiveness of our product offerings. This increase was
103
also the primary driver for the increase in term life insurance net earned premiums. Term life annualized first year premiums increased as a result of competitive pricing, our expanded distribution and consistent service performance.
Universal and whole life insurance. Universal life annualized first-year deposits increased during 2005 primarily due to new product offerings acceptance in the market. The 2005 decrease in our in-force was due to lapses and cancellations on a block of single premium universal life insurance policies and the runoff on our closed block of whole life insurance.
Long-term care insurance
The following table sets forth selected operating performance measures regarding our long-term care insurance business, which includes individual and group long-term care insurance, Medicare supplement insurance, as well as several runoff blocks of accident and health insurance and corporate-owned life insurance for the periods indicated:
| For the years ended December 31, |
Increase (decrease) and percentage change |
||||||||||||||||||||
| (Amounts in millions) |
2006 | 2005 | 2004 | 2006 vs. 2005 | 2005 vs. 2004 | ||||||||||||||||
| Net earned premiums: |
|||||||||||||||||||||
| Long-term care |
$ | 1,647 | $ | 1,572 | $ | 1,571 | $ | 75 | 5 | % | $ | 1 | — | % | |||||||
| Medicare supplement and other A&H |
211 | 108 | 101 | 103 | 95 | % | 7 | 7 | % | ||||||||||||
| Total |
$ | 1,858 | $ | 1,680 | $ | 1,672 | $ | 178 | 11 | % | $ | 8 | — | % | |||||||
| Annualized first-year premiums |
202 | 170 | 162 | 32 | 19 | % | 8 | 5 | % | ||||||||||||
2006 vs. 2005
The increase in earned premiums was primarily due to growth in Medicare supplement product premiums driven by the Continental Life acquisition and growth in the individual long-term care block.
The increase in annualized first-year premiums was primarily due to growth in Medicare supplement product sales driven by the Continental Life acquisition and growth in individual long-term care sales primarily from our independent sales channel where we have placed greater focus for our future growth.
2005 vs. 2004
The increase in annualized first-year premiums during 2005 is primarily due to the broadening of our product offering in Medicare supplement and an increase in coverage elections by existing group long-term care participants. Annualized first-year premiums in individual long-term care products remained relatively flat due in part to the continued transition in the long-term care market.
Payment protection insurance
The following table sets forth selected operating performance measures regarding our payment protection insurance and other related consumer protection insurance products for the periods indicated:
| For the years ended December 31, |
Increase (decrease) and percentage change |
||||||||||||||||||||||
| (Amounts in millions) |
2006 | 2005 | 2004 | 2006 vs. 2005 | 2005 vs. 2004 | ||||||||||||||||||
| Payment protection insurance gross written premiums, premium equivalents and deposits |
$ | 2,162 | $ | 1,829 | $ | 1,501 | $ | 333 | 18 | % | $ | 328 | 22 | % | |||||||||
| Mexico operations gross written premiums |
67 | 54 | 49 | 13 | 24 | % | 5 | 10 | % | ||||||||||||||
| Net earned premiums |
1,149 | 1,369 | 1,473 | (220 | ) | (16 | )% | (104 | ) | (7 | )% | ||||||||||||
104
2006 vs. 2005
Gross written premiums, premium equivalents and deposits, gross of coded reinsurance and cancellations, for 2006 includes $164 million of gross deposits on a reciprocal reinsurance transaction, which we accounted for under the deposit method of accounting, and growth from continental Europe and Ireland. The year ended December 31, 2006 included a decrease of $9 million attributable to changes in foreign exchange rates.
Net earned premiums decreased primarily due to continued runoff of low return blocks of business in the U.K. market, the exit from travel insurance and a decrease of $8 million attributable to changes in foreign exchange rates, partially offset by growth in the continental European and Ireland markets.
2005 vs. 2004
Gross written premiums, premium equivalents and deposits, gross of ceded reinsurance and cancellations, increased during 2005 due to growth in the continental European market. Net earned premiums decreased due to continued runoff of low return blocks of business in the U.K. market, partially offset by growth in the continental European and Ireland markets.
Group life and health insurance
The following table sets forth selected operating performance measures regarding our group products for the periods indicated:
| For the years ended December 31, |
Increase (decrease) and percentage change |
||||||||||||||||||||
| (Amounts in millions) |
2006 | 2005 | 2004 | 2006 vs. 2005 | 2005 vs. 2004 | ||||||||||||||||
| Net earned premiums |
$ | 687 | $ | 659 | $ | 623 | $ | 28 | 4 | % | $ | 36 | 6 | % | |||||||
| Annualized first-year premiums |
180 | 174 | 171 | 6 | 3 | % | 3 | 2 | % | ||||||||||||
2006 vs. 2005
The increase in annualized first-year premiums was the result of growth in sales in non-medical products, partially offset by lower sales of medical products due to competitive pricing in that market. Growth in net earned premiums is the result of sales growth predominantly in the non-medical and individual products, partially offset by lapses primarily in medical products.
2005 vs. 2004
The increase in annualized first-year premiums during 2005 is attributable to an increase in sales in the non-medical products, partially offset by lower sales in the medical products due to competitive pricing in that market. Competition in the non-medical market has increased as insurance companies that have historically concentrated on the large case groups have recently begun entering the small case group market, where we primarily compete. This has increased competition and pricing pressure.
Retirement Income and Investments segment
We offer U.S. customers fixed annuities, individual variable annuities, group variable annuities designed for retirement plans, single premium immediate annuities, variable life insurance, specialized products, including GICs, funding agreements and FABNs, and asset management products and services. In 2007, we began offering a GMTN program to target primarily non-U.S. investors.
105
Segment results of operations
The following table sets forth the results of operations relating to our Retirement Income and Investments segment. Prior to our corporate formation, we entered into several significant reinsurance transactions with UFLIC in which we ceded to UFLIC all of our in-force structured settlements contracts and substantially all of our in-force variable annuity contracts. These blocks of business were ceded to UFLIC in connection with our corporate formation on May 24, 2004, and those results are not included in our results after that date. As a result of the foregoing, our results of operations for the years ended December 31, 2006 and 2005 are not comparable to this segment’s results of operations for the year ended December 31, 2004.
| Years ended December 31, | Increase (decrease) and percentage change |
|||||||||||||||||||||||
| (Amounts in millions) |
2006 | 2005 | 2004 | 2006 vs. 2005 | 2005 vs. 2004 | |||||||||||||||||||
| Revenues: |
||||||||||||||||||||||||
| Premiums |
$ | 736 | $ | 855 | $ | 1,094 | $ | (119 | ) | (14 | )% | $ | (239 | ) | (22 | )% | ||||||||
| Net investment income |
1,915 | 1,813 | 1,996 | 102 | 6 | % | (183 | ) | (9 | )% | ||||||||||||||
| Net investment gains (losses) |
(69 | ) | — | — | (69 | ) | NM | (1) | — | — | % | |||||||||||||
| Policy fees and other income |
350 | 244 | 271 | 106 | 43 | % | (27 | ) | (10 | )% | ||||||||||||||
| Total revenues |
2,932 | 2,912 | 3,361 | 20 | 1 | % | (449 | ) | (13 | )% | ||||||||||||||
| Benefits and expenses: |
||||||||||||||||||||||||
| Benefits and other changes in policy reserves |
1,015 | 1,111 | 1,633 | (96 | ) | (9 | )% | (522 | ) | (32 | )% | |||||||||||||
| Interest credited |
1,138 | 1,056 | 1,070 | 82 | 8 | % | (14 | ) | (1 | )% | ||||||||||||||
| Acquisition and operating expenses, net of deferrals |
314 | 259 | 250 | 55 | 21 | % | 9 | 4 | % | |||||||||||||||
| Amortization of deferred acquisition costs and intangibles |
174 | 131 | 170 | 43 | 33 | % | (39 | ) | (23 | )% | ||||||||||||||
| Interest expense |
5 | 3 | 1 | 2 | 67 | % | 2 | 200 | % | |||||||||||||||
| Total benefits and expenses |
2,646 | 2,560 | 3,124 | 86 | 3 | % | (564 | ) | (18 | )% | ||||||||||||||
| Income before income taxes |
286 | 352 | 237 | (66 | ) | (19 | )% | 115 | 49 | % | ||||||||||||||
| Provision for income taxes |
83 | 105 | 84 | (22 | ) | (21 | )% | 21 | 25 | % | ||||||||||||||
| Segment net income |
203 | 247 | 153 | (44 | ) | (18 | )% | 94 | 61 | % | ||||||||||||||
| Adjustments to segment net income: |
||||||||||||||||||||||||
| Net investment (gains) losses, net of taxes and other adjustments |
34 | — | — | 34 | NM | (1) | — | — | % | |||||||||||||||
| Segment net operating income |
$ | 237 | $ | 247 | $ | 153 | (10 | ) | (4 | )% | 94 | 61 | % | |||||||||||
| (1) |
Not meaningful |
The following table sets forth net operating income for the products included in our Retirement Income and Investments segment:
| Years ended December 31, | Increase (decrease) and percentage change |
|||||||||||||||||||||
| (Amounts in millions) |
2006 | 2005 | 2004 | 2006 vs. 2005 | 2005 vs. 2004 | |||||||||||||||||
| Segment net operating income: |
||||||||||||||||||||||
| Spread-based retail products |
$ | 119 | $ | 151 | $ | 79 | $ | (32 | ) | (21 | )% | $ | 72 | 91 | % | |||||||
| Fee-based products |
76 | 59 | 44 | 17 | 29 | % | 15 | 34 | % | |||||||||||||
| Spread-based institutional products |
42 | 37 | 30 | 5 | 14 | % | 7 | 23 | % | |||||||||||||
| Total segment net operating income |
$ | 237 | $ | 247 | $ | 153 | $ | (10 | ) | (4 | )% | $ | 94 | 61 | % | |||||||
106
2006 vs. 2005
Segment net operating income
Segment net operating income from spread-based retail products decreased $32 million primarily due to an increase in DAC amortization resulting from higher lapses on fixed annuities, unfavorable mortality on life-contingent annuities, lower assets under management from withdrawals of older pre-2004 issued blocks of business outpacing new deposits. We continue to experience the runoff of older pre-2004 issued blocks as initial bonus crediting rates are being reset to lower rates. The decrease in net operating income was also the result of lower net investment income in 2006 as a result of bond calls, mortgage loan prepayments, derivative income and less favorable release of our commercial mortgage loan loss provision in 2006.
Segment net operating income from fee-based products increased $17 million principally as a result of growth in assets under management, the acquisition of AssetMark, and income tax benefits from dividends received deductions.
Segment net operating income from spread-based institutional products increased $5 million primarily due to higher spreads and growth in assets under management related to our FABNs, offset by lower net investment income related to bond calls, mortgage loan prepayments, derivative income and less significant adjustments to our commercial mortgage loan loss provision in 2006.
Revenues
The decrease in premiums was primarily the result of a $169 million reduction in our life-contingent structured settlement annuities due to our continued pricing discipline in the current relatively low interest rate environment and our decision in the third quarter of 2006 to discontinue sales of this product. This decrease was partially offset by a $47 million increase in our life-contingent single premium immediate annuities sales from new distribution relationships and increased penetration into key channels.
The increase in net investment income was principally due to increased yields on floating rate investments backing floating rate spread-based institutional products, and higher assets under management. Partially offsetting this increase was lower net investment income related to bond calls and mortgage prepayments of $19 million in 2006 compared to $53 million in 2005, lower derivative income and a less favorable release of our commercial mortgage loan loss provision.
For a discussion of net investment gains (losses), see the comparison for this line item under “—Results of Operations.”
The increase in policy fees and other income was primarily attributable to a $101 million increase in fee-based products as a result of increased sales and growth in assets under management from distribution expansion, favorable equity markets, continued product introduction and enhancements, and $15 million from the acquisition of AssetMark. In addition, surrender fees in our spread-based retail products increased $7 million from higher lapses of SPDAs as a result of the current flat-to-inverted yield curve environment making alternative investments more attractive.
Benefits and expenses
Benefits and other changes in policy reserves decreased primarily as a result of a $150 million decrease in life-contingent structured settlement annuities due to our continued pricing discipline in the current relatively low interest rate environment and our decision in the third quarter of 2006 to discontinue sales of this product. These decreases were partially offset by a $60 million increase in life-contingent single premium immediate annuities driven largely by higher sales. Also partially offsetting the decrease is unfavorable mortality experience, primarily on our older blocks, resulting in lower amounts of reserves released upon deaths in 2006 compared to 2005.
107
The increase in interest credited was principally due to a $129 million increase from spread-based institutional products as a result of higher crediting rates on floating rate products and higher assets under management. This increase was partially offset by a $49 million decrease in interest credited on fixed annuities associated with surrenders outpacing sales and crediting rates being reset to current, lower rates as the fixed annuities reach their initial crediting rate guarantee period.
The increase in acquisition and operating expenses, net of deferrals, was primarily from increased expenses of $68 million associated with higher sales and growth in assets under management in fee-based products. This was partially offset by $11 million of lower expenses associated with our deferred annuities.
The increase in amortization of deferred acquisition costs and intangibles was largely the result of a $45 million increase associated with accelerated amortization and a $12 million unlocking of the lapse assumption in spread-based retail products driven by higher lapses from the current relatively low interest rate environment, offset by a $16 million reduction in DAC amortization attributable to investment losses. Additionally, fee-based products increased by $6 million attributable to growth in assets under management.
Provision for income taxes
The effective tax rate decreased to 29.0% for the year ended December 31, 2006 from 29.8% for the year ended December 31, 2005. This decrease in the effective tax rate was primarily attributable to favorable examination developments and an increase in benefits from dividends received deductions, including a change in prior year estimate, partially offset by an increase in state income taxes.
2005 vs. 2004
Segment net operating income
Segment net operating income from spread-based retail products increased $72 million primarily due to growth in assets under management, improved spreads a $23 million increase primarily attributable to an adjustment to our commercial mortgage loan loss provision, an increase in bond calls and higher derivative income. This increase was also the result of a one-time charge of $32 million (after-tax) in 2004 related to an adjustment of reserving processes related to a small runoff block of equity-indexed annuities. Segment net income on spread-based institutional products increased $7 million primarily due to improved spreads and a $4 million increase in income on derivatives. Segment net income on fee-based products increased $15 million due primarily to growth in assets under management.
Revenues
The decrease in premiums was the result of a $238 million decrease in premiums attributable to lower sales in our life-contingent structured settlement and single premium immediate annuities due to our continued pricing discipline in a continued low long-term interest rate environment.
The decrease in net investment income was primarily attributable to a decline in average invested assets related to reinsurance transactions with UFLIC in 2004 resulting in a $414 million decrease in investment income. This decrease was partially offset by a $113 million increase related to spread-based retail products due primarily to growth in assets under management and a $110 million increase in investment income related to spread-based institutional products due primarily to increased yields on floating rate investments. Included in the spread-based retail and spread-based institutional increases are higher derivative income, an adjustment to our commercial mortgage loan loss provision and higher bond call and mortgage prepayment income totaling $53 million.
The decrease in policy fees and other income was primarily due to a $56 million reduction related to the reinsurance transactions with UFLIC in 2004. This decrease was partially offset by a $29 million increase due primarily to growth in assets under management in fee-based products.
108
Benefits and expenses
Benefits and other changes in policy reserves decreased primarily as a result of a $281 million decrease related to the reinsurance transactions with UFLIC in 2004. This decrease was also the result of a $182 million decrease in structured settlements and single premium immediate annuities due primarily to lower life-contingent sales of these products. Additionally, this decrease was the result of a one-time charge of $41 million in 2004 resulting from an adjustment of the reserving processes of a small runoff block of equity-indexed annuities.
Interest credited decreased primarily due to a $113 million decrease related to the UFLIC reinsurance transactions in 2004. Partially offsetting the decrease was a $94 million increase in interest credited on spread-based institutional products due primarily to higher average interest crediting rates on floating rate products.
The increase in acquisition and operating expenses, net of deferrals, was primarily due to an increase of $30 million in expenses due primarily to increased assets under management on fee-based and spread-based retail products. Partially offsetting the increase was a decrease in costs of $21 million resulting from the UFLIC reinsurance transactions in 2004.
The decrease in amortization of deferred acquisition costs and intangibles was primarily attributable to decreased amortization of $48 million resulting from the UFLIC reinsurance transactions in 2004. Partially offsetting this decrease was an increase of $9 million driven primarily by increased assets under management and improving investment spreads.
Provision for income taxes
The effective tax rate decreased to 29.8% for the year ended December 31, 2005 from 35.4% for the year ended December 31, 2004. This decrease in the effective tax rate was primarily attributable to favorable examination developments in 2005.
109
Retirement Income and Investments selected operating performance measures
Spread-based retail products
The following table sets forth selected operating performance measures regarding our spread-based retail products as of or for the dates indicated:
| As of or for years ended December 31, |
Increase (decrease) and percentage change |
|||||||||||||||||||||||||
| (Amounts in millions) |
2006 | 2005 | 2004 | 2006 vs. 2005 | 2005 vs. 2004 | |||||||||||||||||||||
| Fixed annuities |
||||||||||||||||||||||||||
| Account value net of reinsurance, beginning of period |
$ | 15,547 | $ | 15,113 | $ | 14,166 | $ | 434 | 3 | % | $ | 947 | 7 | % | ||||||||||||
| Deposits |
1,262 | 1,871 | 1,741 | (609 | ) | (33 | )% | 130 | 7 | % | ||||||||||||||||
| Interest credited |
554 | 606 | 600 | (52 | ) | (9 | )% | 6 | 1 | % | ||||||||||||||||
| Surrenders, benefits and product charges |
(3,391 | ) | (2,043 | ) | (1,394 | ) | (1,348 | ) | (66 | )% | (649 | ) | (47 | )% | ||||||||||||
| Account value net of reinsurance, end of period |
$ | 13,972 | $ | 15,547 | $ | 15,113 | $ | (1,575 | ) | (10 | )% | $ | 434 | 3 | % | |||||||||||
| Single premium immediate annuities |
||||||||||||||||||||||||||
| Account value net of reinsurance, beginning of period |
$ | 5,680 | $ | 5,344 | $ | 5,008 | $ | 336 | 6 | % | $ | 336 | 7 | % | ||||||||||||
| Net earned premiums and deposits |
1,103 | 898 | 876 | 205 | 23 | % | 22 | 3 | % | |||||||||||||||||
| Interest credited |
323 | 313 | 305 | 10 | 3 | % | 8 | 3 | % | |||||||||||||||||
| Surrenders, benefits and product charges |
(932 | ) | (875 | ) | (845 | ) | (57 | ) | (7 | )% | (30 | ) | (4 | )% | ||||||||||||
| Account value net of reinsurance, end of period |
$ | 6,174 | $ | 5,680 | $ | 5,344 | $ | 494 | 9 | % | $ | 336 | 6 | % | ||||||||||||
| Structured settlements |
||||||||||||||||||||||||||
| Account value net of reinsurance, beginning of period |
$ | 871 | $ | 533 | $ | 12,017 | $ | 338 | 63 | % | $ | (11,484 | ) | NM | (1) | |||||||||||
| Ceded to UFLIC, effective as of January 1, 2004 |
— | — | (12,017 | ) | — | — | % | 12,017 | NM | (1) | ||||||||||||||||
| Net earned premiums and deposits |
149 | 351 | 544 | (202 | ) | (58 | )% | (193 | ) | (35 | )% | |||||||||||||||
| Interest credited |
53 | 44 | 25 | 9 | 20 | % | 19 | 76 | % | |||||||||||||||||
| Surrenders, benefits and product charges |
(62 | ) | (57 | ) | (36 | ) | (5 | ) | (9 | )% | (21 | ) | (58 | )% | ||||||||||||
| Account value net of reinsurance, end of period |
$ | 1,011 | $ | 871 | $ | 533 | $ | 140 | 16 | % | $ | 338 | 63 | % | ||||||||||||
| Total premiums from spread-based retail products |
$ | 736 | $ | 855 | $ | 1,094 | $ | (119 | ) | (14 | )% | $ | (239 | ) | (22 | )% | ||||||||||
| Total deposits on spread-based retail products |
$ | 1,778 | $ | 2,265 | $ | 2,067 | $ | (487 | ) | (22 | )% | $ | 198 | 10 | % | |||||||||||
| (1) | Not meaningful |
2006 vs. 2005
Fixed annuities. Surrenders have outpaced sales as initial bonus crediting rates have begun to enter their rate reset period resulting in lower crediting rates. In addition, the recent flat-to-inverted yield curve has reduced the attractiveness of certain fixed annuities relative to investment alternatives, such as certificates of deposit. These
110
trends are having an adverse impact on both sales and retention of fixed annuities and we expect these trends to continue if the current yield environment remains unchanged. In recent quarters, we have experienced improved spreads in fixed annuities principally from runoff and crediting rate resets on lower return business.
Single premium immediate annuities. The account value, net of reinsurance, increased primarily due to higher deposits.
Structured settlements. The account value, net of reinsurance, increased primarily as the result of additional earned premiums and deposits. Our continued pricing discipline in a challenging and competitive long-term interest rate environment was the primary cause for lower earned premiums and deposits of these products during 2006. As a result, and upon completion of a strategic review of our structured settlement annuities, we decided in the third quarter of 2006 to discontinue sales of this product based on relative profitability in this market compared to our other product lines. This exit is not expected to have a material impact on current or future income. We will, however, continue to service our current blocks of business.
2005 vs. 2004
Fixed annuities. The account value net of reinsurance increased for 2005 and 2004 primarily due to the interest credited on the account value for each year. During 2005, the flattening of the yield curve resulted in a shift in demand to shorter duration instruments like bank certificates of deposit and money market funds from longer duration products like fixed annuities. Additionally, during 2005, we had several blocks of lower return, high guaranteed rate fixed maturity business mature. As we lowered crediting rates, we experienced a higher than historical level of surrenders. We expect this trend to continue in 2006 and 2007. To date, these surrender levels have been at or near our expected levels.
Single premium immediate annuities. The account value net of reinsurance increased for 2005 primarily due to the interest credited on the account value for each year.
Structured settlements. Effective January 1, 2004, we ceded to UFLIC all of our structured settlements in-force as of December 31, 2003. We continued to write structured settlements in 2004 and 2005 to the extent that we were able to achieve our targeted returns. Our continued pricing discipline in the low long-term interest rate environment was the primary reason for the lower sales of these products during 2005 and 2004.
Spread-based institutional products
The following table sets forth selected operating performance measures regarding our spread-based institutional products as of or for the dates indicated:
| As of or for years ended December 31, |
Increase (decrease) and percentage change |
|||||||||||||||||||||||||
| (Amounts in millions) |
2006 | 2005 | 2004 | 2006 vs. 2005 | 2005 vs. 2004 | |||||||||||||||||||||
| Account value, beginning of period |
$ | 9,777 | $ | 9,541 | $ | 9,527 | $ | 236 | 2 | % | $ | 14 | — | % | ||||||||||||
| Deposits(1) |
3,125 | 3,699 | 3,056 | (574 | ) | (16 | )% | 643 | 21 | % | ||||||||||||||||
| Interest credited |
504 | 375 | 281 | 129 | 34 | % | 94 | 33 | % | |||||||||||||||||
| Surrenders and benefits(1) |
(2,923 | ) | (3,838 | ) | (3,323 | ) | 915 | 24 | % | (515 | ) | (16 | )% | |||||||||||||
| Account value, end of period |
$ | 10,483 | $ | 9,777 | $ | 9,541 | $ | 706 | 7 | % | $ | 236 | 2 | % | ||||||||||||
| (1) | “Surrenders and benefits” include contracts that have matured but are redeposited with us and reflected as deposits. In the years ended December 31, 2006, 2005 and 2004, surrenders and deposits included $475 million, $1,378 million and $927 million, respectively, that was redeposited and reflected under “Deposits.” |
111
2006 vs. 2005
The increase in account values was primarily the result of the launch of the FABN registered note program and increases in interest credited offset by scheduled maturities of GICs. The FABN registered notes program was launched in the fourth quarter of 2005. This program resulted in an issuance of $300 million of FABNs in 2005 and $2,250 million during 2006. The increase in interest credited was driven by higher crediting rates on our floating rate products largely due to an increase in short-term interest rates.
2005 vs. 2004
Spread-based institutional account values remained fairly consistent in 2005 as we maintained our pricing discipline in order to achieve our targeted returns. Included in deposits is a $300 million funding agreement we issued in the fourth quarter of 2005 from a registered notes program we initiated. The increase in interest credited in 2005 was due to an increase in crediting rates on our floating rate products due to an increase in the short-term rates.
Fee-based products
The following table sets forth selected operating performance measures regarding our fee-based products as of or for the dates indicated:
| As of or for years ended December 31, |
Increase (decrease) and percentage change |
|||||||||||||||||||||||||
| (Amounts in millions) |
2006 | 2005 | 2004 | 2006 vs. 2005 | 2005 vs. 2004 | |||||||||||||||||||||
| Income Distribution Series(1) |
||||||||||||||||||||||||||
| Account value, net of reinsurance, beginning of period |
$ | 911 | $ | 462 | $ | 202 | $ | 449 | 97 | % | $ | 260 | 129 | % | ||||||||||||
| Deposits |
1,376 | 456 | 250 | 920 | NM | (2) | 206 | 82 | % | |||||||||||||||||
| Interest credited and investment performance |
227 | 23 | 16 | 204 | NM | (2) | 7 | 44 | % | |||||||||||||||||
| Surrenders, benefits and product charges |
(112 | ) | (30 | ) | (6 | ) | (82 | ) | NM | (2) | (24 | ) | NM | (2) | ||||||||||||
| Account value, net of reinsurance, end of period |
$ | 2,402 | $ | 911 | $ | 462 | $ | 1,491 | 164 | % | $ | 449 | 97 | % | ||||||||||||
| Traditional variable annuities |
||||||||||||||||||||||||||
| Account value, net of reinsurance, beginning of period |
$ | 1,182 | $ | 632 | $ | 10,702 | $ | 550 | 87 | % | $ | (10,070 | ) | 94 | % | |||||||||||
| Ceded to UFLIC, effective January 1, 2004 |
— | — | (10,686 | ) | — | — | % | 10,686 | NM | (2) | ||||||||||||||||
| Deposits |
510 | 548 | 589 | (38 | ) | (7 | )% | (41 | ) | (7 | )% | |||||||||||||||
| Interest credited and investment performance |
217 | 83 | 61 | 134 | 161 | % | 22 | 36 | % | |||||||||||||||||
| Surrenders, benefits and product charges |
(129 | ) | (81 | ) | (34 | ) | (48 | ) | (59 | )% | (47 | ) | 138 | % | ||||||||||||
| Account value, net of reinsurance, end of period |
$ | 1,780 | $ | 1,182 | $ | 632 | $ | 598 | 51 | % | $ | 550 | 87 | % | ||||||||||||
| Variable life insurance |
||||||||||||||||||||||||||
| Account value, beginning of period |
$ | 363 | $ | 345 | $ | 313 | $ | 18 | 5 | % | $ | 32 | 10 | % | ||||||||||||
| Deposits |
30 | 34 | 40 | (4 | ) | (12 | )% | (6 | ) | (15 | )% | |||||||||||||||
| Interest credited and investment performance |
46 | 27 | 41 | 19 | 70 | % | (14 | ) | (34 | )% | ||||||||||||||||
| Surrenders, benefits and product charges |
(48 | ) | (43 | ) | (49 | ) | (5 | ) | (12 | )% | 6 | 12 | % | |||||||||||||
| Account value, end of period |
$ | 391 | $ | 363 | $ | 345 | $ | 28 | 8 | % | $ | 18 | 5 | % | ||||||||||||
| Managed money |
||||||||||||||||||||||||||
| Account value, beginning of period |
$ | 5,180 | $ | 3,974 | $ | 3,147 | $ | 1,206 | 30 | % | $ | 827 | 26 | % | ||||||||||||
| Acquisition of AssetMark |
9,110 | — | — | 9,110 | NM | (2) | — | — | % | |||||||||||||||||
| Deposits |
3,044 | 1,603 | 1,143 | 1,441 | 90 | % | 460 | 40 | % | |||||||||||||||||
| Interest credited and investment performance |
945 | 185 | 258 | 760 | NM | (2) | (73 | ) | (28 | )% | ||||||||||||||||
| Surrenders, benefits and product charges |
(986 | ) | (582 | ) | (574 | ) | (404 | ) | 69 | % | (8 | ) | (1 | )% | ||||||||||||
| Account value, end of period |
$ | 17,293 | $ | 5,180 | $ | 3,974 | $ | 12,113 | 234 | % | $ | 1,206 | 30 | % | ||||||||||||
| (1) | The Income Distribution Series are comprised of our retirement income and annuity products and variable annuity riders that provide similar income features. |
| (2) | Not meaningful |
112
2006 vs. 2005
Income Distribution Series. We experienced an increase in assets under management attributable to the launch of our guaranteed minimum withdrawal for life benefit rider in the fourth quarter of 2005. Sales of this product remained strong during 2006, achieving the highest quarterly production to date in the fourth quarter of 2006.
Traditional variable annuities. The increase in assets under management was principally the result of ongoing sales of our traditional variable annuity products and favorable equity markets during 2005 and 2006.
Managed money. Managed money includes third-party assets managed by Genworth Financial Asset Management, AssetMark and Genworth Financial Advisers. The increase in these assets was primarily due to the acquisition of AssetMark and core growth in managed money accounts from new and existing clients, as well as favorable equity market performance. Additional growth in deposits was the result of the expansion of our distribution network, growth in our sales force, and changes in our fee structure. We acquired AssetMark, an investment management and advisor company with more than $9 billion in third-party assets under management in October 2006.
2005 vs. 2004
Effective January 1, 2004, we ceded to UFLIC substantially all of our variable annuities in-force as of December 31, 2003. During 2005, we experienced an increase in variable annuity deposits driven by additional product features introduced during the year.
Third-party asset management deposits increased during 2005 due primarily to increased sales to new and existing clients. This increase was the result of the expansion of our wholesalers as well as the growth in our sales force of financial professionals from approximately 2,000 in 2004 to approximately 2,400 in 2005.
Mortgage Insurance segment
In the U.S., Canada, Australia, Europe, New Zealand, Mexico and Japan, we offer mortgage insurance products that facilitate homeownership by enabling borrowers to buy homes with low-down-payment mortgages. Additionally, we offer mortgage related services for our financial services customers. These products generally also aid financial institutions in managing their capital efficiently by reducing the capital required for low down-payment mortgages.
113
Segment results of operations
The following table sets forth the results of operations relating to our Mortgage Insurance segment.
| Years ended December 31, | Increase (decrease) and percentage change |
|||||||||||||||||||||||
| (Amounts in millions) |
2006 | 2005 | 2004 | 2006 vs. 2005 | 2005 vs. 2004 | |||||||||||||||||||
| Revenues: |
||||||||||||||||||||||||
| Premiums |
$ | 1,132 | $ | 882 | $ | 800 | $ | 250 | 28 | % | $ | 82 | 10 | % | ||||||||||
| Net investment income |
341 | 287 | 254 | 54 | 19 | % | 33 | 13 | % | |||||||||||||||
| Net investment gains (losses) |
7 | — | — | 7 | NM | (1) | — | — | % | |||||||||||||||
| Policy fees and other income |
31 | 45 | 36 | (14 | ) | (31 | )% | 9 | 25 | % | ||||||||||||||
| Total revenues |
1,511 | 1,214 | 1,090 | 297 | 24 | % | 124 | 11 | % | |||||||||||||||
| Benefits and expenses: |
||||||||||||||||||||||||
| Benefits and other changes in policy reserves |
293 | 162 | 165 | 131 | 81 | % | (3 | ) | (2 | )% | ||||||||||||||
| Acquisition and operating expenses, net of deferrals |
296 | 289 | 262 | 7 | 2 | % | 27 | 10 | % | |||||||||||||||
| Amortization of deferred acquisition costs and intangibles |
61 | 56 | 51 | 5 | 9 | % | 5 | 10 | % | |||||||||||||||
| Total benefits and expenses |
650 | 507 | 478 | 143 | 28 | % | 29 | 6 | % | |||||||||||||||
| Income before income taxes |
861 | 707 | 612 | 154 | 22 | % | 95 | 16 | % | |||||||||||||||
| Provision for income taxes |
243 | 200 | 186 | 43 | 22 | % | 14 | 8 | % | |||||||||||||||
| Segment net income |
618 | 507 | 426 | 111 | 22 | % | 81 | 19 | % | |||||||||||||||
| Adjustments to segment net income: |
||||||||||||||||||||||||
| Net investment (gains) losses, net of taxes and other adjustments |
(4 | ) | — | — | (4 | ) | NM | (1) | — | — | % | |||||||||||||
| Segment net operating income |
$ | 614 | $ | 507 | $ | 426 | $ | 107 | 21 | % | $ | 81 | 19 | % | ||||||||||
| (1) |
Not meaningful |
The following table sets forth net operating income for the products included in our Mortgage Insurance segment:
| Years ended December 31, | Increase (decrease) and percentage change |
||||||||||||||||||||
| (Amounts in millions) |
2006 | 2005 | 2004 | 2006 vs. 2005 | 2005 vs. 2004 | ||||||||||||||||
| Segment net operating income: |
|||||||||||||||||||||
| U.S. mortgage insurance |
$ | 259 | $ | 238 | $ | 224 | $ | 21 | 9 | % | $ | 14 | 6 | % | |||||||
| International mortgage insurance |
355 | 269 | 202 | 86 | 32 | % | 67 | 33 | % | ||||||||||||
| Total segment net operating income |
$ | 614 | $ | 507 | $ | 426 | $ | 107 | 21 | % | $ | 81 | 19 | % | |||||||
2006 vs. 2005
Segment net operating income
Our U.S. mortgage insurance business net operating income increased $21 million as a result of lower expenses, increased premiums, higher net investment income and an increase of $15 million from our intra-segment reinsurance and capital maintenance arrangement with our international mortgage insurance business. This was partially offset by an increase in losses and a higher effective tax rate.
Our international mortgage insurance business net operating income increased $86 million, including $13 million, net of tax, attributable to changes in foreign exchange rates, driven by growth of the business, seasoning of our insurance in-force, and a decrease in the effective tax rate. These were partially offset by an increase in
114
losses from portfolio seasoning and higher losses from a limited number of Australian distribution relationships, as well as expenses related to the continued investment in our global expansion. The year ended December 31, 2006 included a $15 million, net of tax, benefit from a periodic update of international mortgage insurance premium recognition factors and Australian loss reserve factors.
Revenues
Our international mortgage insurance premiums increased by $211 million, $19 million of which was attributable to changes in foreign exchange rates, driven by the growth and aging of our international in-force block of business. The increase included a $60 million release of unearned premium in the fourth quarter of 2006 as a result of a periodic update and methodology refinements to the Australian and Canadian premium recognition factors. Premiums in 2005 included a $10 million release of unearned premium in the first quarter due to the completion of a European cancellation study. The increase in our U.S. mortgage insurance business of $39 million was primarily attributable to an increase of $19 million from premiums assumed from our international mortgage insurance business through our intra-segment reinsurance and capital maintenance arrangement as well as growth in primary insurance in-force.
The increase in net investment income, which included an increase of $6 million attributable to changes in foreign exchange rates, was largely the result of an increase in invested assets associated with the growth of our international mortgage insurance business and increased yield resulting from our yield-enhancing strategies in the investment portfolio of our U.S. mortgage insurance business.
Policy fees and other income decreased by $14 million primarily due to lower contract underwriting fees in our U.S. mortgage insurance business and the elimination of Canadian application fees in our international mortgage insurance business.
Benefits and expenses
Our international mortgage insurance benefits and other changes in policy reserves increased $107 million, including a $3 million increase attributable to changes in foreign exchange rates. This increase was primarily driven by a $34 million increase from a periodic update of loss reserve factors in Australia, higher losses in Australia reflecting the seasoning of more recent in-force blocks of business, increased losses from a limited number of Australian distribution relationships and $9 million of favorable adjustments in 2005 that did not recur. The increase in our U.S. mortgage insurance business of $24 million was primarily attributable to an increase in our average reserve per delinquency associated with higher loan balances in more recent books of business and aging of delinquent loans. This was partially offset by $10 million in paid claims favorability and a decrease in reserves for severely impacted areas associated with Hurricanes Katrina and Rita.
Acquisition and operating expenses, net of deferrals decreased in our U.S. mortgage insurance business primarily driven by continued productivity initiatives and other expense reductions and lower contract underwriting volume. Acquisition and operating expenses, net of deferrals in our international mortgage insurance business increased as a result of continued investment in our existing international mortgage insurance platforms and potential new international platforms as well as a $3 million increase attributable to changes in foreign exchange rates.
Amortization of deferred acquisition costs and intangibles increased $5 million primarily due to growth and seasoning of our insurance in-force in our international mortgage insurance business and $3 million associated with a periodic update and methodology refinements to the Australian premium recognition factors. This was partially offset by an acceleration of amortization of deferred acquisition costs in 2005 related to low persistency rates in our U.S. mortgage insurance business that did not recur in 2006.
Provision for income taxes
Provision for income taxes increased $43 million, which included a $6 million increase attributable to changes in foreign exchange rates. The effective tax rate decreased to 28.2% for the year ended December 31,
115
2006 from 28.3% for the year ended December 31, 2005. This decrease in effective tax rate was primarily attributable to the reduction in excess foreign tax credits and the increase in lower taxed foreign earnings, largely offset by nonrecurring favorable examination developments in 2005 and a decrease in tax-exempt investment income in proportion to pretax income.
2005 vs. 2004
Segment net operating income
The increase in our U.S. mortgage insurance business net operating income of $14 million was driven primarily by an increase in contract underwriting fees, a reduction in losses, $10 million of additional operating income related to intra-segment reinsurance and capital maintenance agreements with our international mortgage insurance business and a lower effective tax rate primarily due to favorable tax examination developments. Partially offsetting these items was a decline in premiums earned due to the runoff of insurance in-force. The increase in our international mortgage insurance business operating income of $67 million, including $18 million due to changes in foreign exchange rates, was driven primarily by the growth of the business and seasoning of our insurance in-force, offset partially by continued investments in our global expansion. Also included in international operating income was $6 million after-tax as a result of the release of unearned premium reserves on our single premium product relating to the completion of an European cancellation study in the first quarter of 2005, $6 million after-tax decrease in losses due to an adjustment to paid claims and a reserve factor update and the impact of increased reinsurance premiums ceded to our U.S. mortgage business.
Revenues
In our international mortgage insurance business, premiums increased by $95 million, including $26 million due to changes in foreign exchange rates, driven by the growth and aging of our international in-force block, which resulted in increased earned premiums from new insurance written in prior years. Included in our international premiums was $10 million related to the release of unearned premium reserves on our single premium product due to the completion of a European cancellation study in the first quarter of 2005 and the impact of increased premiums ceded to our U.S. business of $12 million due to a reinsurance support agreement. The increase in international premiums was offset, in part, by a $13 million decrease in U.S. mortgage insurance premiums as a result of the continued decline in our in-force block due to an excess of policy cancellations over new insurance written. Also included in our U.S. premiums was the impact of increased international reinsurance premiums assumed.
The increase in net investment income, which included $9 million due to changes in foreign exchange rates, was primarily the result of an increase in invested assets associated with the growth of our international business.
The increase in policy fees and other income was primarily attributable to increased fees for contract underwriting services in our U.S. mortgage insurance business.
Benefits and expenses
Benefits and other changes in policy reserves decreased primarily due to a $10 million decline in losses in our U.S. mortgage insurance business, primarily driven by favorable developments in reserves per delinquency. Included in the year ended December 31, 2006, was a favorable adjustment to reserves on our prime bulk business of $5 million offset by an increase in losses for severely impacted areas associated with Hurricanes Katrina and Rita of $5 million. The reserve impact associated with Hurricanes Katrina and Rita was based on preliminary estimates from available information and may be affected by factors such as the pace of economic recovery in the affected areas. Accordingly, this reserve may change as new information becomes available. The U.S. decline was partially offset by a $7 million increase in our international mortgage business, $3 million of which was attributable to changes in foreign exchange rates. The international increase was primarily due to in-force growth and normal seasoning offset by a $9 million decrease in losses resulting primarily from favorable loss development as a result of updating loss development factors.
116
Acquisition and operating expenses increase was primarily attributable to an increase in costs in our existing international platforms, continued investment in potential new international mortgage insurance platforms and $5 million from changes in foreign exchange rates.
The increase in amortization of deferred acquisition cost and intangibles was primarily attributable to accelerated amortization of deferred acquisition costs in our U.S. mortgage insurance business principally related to continued low persistency rates during the year.
Provision for income taxes
Provision for income taxes increased $14 million, $9 million of which was attributable to changes in foreign exchange rates. The effective tax rate decreased to 28.3% for the year ended December 31, 2005 from 30.4% for the year ended December 31, 2004. This decrease in effective tax rate was primarily attributable to a favorable examination development and a reduction in excess foreign tax credits. Our Mortgage Insurance segment’s effective tax rate is below the statutory rate primarily as a result of tax-exempt investment income.
Mortgage Insurance selected operating performance measures
The following tables set forth selected operating performance measures regarding our U.S. and international mortgage businesses as of or for the dates indicated:
| As of or for the years ended December 31, |
Increase (decrease) and percentage change |
|||||||||||||||||||||
| (Amounts in millions) |
2006 | 2005 | 2004 | 2006 vs. 2005 | 2005 vs. 2004 | |||||||||||||||||
| Primary insurance in-force: |
||||||||||||||||||||||
| U.S. mortgage insurance |
$ | 113,400 | $ | 100,200 | $ | 108,900 | $ | 13,200 | 13 | % | $ | (8,700 | ) | (8 | )% | |||||||
| International mortgage insurance |
332,000 | 244,200 | 192,600 | 87,800 | 36 | % | 51,600 | 27 | % | |||||||||||||
| Total primary insurance in-force |
$ | 445,400 | $ | 344,400 | $ | 301,500 | $ | 101,000 | 29 | % | $ | 42,900 | 14 | % | ||||||||
| Risk in force: |
||||||||||||||||||||||
| U.S. mortgage insurance |
$ | 23,700 | $ | 22,300 | $ | 23,700 | $ | 1,400 | 6 | % | $ | (1,400 | ) | (6 | )% | |||||||
| International mortgage insurance |
106,300 | 79,000 | 62,000 | 27,300 | 35 | % | 17,000 | 27 | % | |||||||||||||
| Total risk in-force |
$ | 130,000 | $ | 101,300 | $ | 85,700 | $ | 28,700 | 28 | % | $ | 15,600 | 18 | % | ||||||||
| Net premiums written: |
||||||||||||||||||||||
| U.S. mortgage insurance |
$ | 493 | $ | 444 | $ | 453 | $ | 49 | 11 | % | $ | (9 | ) | (2 | )% | |||||||
| International mortgage insurance |
1,041 | 720 | 620 | 321 | 45 | % | 100 | 16 | % | |||||||||||||
| Total net premiums written |
$ | 1,534 | $ | 1,164 | $ | 1,073 | $ | 370 | 32 | % | $ | 91 | 8 | % | ||||||||
| Net premiums earned: |
||||||||||||||||||||||
| U.S. mortgage insurance |
$ | 486 | $ | 447 | $ | 460 | $ | 39 | 9 | % | $ | (13 | ) | (3 | )% | |||||||
| International mortgage insurance |
646 | 435 | 340 | 211 | 49 | % | 95 | 28 | % | |||||||||||||
| Total net premium earned |
$ | 1,132 | $ | 882 | $ | 800 | $ | 250 | 28 | % | $ | 82 | 10 | % | ||||||||
| New insurance written: |
||||||||||||||||||||||
| U.S. mortgage insurance |
$ | 38,800 | $ | 26,800 | $ | 28,100 | $ | 12,000 | 45 | % | $ | (1,300 | ) | (5 | )% | |||||||
| International mortgage insurance |
96,400 | 78,500 | 51,800 | 17,900 | 23 | % | 26,700 | 52 | % | |||||||||||||
| Total new insurance written |
$ | 135,200 | $ | 105,300 | $ | 79,900 | $ | 29,900 | 28 | % | $ | 25,400 | 32 | % | ||||||||
117
2006 vs. 2005
Primary insurance in-force and risk in-force
The increases in primary insurance in-force and risk in-force were driven primarily by new insurance written in our international mortgage insurance business as we continue to execute our global expansion strategy and from higher policy persistency combined with new insurance written in our U.S. mortgage insurance business. Our U.S. flow persistency was 73% and 65% for the years ended December 31, 2006 and 2005, respectively. We believe that sustained higher interest rates, increased persistency and our ongoing growth strategy will lead to stable to growing levels of insurance in-force. Primary insurance in-force in our U.S. mortgage insurance business increased from $100 billion as of December 31, 2005 to $113 billion as of December 31, 2006. This increase in primary insurance in-force reflects an increase in our bulk product writings and the first year-over-year increase in flow insurance in-force in 5 years.
Our businesses in Australia, New Zealand and Canada currently provide 100% coverage on the majority of the loans we insure in those markets. For the purpose of representing our risk in-force, we have computed an “effective risk in-force” amount, which recognizes that the loss on any particular loan will be reduced by the net proceeds received upon sale of the property. Effective risk in-force has been calculated by applying to insurance in-force a factor that represents our highest expected average per-claim payment for any one underwriting year over the life of our businesses in Australia, New Zealand and Canada. For the years ended December 31, 2006 and 2005, this factor was 35%.
Net premiums written
For the year ended December 31, 2006, the increase in net premiums written was primarily due to increases in new insurance written in our international mortgage insurance business. The increase in our international business, which included an increase of $29 million attributable to changes in foreign exchange rates, was primarily the result of new insurance written growth in our Canadian and European businesses. The increase in net premiums written in our U.S. mortgage insurance business of $49 million was principally from increased reinsurance premiums assumed from our international mortgage insurance business, growth in primary insurance in-force and higher sales of our single premium product.
Most of our international mortgage insurance policies provide for single premiums at the time that loan proceeds are advanced. We initially record the single premiums to unearned premium reserves and recognize the premiums earned over time in accordance with the expected pattern of risk emergence. As of December 31, 2006, our unearned premium reserves in our international mortgage insurance business increased to $2.3 billion from $1.8 billion as of December 31, 2005.
New insurance written
For the year ended December 31, 2006, the increase in new insurance written was driven by both our U.S. and international mortgage insurance businesses. International new insurance written increased $17.9 billion, which included an increase of $1.4 billion attributable to changes in foreign exchange rates. The increase in international new insurance written was primarily due to growth in international flow new insurance written which was the result of the ongoing expansion of our customer base in Europe, continued account penetration in Canada, and strong sales by key customers in Australia. U.S. new insurance written increased $12.0 billion primarily due to an increase in our bulk product writings and a modest increase in flow new insurance written.
118
2005 vs. 2004
Primary insurance in-force and risk in-force
The increase in primary insurance in-force and risk in-force during 2005 was driven primarily by new insurance written in our international business, as we continue to execute our global expansion strategy. Offsetting strong international increases in insurance in-force and risk in-force was a decline in our U.S. business. This decline was driven by continued low persistency rates, which have caused policy cancellations to exceed new insurance written.
Our businesses in Australia, New Zealand and Canada currently provide 100% coverage on the majority of the loans we insure in those markets. For the purpose of representing our risk in-force, we have computed an “effective risk in-force” amount, which recognizes that the loss on any particular loan will be reduced by the net proceeds received upon sale of the property. Effective risk in-force has been calculated by applying to insurance in-force a factor that represents our highest expected average per-claim payment for any one underwriting year over the life of our businesses in Australia, New Zealand and Canada. For the years 2004 through 2005, this factor was 35%.
Net premiums written
The increase in net premiums written during 2005 was driven primarily by increases in new insurance written in our international business, partially offset by a decline in our U.S. net premiums written due to lower levels of insurance in-force. The increase in our international business during 2005 of $100 million, which includes $43 million of favorable foreign exchange movements, was primarily driven by new insurance written growth in our Australian and European businesses.
New insurance written
The increase in new insurance written during 2005 was driven by our international business. International new insurance written increased $26,700 million, which included $3,900 million of favorable foreign exchange movements, as a result of ongoing expansion of our customer base, continued account penetration and the selective expansion of our prime bulk product. Partially offsetting the international increase was a decline in U.S. new insurance written, which was driven entirely by lower new insurance written from our prime bulk product. Excluding the impact of bulk, our U.S. flow new insurance written increased 3% driven entirely by strong customer penetration.
Loss and expense ratios
| As of or for the years ended December 31, |
Increase (decrease) | ||||||||||||||
| 2006 | 2005 | 2004 | 2006 vs. 2005 | 2005 vs. 2004 | |||||||||||
| Loss ratio: |
|||||||||||||||
| U.S. mortgage insurance |
29 | % | 26 | % | 28 | % | 3 | % | (2 | )% | |||||
| International mortgage insurance |
24 | % | 10 | % | 11 | % | 14 | % | (1 | )% | |||||
| Total loss ratio |
26 | % | 18 | % | 21 | % | 8 | % | (3 | )% | |||||
| Expense ratio: |
|||||||||||||||
| U.S. mortgage insurance |
32 | % | 44 | % | 43 | % | (12 | )% | 1 | % | |||||
| International mortgage insurance |
19 | % | 21 | % | 19 | % | (2 | )% | 2 | % | |||||
| Total expense ratio |
23 | % | 30 | % | 29 | % | (7 | )% | 1 | % | |||||
The loss ratio is the ratio of incurred losses and loss adjustment expense to net premiums earned.
The expense ratio is the ratio of general expenses to net premiums written. In our business, general expenses consist of acquisition and operating expenses, net of deferrals, and amortization of deferred acquisition cost and intangibles.
119
2006 vs. 2005
For the year ended December 31, 2006, our U.S. loss ratio increased 3 percentage points primarily driven by an increase in our average reserve per delinquency associated with higher loan balances in more recent books of business and aging of delinquent loans. The international loss ratio increased 14 percentage points principally from higher losses in Australia reflecting the seasoning of more recent in-force blocks of business and increased losses from a limited number of Australian distribution relationships.
During the fourth quarter of 2006, we performed a periodic update of our Australian loss reserve factors as well as our Australian and Canadian premium recognition factors. These updates also included certain methodology refinements. The effect of this update was to increase our reserve for losses in Australia by $34 million and to accelerate the recognition of earned premium in Canada and Australia by $60 million in total. Excluding the effect of these updates, our international loss ratio was 20% in 2006.
For the year ended December 31, 2006, the decrease in the expense ratio was primarily driven by continued productivity improvements and other expense reductions in our U.S. mortgage insurance business and strong net premiums written growth in our international mortgage insurance business, partially offset by an increase in costs in our existing international platforms and continued investment in potential new international mortgage insurance platforms.
2005 vs. 2004
During 2005, our loss ratio declined primarily due to loss favorability in our U.S. business and favorable reserve adjustments as a result of updating our loss development factors in our international business. Our international loss ratio, without the impact of favorable adjustments in 2005, would have increased modestly as a result of in-force growth and normal seasoning.
The increase in our 2005 expense ratio was primarily driven by our global expansion strategy as we continue to make investments in our current platforms and new markets. The U.S. expense ratio in 2005 has increased as a result of accelerated amortization of deferred acquisition costs, due to continued low persistency throughout the year.
120
U.S. Mortgage insurance loan portfolio
The following table sets forth selected financial information regarding our U.S. primary mortgage insurance loan portfolio as of the dates indicated:
| December 31, | |||||||||
| (Dollar amounts in millions) |
2006 | 2005 | 2004 | ||||||
| Primary risk-in-force lender concentration (by original applicant) |
$ | 23,267 | $ | 21,738 | $ | 22,969 | |||
| Top 10 lenders |
8,829 | 8,608 | 9,755 | ||||||
| Top 20 lenders |
11,456 | 10,983 | 11,938 | ||||||
| Loan-to-value ratio |
|||||||||
| 95.01% and above |
$ | 5,378 | $ | 4,105 | $ | 3,601 | |||
| 90.01% to 95.00% |
8,141 | 8,362 | 9,450 | ||||||
| 80.01% to 90.00% |
9,028 | 8,859 | 9,555 | ||||||
| 80.00% and below |
720 | 412 | 363 | ||||||
| Total |
$ | 23,267 | $ | 21,738 | $ | 22,969 | |||
| Loan grade |
|||||||||
| Prime |
$ | 20,670 | $ | 19,482 | $ | 20,704 | |||
| A minus and sub-prime |
2,597 | 2,256 | 2,265 | ||||||
| Total |
$ | 23,267 | $ | 21,738 | $ | 22,969 | |||
| Loan type(1) |
|||||||||
| Fixed rate mortgage |
$ | 21,729 | $ | 20,325 | $ | 21,492 | |||
| Adjustable rate mortgage |
1,538 | 1,413 | 1,477 | ||||||
| Total |
$ | 23,267 | $ | 21,738 | $ | 22,969 | |||
| Type of documentation |
|||||||||
| Alt A |
$ | 1,517 | $ | 1,104 | $ | 633 | |||
| Standard |
21,750 | 20,634 | 22,336 | ||||||
| Total |
$ | 23,267 | $ | 21,738 | $ | 22,969 | |||
| Mortgage term |
|||||||||
| 15 years and under |
$ | 441 | $ | 737 | $ | 1,163 | |||
| More than 15 years |
22,826 | 21,001 | 21,806 | ||||||
| Total |
$ | 23,267 | $ | 21,738 | $ | 22,969 | |||
| (1) | For loan type in this table, any loan with an interest rate that is fixed for an initial term of five years or more is categorized as a fixed rate mortgage. |
Loans in default and claims
Our default management process begins with notification by the loan servicer of a default on an insured loan. “Default” is defined in our master policies as the borrower’s failure to pay when due an amount equal to the scheduled monthly mortgage payment under the terms of the mortgage. Generally, the master policies require an insured to notify us of a default no later than ten days after the borrower has been in default by three monthly payments. In most cases, however, defaults are reported earlier. We generally consider a loan to be in default and establish reserves if the borrower has failed to make a required mortgage payment. Borrowers default for a variety of reasons, including a reduction of income, unemployment, divorce, illness, inability to manage credit and interest rate levels. Borrowers may cure defaults by making all of the delinquent loan payments or by selling the property in full satisfaction of all amounts due under the mortgage. In most cases, defaults that are not cured result in a claim under our policy.
121
The following table sets forth the number of loans insured, the number of loans in default and the default rate for our U.S. mortgage insurance portfolio:
| December 31, | |||||||||
| 2006 | 2005 | 2004 | |||||||
| Primary Insurance |
|||||||||
| Insured loans in-force |
778,311 | 744,970 | 830,688 | ||||||
| Loans in default |
24,296 | 27,391 | 28,467 | ||||||
| Percentage of loans in default (default rate) |
3.1 | % | 3.7 | % | 3.4 | % | |||
| Flow loans in-force |
638,833 | 643,954 | 719,533 | ||||||
| Flow loans in default |
22,966 | 26,163 | 26,737 | ||||||
| Percentage of flow loans in default (default rate) |
3.6 | % | 4.1 | % | 3.7 | % | |||
| Bulk loans in-force |
139,478 | 101,016 | 111,155 | ||||||
| Bulk loans in default |
1,330 | 1,228 | 1,730 | ||||||
| Percentage of bulk loans in default (default rate) |
1.0 | % | 1.2 | % | 1.6 | % | |||
| A minus and sub-prime loans in-force |
75,234 | 67,514 | 69,817 | ||||||
| A minus and sub-prime loans in default |
7,258 | 7,072 | 7,068 | ||||||
| Percentage of A minus and sub-prime loans in default (default rate) |
9.6 | % | 10.5 | % | 10.1 | % | |||
| Pool Insurance |
|||||||||
| Insured loans in-force |
21,597 | 19,524 | 25,303 | ||||||
| Loans in default |
402 | 597 | 777 | ||||||
| Percentage of loans in default (default rate) |
1.9 | % | 3.1 | % | 3.1 | % | |||
Primary insurance default rates differ from region to region in the U.S. at any one time depending upon economic conditions and cyclical growth patterns. The two tables below set forth our primary default rates for the various regions of the U.S. and the ten largest states by our risk in-force as of December 31, 2006. Default rates are shown by region based upon the location of the underlying property, rather than the location of the lender. We believe that increases in the 2005 default rates for the South Central and Southeast regions reflect increased delinquencies associated with Hurricanes Katrina and Rita. However, this did not have a material impact on our 2005 or 2006 results of operations.
| Percent of primary risk in-force as of December 31, 2006 |
Default rate December 31, |
|||||||||||
| 2006 | 2005 | 2004 | ||||||||||
| U.S. Regions |
||||||||||||
| Southeast(1) |
26 | % | 3.36 | % | 4.03 | % | 3.87 | % | ||||
| South Central(2) |
17 | 3.18 | % | 4.91 | % | 3.82 | % | |||||
| Northeast(3) |
13 | 3.34 | % | 3.66 | % | 3.79 | % | |||||
| North Central(4) |
12 | 2.80 | % | 2.84 | % | 2.80 | % | |||||
| Great Lakes(5) |
10 | 4.75 | % | 4.96 | % | 4.61 | % | |||||
| Pacific(6) |
8 | 1.44 | % | 1.79 | % | 2.11 | % | |||||
| Plains(7) |
6 | 2.52 | % | 2.60 | % | 2.57 | % | |||||
| New England(8) |
4 | 2.66 | % | 2.56 | % | 2.46 | % | |||||
| Mid-Atlantic(9) |
4 | 2.21 | % | 2.52 | % | 2.85 | % | |||||
| Total |
100 | % | 3.12 | % | 3.68 | % | 3.43 | % | ||||
| (1) | Alabama, Arkansas, Florida, Georgia, Mississippi, North Carolina, South Carolina and Tennessee. |
| (2) | Arizona, Colorado, Louisiana, New Mexico, Oklahoma, Texas and Utah. |
| (3) | New Jersey, New York and Pennsylvania. |
122
| (4) | Illinois, Minnesota, Missouri and Wisconsin. |
| (5) | Indiana, Kentucky, Michigan and Ohio. |
| (6) | Alaska, California, Hawaii, Nevada, Oregon and Washington. |
| (7) | Idaho, Iowa, Kansas, Montana, Nebraska, North Dakota, South Dakota and Wyoming. |
| (8) | Connecticut, Maine, Massachusetts, New Hampshire, Rhode Island and Vermont. |
| (9) | Delaware, Maryland, Virginia, Washington, D.C. and West Virginia. |
| Percent of primary risk in-force as of December 31, 2006 |
Default Rate December 31, |
|||||||||||
| 2006 | 2005 | 2004 | ||||||||||
| Florida |
9.43 | % | 2.17 | % | 2.43 | % | 2.80 | % | ||||
| Texas |
6.97 | % | 3.89 | % | 5.09 | % | 4.70 | % | ||||
| New York |
6.38 | % | 2.59 | % | 2.87 | % | 3.06 | % | ||||
| Illinois |
5.18 | % | 3.08 | % | 3.16 | % | 3.26 | % | ||||
| Georgia |
4.41 | % | 4.22 | % | 4.51 | % | 4.92 | % | ||||
| North Carolina |
4.05 | % | 4.04 | % | 4.51 | % | 4.33 | % | ||||
| Pennsylvania |
3.73 | % | 4.47 | % | 4.83 | % | 4.79 | % | ||||
| Ohio |
3.73 | % | 4.96 | % | 5.40 | % | 5.13 | % | ||||
| New Jersey |
3.34 | % | 3.14 | % | 3.36 | % | 3.52 | % | ||||
| California |
3.25 | % | 0.99 | % | 1.14 | % | 1.39 | % | ||||
The frequency of defaults may not correlate directly with the number of claims received because the rate at which defaults are cured is influenced by borrowers’ financial resources and circumstances and regional economic differences. Whether an uncured default leads to a claim principally depends upon the borrower’s equity at the time of default and the borrower’s or the insured’s ability to sell the home for an amount sufficient to satisfy all amounts due under the mortgage loan. When we receive notice of a default, we use a proprietary model to determine whether a delinquent loan is a candidate for work out. When the model identifies such a candidate, our loan workout specialists prioritize cases for loss mitigation based upon the likelihood that the loan will result in a claim. Loss mitigation actions include loan modification, extension of credit to bring a loan current, foreclosure forbearance, pre-foreclosure sale, and deed-in-lieu. These loss mitigation efforts often are an effective way to reduce our claim exposure and ultimate payouts.
Claim activity is not spread evenly throughout the coverage period of a primary insurance book of business. Based upon our experience, the majority of claims on primary mortgage insurance loans occur in the third through seventh years after loan origination, and relatively few claims are paid during the first two years after loan origination. Primary insurance written from the period from January 1, 1999 through December 31, 2003 represented 34% of our primary insurance in-force as of December 31, 2006. This portion of our loan portfolio is in its expected peak claim period with respect to traditional primary loans. We believe our “A minus” and “sub-prime” loans will have earlier incidences of default than our prime loans. “A minus” and “sub-prime” loans represented 11.2% and 10.4% of our primary risk in-force as of December 31, 2006 and 2005, respectively.
Primary mortgage insurance claims paid, including loss adjustment expenses, for the year ended December 31, 2006 were $135 million, compared to $145 million and $146 million for the years ended December 31, 2005 and 2004, respectively. Pool insurance claims paid were $1 million for each of the years ended December 31, 2006, 2005 and 2004.
123
The following table sets forth the dispersion of our primary insurance in-force and risk in-force as of December 31, 2006, by year of policy origination and average annual mortgage interest rate since we began operations in 1981:
| (Dollar amounts in millions) Policy Year |
Average rate |
Primary insurance in-force |
Percent of total |
Primary risk in-force |
Percent of total |
||||||||||
| 1997 and Prior |
8.12 | % | $ | 2,644 | 2.33 | % | $ | 647 | 2.78 | % | |||||
| 1998 |
7.14 | % | 1,048 | 0.92 | % | 276 | 1.18 | % | |||||||
| 1999 |
7.28 | % | 1,240 | 1.09 | % | 313 | 1.35 | % | |||||||
| 2000 |
8.15 | % | 779 | 0.69 | % | 192 | 0.82 | % | |||||||
| 2001 |
7.36 | % | 2,869 | 2.53 | % | 706 | 3.04 | % | |||||||
| 2002 |
6.56 | % | 7,110 | 6.27 | % | 1,705 | 7.33 | % | |||||||
| 2003 |
5.63 | % | 26,379 | 23.26 | % | 4,568 | 19.63 | % | |||||||
| 2004 |
5.82 | % | 14,705 | 12.97 | % | 3,204 | 13.77 | % | |||||||
| 2005 |
5.97 | % | 20,478 | 18.06 | % | 5,006 | 21.52 | % | |||||||
| 2006 |
6.68 | % | 36,160 | 31.88 | % | 6,650 | 28.58 | % | |||||||
| Total portfolio |
6.31 | % | $ | 113,412 | 100.00 | % | $ | 23,267 | 100.00 | % | |||||
The ratio of the claim paid to the current risk in-force for a loan is referred to as “claim severity.” The current risk in-force is equal to the unpaid principal amount multiplied by the coverage percentage. The main determinants of claim severity are the age of the mortgage loan, the value of the underlying property, accrued interest on the loan, expenses advanced by the insured and foreclosure expenses. These amounts depend partly upon the time required to complete foreclosure, which varies depending upon state laws. Pre-foreclosure sales, acquisitions and other early workout efforts help to reduce overall claim severity. Our average primary mortgage insurance claim severity was 97%, 95% and 94% for the years ended December 31, 2006, 2005 and 2004, respectively.
124
International Mortgage insurance loan portfolio
The following table sets forth selected financial information regarding the effective risk in-force of our international mortgage insurance loan portfolio as of the dates indicated:
| December 31, | |||||||||
| (Amounts in millions) |
2006 | 2005 | 2004 | ||||||
| Loan-to-value ratio |
|||||||||
| 95.01% and above |
$ | 5,074 | $ | 1,448 | $ | 515 | |||
| 90.01% to 95.00% |
27,402 | 19,337 | 14,707 | ||||||
| 80.01% to 90.00% |
37,353 | 28,679 | 23,841 | ||||||
| 80.00% and below |
36,426 | 29,539 | 22,944 | ||||||
| Total |
$ | 106,255 | $ | 79,003 | $ | 62,007 | |||
| Loan type(1) |
|||||||||
| Fixed rate mortgage |
$ | 386 | $ | 59 | $ | — | |||
| Adjustable rate mortgage |
105,869 | 78,944 | 62,007 | ||||||
| Total |
$ | 106,255 | $ | 79,003 | $ | 62,007 | |||
| Mortgage term |
|||||||||
| 15 years and under |
$ | 41,020 | $ | 32,041 | $ | 26,138 | |||
| More than 15 years |
65,235 | 46,962 | 35,869 | ||||||
| Total |
$ | 106,255 | $ | 79,003 | $ | 62,007 | |||
| (1) | For loan type in this table, any loan with an interest rate that is fixed for an initial term of five years or less is categorized as an adjustable rate mortgage. |
Our businesses in Australia, New Zealand and Canada currently provide 100% coverage on the majority of the loans we insure in those markets. The table above presents effective risk in-force, which recognizes the loss on any particular loan will be reduced by the net proceeds received upon sale of the property. Effective risk in-force has been calculated by applying to insurance in-force a factor that represents our highest expected average per-claim payment for any one underwriting year over the life of our businesses in Australia, New Zealand and Canada. As of December 31, 2006, this factor was 35%.
Loans in default and claims
The claim process in our international mortgage insurance business is similar to the process we follow in our U.S. mortgage insurance business. See “—Mortgage Insurance—U.S. mortgage insurance—Loans in default and claims.” The following table sets forth the number of loans insured, the number of loans in default and the default rate for our international mortgage insurance portfolio:
| December 31, | |||||||||
| 2006 | 2005 | 2004 | |||||||
| Primary insurance |
|||||||||
| Insured loans in-force |
2,437,746 | 1,910,964 | 1,591,485 | ||||||
| Loans in default |
9,995 | 7,091 | 5,304 | ||||||
| Percentage of loans in default (default rate) |
0.4 | % | 0.4 | % | 0.3 | % | |||
| Flow loans in-force |
2,156,641 | 1,627,587 | 1,346,035 | ||||||
| Flow loans in default |
9,671 | 6,866 | 5,084 | ||||||
| Percentage of flow loans in default (default rate) |
0.4 | % | 0.4 | % | 0.4 | % | |||
| Portfolio credit enhancement loans in-force |
281,105 | 283,377 | 245,450 | ||||||
| Portfolio credit enhancement loans in default |
324 | 225 | 220 | ||||||
| Percentage of portfolio credit enhancement loans in default (default rate) |
0.1 | % | 0.1 | % | 0.1 | % | |||
125
Affinity segment
The following table sets forth the historical results of operations relating to the Affinity segment. Because we did not acquire any of the Affinity segment businesses from GEFAHI in our corporate formation, this segment’s results of operations are included in our results of operations only for periods through May 24, 2004 and are not included in our financial information.
| Years ended December 31, | Increase (decrease) and percentage change |
||||||||||||||||||||||
| (Amounts in millions) |
2006 | 2005 | 2004 | 2006 vs. 2005 | 2005 vs. 2004 | ||||||||||||||||||
| Revenues: |
|||||||||||||||||||||||
| Premiums |
$ | — | $ | — | $ | 88 | $ | — | — | % | $ | (88 | ) | NM | (1) | ||||||||
| Net investment income |
— | — | 26 | — | — | % | (26 | ) | NM | (1) | |||||||||||||
| Policy fees and other income |
— | — | 104 | — | — | % | (104 | ) | NM | (1) | |||||||||||||
| Total revenues |
— | — | 218 | — | — | % | (218 | ) | NM | (1) | |||||||||||||
| Benefits and expenses: |
|||||||||||||||||||||||
| Benefits and other changes in policy reserves |
— | — | 80 | — | — | % | (80 | ) | NM | (1) | |||||||||||||
| Acquisition and operating expenses, net of deferrals |
— | — | 123 | — | — | % | (123 | ) | NM | (1) | |||||||||||||
| Amortization of deferred acquisition costs and intangibles |
— | — | 47 | — | — | % | (47 | ) | NM | (1) | |||||||||||||
| Total benefits and expenses |
— | — | 250 | — | — | % | (250 | ) | NM | (1) | |||||||||||||
| Income (loss) before income taxes |
— | — | (32 | ) | — | — | % | (32 | ) | NM | (1) | ||||||||||||
| Provision (benefit) for income taxes |
— | — | (18 | ) | — | — | % | (18 | ) | NM | (1) | ||||||||||||
| Segment net operating income (loss) |
$ | — | $ | — | $ | (14 | ) | $ | — | — | % | $ | (14 | ) | NM | (1) | |||||||
| (1) |
Not meaningful |
126
Corporate and Other
Our Corporate and Other activities consists primarily of unallocated corporate income and expenses (including amounts incurred in settlement of class action lawsuits), the results of a small, non-core business that is managed outside our operating segments, most of our interest and other financing expenses and net investment gains (losses).
The following table sets forth the results of operations relating to Corporate and Other:
| Years ended December 31, | Increase (decrease) and percentage change |
|||||||||||||||||||||||||
| (Amounts in millions) |
2006 | 2005 | 2004 | 2006 vs. 2005 | 2005 vs. 2004 | |||||||||||||||||||||
| Revenues: |
||||||||||||||||||||||||||
| Premiums |
$ | 25 | $ | 39 | $ | 50 | $ | (14 | ) | (36 | )% | $ | (11 | ) | (22 | )% | ||||||||||
| Net investment income |
99 | 149 | 146 | (50 | ) | (34 | )% | 3 | 2 | % | ||||||||||||||||
| Net investment gains (losses) |
(12 | ) | (2 | ) | 26 | (10 | ) | NM | (1) | (28 | ) | (108 | )% | |||||||||||||
| Policy fees and other income |
14 | 13 | 49 | 1 | 8 | % | (36 | ) | (73 | )% | ||||||||||||||||
| Total revenues |
126 | 199 | 271 | (73 | ) | (37 | )% | (72 | ) | (27 | )% | |||||||||||||||
| Expenses: |
||||||||||||||||||||||||||
| Benefits and other changes in policy reserves |
2 | 6 | 6 | (4 | ) | (67 | )% | — | — | % | ||||||||||||||||
| Acquisition and operating expenses, net of deferrals |
64 | 91 | 70 | (27 | ) | (30 | )% | 21 | 30 | % | ||||||||||||||||
| Amortization of deferred acquisition costs and intangibles |
4 | 10 | 10 | (6 | ) | (60 | )% | — | — | % | ||||||||||||||||
| Interest expense |
218 | 238 | 201 | (20 | ) | (8 | )% | 37 | 18 | % | ||||||||||||||||
| Total benefits and expenses |
288 | 345 | 287 | (57 | ) | (17 | )% | 58 | 20 | % | ||||||||||||||||
| Income (loss) before income taxes |
(162 | ) | (146 | ) | (16 | ) | (16 | ) | (11 | )% | (130 | ) | NM | (1) | ||||||||||||
| Provision (benefit) for income taxes |
(47 | ) | (45 | ) | (66 | ) | (2 | ) | (4 | )% | 21 | 32 | % | |||||||||||||
| Cumulative effect of accounting change, net of taxes |
4 | — | — | 4 | NM | (1) | — | — | ||||||||||||||||||
| Net income (loss) |
(111 | ) | (101 | ) | 50 | (10 | ) | (10 | )% | (151 | ) | NM | (1) | |||||||||||||
| Adjustments to net loss: |
||||||||||||||||||||||||||
| Net investment (gains) losses, net of taxes and other adjustments |
8 | 1 | (16 | ) | 7 | NM | (1) | 17 | 106 | % | ||||||||||||||||
| Cumulative effect of accounting change, net of taxes |
(4 | ) | — | — | (4 | ) | NM | (1) | — | — | ||||||||||||||||
| Net tax benefit related to IPO |
— | — | (46 | ) | — | — | % | 46 | 100 | % | ||||||||||||||||
| Gain on outsourcing services agreement, net of taxes |
— | — | (25 | ) | — | — | % | 25 | 100 | % | ||||||||||||||||
| Net operating loss |
$ | (107 | ) | $ | (100 | ) | $ | (37 | ) | $ | (7 | ) | (7 | )% | $ | (63 | ) | (170 | )% | |||||||
| (1) | Not meaningful |
2006 vs. 2005
Net operating loss
The increase in the net operating loss was primarily attributable to lower unallocated net investment income driven by a $46 million decrease from the derecognition of consolidated securitization entities in the first quarter of 2006 and a lower level of corporate investments, offset by lower interest expense and acquisition and operating expenses.
Lower unallocated investment income is the result of our use of excess capital for acquisitions and for $1 billion of stock repurchases in 2006. The decrease in interest expense was primarily associated with $33 million from the derecognition of borrowings related to securitization entities in the first quarter of 2006, partially offset by a higher short-term interest rate environment and increased debt level. The decrease in unallocated acquisition and operating expenses, net of deferrals, was primarily the result of lower unallocated expenses remaining in Corporate and Other in 2006 compared to 2005.
127
The increase in income tax benefit was offset by an increase in non-deductible expenses and a reduction in state income tax benefit.
2005 vs. 2004
Net operating income (loss)
The decrease in net operating income for the year ended December 31, 2005 was primarily attributable to higher impairments on fixed maturities and a decrease in policy fees and other income associated with a $25 million after-tax gain recognized in 2004 related to our waiver of contractual rights under an outsourcing services agreement with our global outsourcing provider, increases in stand-alone public company costs and interest expense as a result of changes to our debt structure as a result of our IPO, as well as, higher short-term interest rates on our short-term borrowings and the decreased benefit for income taxes due to nonrecurring IPO-related tax benefits recognized in 2004.
Despite having higher pre-tax losses, the decreased benefit for income taxes was primarily attributable to nonrecurring IPO-related transaction tax benefits in 2004.
Investments
Investment results
The following table sets forth information about our investment income, excluding net investment gains (losses), for each component of our investment portfolio for the periods indicated:
| For the years ended December 31, | Increase (decrease) | ||||||||||||||||||||||||||||||||||
| 2006 | 2005 | 2004 | 2006 vs. 2005 | 2005 vs. 2004 | |||||||||||||||||||||||||||||||
| (Amounts in millions) |
Yield | Amount | Yield | Amount | Yield | Amount | Yield | Amount | Yield | Amount | |||||||||||||||||||||||||
| Fixed maturities—taxable(1) |
5.8 | % | $ | 2,974 | 5.6 | % | $ | 2,719 | 5.7 | % | $ | 2,925 | 0.2 | % | $ | 255 | (0.1 | )% | $ | (206 | ) | ||||||||||||||
| Fixed maturities—non-taxable |
4.7 | % | 122 | 4.5 | % | 128 | 4.5 | % | 132 | 0.2 | % | (6 | ) | — | % | (4 | ) | ||||||||||||||||||
| Commercial mortgage loans |
6.4 | % | 514 | 6.7 | % | 457 | 6.4 | % | 381 | (0.3 | )% | 57 | 0.3 | % | 76 | ||||||||||||||||||||
| Equity securities |
12.3 | % | 23 | 8.9 | % | 25 | 5.1 | % | 23 | 3.4 | % | (2 | ) | 3.8 | % | 2 | |||||||||||||||||||
| Other investments |
9.9 | % | 51 | 8.1 | % | 73 | 8.9 | % | 58 | 1.8 | % | (22 | ) | (0.8 | )% | 15 | |||||||||||||||||||
| Policy loans |
8.9 | % | 128 | 8.6 | % | 110 | 8.2 | % | 94 | 0.3 | % | 18 | 0.4 | % | 16 | ||||||||||||||||||||
| Restricted investments held by securitization entities |
5.1 | % | 7 | 6.4 | % | 50 | 6.6 | % | 64 | (1.3 | )% | (43 | ) | (0.2 | )% | (14 | ) | ||||||||||||||||||
| Cash, cash equivalents and short-term investments |
4.3 | % | 95 | 2.5 | % | 45 | 1.0 | % | 23 | 1.8 | % | 50 | 1.5 | % | 22 | ||||||||||||||||||||
| Gross investment income before expenses and fees |
5.9 | % | 3,914 | 5.7 | % | 3,607 | 5.6 | % | 3,700 | 0.2 | % | 307 | 0.1 | % | (93 | ) | |||||||||||||||||||
| Expenses and fees |
(77 | ) | (71 | ) | (52 | ) | (6 | ) | (19 | ) | |||||||||||||||||||||||||
| Net investment income |
5.8 | % | $ | 3,837 | 5.6 | % | $ | 3,536 | 5.5 | % | $ | 3,648 | 0.2 | % | $ | 301 | 0.1 | % | $ | (112 | ) | ||||||||||||||
| (1) | Includes $22 million adjustment in the fourth quarter of 2006 related to reinsurance assumed in our payment protection insurance business previously reflected as risk transfer and adjusted to reflect deposit accounting. |
Yields for fixed maturities and equity securities are based on amortized cost and cost, respectively. Yields for securities lending activity, which is included in other investments, are calculated net of the corresponding
128
securities lending liability. All other yields are based on average carrying values. Bond calls, prepayments and release of commercial mortgage loan loss reserves were $51 million, $85 million and $57 million for the years ended December 31, 2006, 2005 and 2004, respectively.
The 2006 increase in overall investment yields was primarily attributable to increased yields on floating rate investments backing spread-based institutional products reflecting the higher short-term interest rate environment. The 2005 increase in overall investment yields was primarily attributable to a $32 million fourth quarter adjustment of our commercial mortgage loan loss reserves, higher derivative income from non-qualifying hedges and limited partnership income, partially offset by purchases of new assets in an interest rate environment where current market yields were lower than existing portfolio yields.
The following table sets forth net investment gains (losses) for the years ended December 31:
| (Amounts in millions) |
2006 | 2005 | 2004 | |||||||||
| Available-for-sale securities: |
||||||||||||
| Realized gains on sale |
$ | 72 | $ | 108 | $ | 90 | ||||||
| Realized losses on sale |
(118 | ) | (39 | ) | (38 | ) | ||||||
| Loss on derecognition of securitization entities |
(17 | ) | — | — | ||||||||
| Impairments |
(8 | ) | (71 | ) | (26 | ) | ||||||
| Net unrealized losses on trading securities |
(1 | ) | — | — | ||||||||
| Derivative instruments |
3 | — | — | |||||||||
| Net investment gains (losses) |
$ | (69 | ) | $ | (2 | ) | $ | 26 | ||||
Derivative instruments primarily consist of changes in fair value on the non-qualifying derivatives, including embedded derivatives, changes in fair value of certain derivatives and related hedged items in fair value hedge relationships and hedge ineffectiveness on qualifying derivative instruments. Effective April 1, 2006, we began classifying changes in fair value of these derivative items as net investment gains (losses). These items were previously included as a component of net investment income, interest credited and benefits and other changes in policy reserves. The amount of these derivative items in prior periods that were included in the aforementioned categories was not material.
For a discussion of the change in net investment gains (losses), see the comparison for this line item under “—Results of Operations.”
Commercial mortgage loans
The following table presents the activity in the allowance for losses during the years ended December 31:
| (Amounts in millions) |
2006 | 2005 | 2004 | |||||||||
| Balance as of January 1 |
$ | 31 | $ | 52 | $ | 50 | ||||||
| Provision |
1 | 11 | 7 | |||||||||
| Release |
(17 | ) | (32 | ) | — | |||||||
| Amounts written off, net of recoveries |
— | — | (5 | ) | ||||||||
| Balance as of December 31 |
$ | 15 | $ | 31 | $ | 52 | ||||||
During 2005, we adjusted our process for estimating credit losses in our commercial mortgage loan portfolio. As a result of this adjustment, we released $32 million ($19 million net of deferred acquisition costs and of tax) of commercial mortgage loan reserves to net investment income in the fourth quarter of 2005. During 2006, we reduced our reserve for commercial loan losses from $31 million to $15 million reflecting continued strong credit performance in this portfolio.
129
Investment portfolio
The following table sets forth our cash, cash equivalents and invested assets as of the dates indicated:
| December 31, | ||||||||||||
| 2006 | 2005 | |||||||||||
| (Amounts in millions) |
Carrying value |
% of total |
Carrying value |
% of total |
||||||||
| Fixed-maturities, available-for-sale |
||||||||||||
| Public |
$ | 40,160 | 56 | % | $ | 40,539 | 59 | % | ||||
| Private |
15,288 | 21 | 13,398 | 19 | ||||||||
| Commercial mortgage loans |
8,491 | 12 | 7,558 | 11 | ||||||||
| Other investments |
3,846 | 6 | 3,174 | 5 | ||||||||
| Policy loans |
1,494 | 2 | 1,350 | 2 | ||||||||
| Restricted investments held by securitization entities |
— | — | 685 | 1 | ||||||||
| Equity securities, available for sale |
197 | — | 206 | — | ||||||||
| Cash and cash equivalents |
2,469 | 3 | 1,875 | 3 | ||||||||
| Total cash, cash equivalents and invested assets |
$ | 71,945 | 100 | % | $ | 68,785 | 100 | % | ||||
The total investment portfolio increased $3.2 billion. The increase was primarily due to cash generated from operating activities, net of cash used for financing activities, which was invested in fixed maturities and commercial mortgage loans compounded by an increase in the securities lending program. This was partially offset by lower net unrealized gains as a result of a higher interest rate environment and the derecognition of restricted investments held by securitization entities from our consolidated statement of financial position.
Included in other investments are certain securities that are designated as trading and, accordingly, are held at fair value with changes in fair value included in net investment gains (losses) in the consolidated statement of income. As of December 31, 2006 and 2005, the fair value of the trading portfolio was $107 million and $15 million, respectively.
Impairments of investment securities
We regularly review investment securities for impairment in accordance with our impairment policy, which includes both quantitative and qualitative criteria. Quantitative criteria include length of time and amount that each security is in an unrealized loss position, and for fixed maturities, whether the issuer is in compliance with terms and covenants of the security. Our qualitative criteria include the financial strength and specific prospects for the issuer as well as our intent to hold the security until recovery. Our impairment reviews involve our finance, risk and asset management teams, as well as the portfolio management and research capabilities of GEAM and other third-party asset managers, as required.
For fixed maturities, we recognize an impairment charge to income in the period in which we determine that we do not expect either to collect principal and interest in accordance with the contractual terms of the instruments or to recover based upon underlying collateral values, considering events such as a payment default, bankruptcy or disclosure of fraud. For equity securities, we recognize an impairment charge in the period in which we determine that the security will not recover to book value within a reasonable period. We determine what constitutes a reasonable period on a security-by-security basis based upon consideration of all the evidence available to us, including the magnitude of an unrealized loss and its duration. In any event, this period does not exceed 18 months for common equity securities. We measure impairment charges based upon the difference between the book value of a security and its fair value. Fair value is based upon quoted market price, except for certain infrequently traded securities where we estimate values using internally developed pricing models. These models are based upon common valuation techniques and require us to make assumptions regarding credit quality, liquidity and other factors that affect estimated values.
130
For the years ended December 31, 2006, 2005 and 2004, we recognized impairments of $8 million, $71 million and $26 million, respectively. We generally intend to hold securities in unrealized loss positions until they recover. However, from time to time, we sell securities in the ordinary course of managing our portfolio to meet diversification, credit quality, yield and liquidity requirements. The aggregate fair value of securities sold at a loss during twelve months ended December 31, 2006 was $4,352 million, which was approximately 97.4% of book value.
The following table presents the gross unrealized losses and estimated fair values of our investment securities, aggregated by investment type and length of time that individual investment securities have been in a continuous unrealized loss position, as of December 31, 2006:
| Less Than 12 Months | 12 Months or more | |||||||||||||||||
| Estimated fair value |
Gross unrealized losses |
# of securities |
Estimated fair value |
Gross unrealized losses |
# of securities | |||||||||||||
| (Dollar amounts in millions) |
||||||||||||||||||
| Description of Securities |
||||||||||||||||||
| Fixed maturities: |
||||||||||||||||||
| U.S. government, agencies and government sponsored entities |
$ | 375 | $ | (4 | ) | 14 | $ | 123 | $ | (3 | ) | 24 | ||||||
| Tax exempt |
— | — | — | 45 | (1 | ) | 22 | |||||||||||
| Government—non U.S. |
373 | (3 | ) | 72 | 155 | (3 | ) | 40 | ||||||||||
| U.S. corporate |
5,096 | (84 | ) | 502 | 6,213 | (252 | ) | 662 | ||||||||||
| Corporate—non U.S. |
3,254 | (46 | ) | 414 | 2,735 | (94 | ) | 269 | ||||||||||
| Mortgage and asset backed |
2,218 | (13 | ) | 298 | 3,561 | (85 | ) | 448 | ||||||||||
| Subtotal, fixed maturities |
11,316 | (150 | ) | 1,300 | 12,832 | (438 | ) | 1,465 | ||||||||||
| Equity securities |
— | — | — | 23 | (2 | ) | 12 | |||||||||||
| Total temporarily impaired securities |
$ | 11,316 | $ | (150 | ) | 1,300 | $ | 12,855 | $ | (440 | ) | 1,477 | ||||||
| % Below cost—fixed maturities: |
||||||||||||||||||
| <20% Below cost |
$ | 11,311 | $ | (148 | ) | 1,299 | $ | 12,797 | $ | (426 | ) | 1,459 | ||||||
| 20-50% Below cost |
5 | (2 | ) | 1 | 35 | (12 | ) | 6 | ||||||||||
| >50% Below cost |
— | — | — | — | — | — | ||||||||||||
| Total fixed maturities |
11,316 | (150 | ) | 1,300 | 12,832 | (438 | ) | 1,465 | ||||||||||
| % Below cost—equity securities: |
||||||||||||||||||
| <20% Below cost |
— | — | — | 23 | (2 | ) | 12 | |||||||||||
| 20-50% Below cost |
— | — | — | — | — | — | ||||||||||||
| >50% Below cost |
— | — | — | — | — | — | ||||||||||||
| Total equity securities |
— | — | — | 23 | (2 | ) | 12 | |||||||||||
| Total temporarily impaired securities |
$ | 11,316 | $ | (150 | ) | 1,300 | $ | 12,855 | $ | (440 | ) | 1,477 | ||||||
| Investment grade |
$ | 10,961 | $ | (142 | ) | 1,219 | $ | 12,208 | $ | (409 | ) | 1,366 | ||||||
| Below investment grade |
355 | (8 | ) | 81 | 635 | (30 | ) | 101 | ||||||||||
| Not Rated—Fixed maturities |
— | — | — | — | — | — | ||||||||||||
| Not Rated—Equities |
— | — | — | 12 | (1 | ) | 10 | |||||||||||
| Total temporarily impaired securities |
$ | 11,316 | $ | (150 | ) | 1,300 | $ | 12,855 | $ | (440 | ) | 1,477 | ||||||
The investment securities in an unrealized loss position as of December 31, 2006 consisted of 2,777 securities accounting for unrealized losses of $590 million. Of these unrealized losses 93.4% were investment grade (rated AAA through BBB-) and 97.6% were less than 20% below cost. The amount of the unrealized loss on these securities was primarily attributable to increases in interest rates.
Of the investment securities in an unrealized loss position for twelve months or more as of December 31, 2006, 6 securities were 20% or more below cost, including one security, which was also below investment grade
131
(rated BB+ and below). This security accounted for unrealized losses of less than $1 million. The security was issued by a corporation in the finance and banking industry, was current on all terms and we currently expect to collect full principal and interest.
As of December 31, 2006, we expect these investments to continue to perform in accordance with their original contractual terms and we have the ability and intent to hold these investment securities until the recovery of the fair value up to the cost of the investment, which may be maturity. Accordingly, we do not consider these investments to be other-than-temporarily impaired at December 31, 2006. However, from time to time, we may sell securities in the ordinary course of managing our portfolio to meet diversification, credit quality, yield enhancement, asset-liability management and liquidity requirements.
Derivatives
The fair value of derivative instruments, including financial futures, interest rate and foreign currency swaps and equity index options, are based upon pricing valuation models which utilize independent third-party data as inputs. The following table sets forth our positions in derivative instruments and the estimated fair values as of the dates indicated:
| December 31, | |||||||||||||
| 2006 | 2005 | ||||||||||||
| (Amounts in millions) |
Notional value |
Estimated fair value |
Notional value |
Estimated fair value | |||||||||
| Interest rate swaps |
$ | 17,832 | $ | 496 | $ | 7,894 | $ | 508 | |||||
| Foreign currency swaps |
567 | (8 | ) | 533 | 4 | ||||||||
| Equity index options |
323 | 22 | 265 | 21 | |||||||||
| Financial futures |
19 | — | 27 | — | |||||||||
| Total |
$ | 18,741 | $ | 510 | $ | 8,719 | $ | 533 | |||||
As of December 31, 2006 and 2005, the fair value of derivatives in a gain position and recorded in other invested assets was $543 million and $559 million, respectively, and the fair value of derivatives in a loss position and recorded in other liabilities was $33 million and $26 million, respectively.
The increase in the notional value of derivatives during 2006 was primarily due to a forward starting interest rate swap program with a notional value totaling $8.5 billion to hedge the cash flows of forecasted transactions related to our long-term care business within our Protection segment. In addition, we entered into interest rate swaps with notional value of $0.9 billion to convert fixed rate liabilities into floating rate liabilities consistent with the overall asset-liability management for our FABN business within our Retirement Income and Investments segment.
Liquidity and Capital Resources
Liquidity and capital resources represent our overall financial strength and our ability to generate strong cash flows from our businesses, borrow funds at competitive rates and raise new capital to meet our operating and growth needs.
Genworth Financial and Subsidiaries
The following table sets forth our condensed consolidated cash flows for the periods indicated:
| Years ended December 31, | ||||||||||||
| (Amounts in millions) |
2006 | 2005 | 2004 | |||||||||
| Net cash from operating activities |
$ | 4,365 | $ | 3,479 | $ | 5,605 | ||||||
| Net cash from investing activities |
(2,898 | ) | (3,277 | ) | (4,940 | ) | ||||||
| Net cash from financing activities |
(835 | ) | (248 | ) | (791 | ) | ||||||
| Net increase (decrease) in cash less foreign exchange effect |
$ | 632 | $ | (46 | ) | $ | (126 | ) | ||||
132
Cash flows from operating activities are affected by the timing of premiums received, fees received, investment income and expenses paid. Principal sources of cash include sales of our products and services. The increase in cash flows for the year ended December 31, 2006 from operating activities was primarily the result of the timing of cash settlement for other assets and other liabilities.
As an insurance business, we typically generate positive cash flows from operating activities, as premiums and deposits collected from our insurance and investment products exceed benefits paid and redemptions, and we invest the excess. Accordingly, in analyzing our cash flow we focus on the change in the amount of cash available and used in investing activities.
The decrease in net cash used in investing activities for the year ended December 31, 2006 compared to December 31, 2005 was primarily the result of an increase of cash provided by our operating activities, as discussed above, partially offset by an increase in net cash used in our financing activities.
Changes in cash from financing activities primarily relate to the issuance and repayment of borrowings, dividends to our stockholders and other capital transactions, as well as the issuance of, and redemptions and benefit payments on, investment contracts and changes in the cash collateral for loaned securities under our securities lending program. During 2006, uses of cash included share repurchases amounting to $1.0 billion, dividend payments to our stockholders of $145 million and net redemptions on investment contracts of $1.8 billion. These uses of cash were partially offset by an issuance of $1,365 million in non-recourse funding obligations and $600 million of junior subordinated notes.
At December 31, 2006, we have two revolving credit facilities totaling $2 billion as further described in “—Capital Resources and Financing Activities.”
Total assets were $110.9 billion as of December 31, 2006, compared to $105.7 billion as of December 31, 2005. The increase in total assets was primarily driven by increase in balances of fixed maturity securities and commercial mortgage loans driven primarily by normal business growth. Offsetting these increases in total assets was a decrease in restricted investments held by securitization entities taken off-balance sheet and assets used for our $1 billion stock repurchase. See “—Securitization Entities.”
Total liabilities were $97.5 billion as of December 31, 2006, compared to $92.3 billion as of December 31, 2005. The increase in total liabilities was primarily driven by an increase in our future annuity and contract benefits liability and unearned premiums from the continued growth of our business, non-recourse funding obligations, long-term borrowings offset partially by a decrease in borrowings related to securitization entities taken off-balance sheet in 2006. See “—Securitization Entities.”
Genworth Financial, Inc.—holding company
We conduct all our operations through our operating subsidiaries. Dividends from our subsidiaries and permitted payments to us under our tax sharing arrangements with our subsidiaries are our principal sources of cash to pay stockholder dividends and to meet our holding company obligations, including payments of principal and interest on our outstanding indebtedness.
Our primary uses of funds at our holding company level include payment of general operating expenses, payment of principal, interest and other expenses related to holding company debt, payment of dividends on our common and preferred stock, amounts we owe to GE under the Tax Matters Agreement, contract adjustment payments on our Equity Units, contributions to subsidiaries, and, potentially, acquisitions.
Since the completion of the IPO, we declared a dividend on our common stock of $32 million in each of the third and fourth quarters of 2004. The fourth quarter dividend was paid in January 2005. During 2005, we declared dividends on our common stock of $132 million, of which $35 million was paid in January 2006. In the third quarter of 2005, we increased our quarterly dividend 15% from $0.065 per share to $0.075 per share. In the
133
first and second quarters of 2006, we declared common stock dividends of $0.075 per share or $34 million and $35 million, respectively, which were paid in the second and third quarters of 2006, respectively. During the third quarter of 2006, we raised the quarterly dividend by 20% to $0.09 a share and declared dividends on our common stock of $40 million, which was paid during the fourth quarter of 2006. In the fourth quarter we declared common stock dividends of $0.09 per share or $40 million, which was paid in January 2007. The declaration and payment of future dividends to holders of our common stock will be at the discretion of our board of directors and will depend on many factors including our receipt of dividends from our insurance and other operating subsidiaries, financial condition, earnings, capital requirements of our subsidiaries, legal requirements, regulatory constraints and other factors as the board of directors deems relevant. In addition, our Series A Preferred Stock bears dividends at an annual rate of 5.25% of the liquidation value of $50 per share. We also pay quarterly contract adjustment payments with respect to our Equity Units at an annual rate of 2.16% of the stated amount of $25 per Equity Unit.
Insurance laws and regulations regulate the payment of dividends and other distributions to us by our insurance subsidiaries. In general, dividends in excess of prescribed limits are deemed “extraordinary” and require insurance regulatory approval. During the years ended December 31, 2006, 2005 and 2004, we received dividends from our insurance subsidiaries of $587 million ($231 million of which were deemed “extraordinary”), $639 million ($76 million of which were deemed “extraordinary”) and $2,111 million ($1,244 million of which were deemed “extraordinary”), respectively. The ability of our insurance subsidiaries to pay dividends to us, and our ability to pay dividends to our stockholders, also are subject to various conditions imposed by the rating agencies for us to maintain our ratings.
In December 2004, we received a dividend of $700 million from our U.S. mortgage insurance business (included above in dividends paid by our insurance subsidiaries) following the release of statutory contingency reserves from that business. In December 2004, we used $550 million of those proceeds to repay the Contingent Note issued to GEFAHI as part of our corporate formation, and we retained the remainder at our holding company to pay debt servicing expenses and dividends on our common stock.
Based on statutory results as of December 31, 2006, we estimate our subsidiaries could pay dividends of approximately $1,400 million to us in 2007 without obtaining regulatory approval. The ability of our insurance subsidiaries to pay dividends to us, and our ability to pay dividends to our stockholders, also are subject to various conditions imposed by the rating agencies for us to maintain our ratings.
In addition to dividends from our insurance subsidiaries, our other sources of funds include service fees we receive from GE, as described under “—Overview—Separation from GE and related financial arrangements—Services provided to GE,” payments from our subsidiaries pursuant to tax sharing arrangements, borrowings pursuant to our credit facilities, and proceeds from any additional issuances of commercial paper.
The following table sets forth our parent company only cash flows for the periods indicated:
| Years ended December 31, | ||||||||||||
| (Amounts in millions) |
2006 | 2005 | 2004 | |||||||||
| Net cash from operating activities |
$ | 380 | $ | 848 | $ | 700 | ||||||
| Net cash from investing activities |
(180 | ) | 48 | (72 | ) | |||||||
| Net cash from financing activities |
(448 | ) | (664 | ) | (528 | ) | ||||||
| Net increase (decrease) in cash less foreign exchange effect |
$ | (248 | ) | $ | 232 | $ | 100 | |||||
Cash flows from operating activities are primarily affected by the dividends from our subsidiaries and the timing of investment income and expenses paid. During 2005, the increase in cash provided by operating activities was primarily a result of an increase in dividends received from our subsidiaries and the timing of cash settlement for other assets and other liabilities offset by an increase in the net loss of our parent company (excluding income from our subsidiaries).
134
Cash flows from investing activities are affected by the capital contributions paid to subsidiaries and investment activity. For the year ended December 31, 2006, we received $117 million from fixed maturity investment maturities. For the year ended December 31, 2006, we paid $223 million, net of cash acquired, for businesses acquired and made $74 million in subsidiary capital contributions.
Cash flows from financing activities are affected by payments and proceeds from our borrowings, dividends paid to our stockholders and treasury stock acquisitions. For the year ended December 31, 2006, we acquired $1.0 billion of treasury stock and paid $145 million in dividends to our stockholders offset by the issuance of $600 million of junior subordinated notes. For the year ended December 31, 2005, we acquired $500 million of treasury stock and paid $128 million in dividends to our stockholders.
In connection with our corporate formation, we entered into a Tax Matters Agreement with GE, which represents an obligation by us to GE. The balance of this obligation is $380 million as of December 31, 2006.
We have provided liquidity support to some of our insurance subsidiaries in the form of guarantees of certain obligations, in some cases subject to annual scheduled adjustments, totaling $325 million and $418 million as of December 31, 2006 and 2005, respectively. The majority of these obligations are backed by assets held in our insurance subsidiaries which we believe sufficiently cover the underlying obligations.
Regulated insurance subsidiaries
The liquidity requirements of our regulated insurance subsidiaries principally relate to the liabilities associated with their various insurance and investment products, operating costs and expenses, the payment of dividends to us, contributions to their subsidiaries, payment of principal and interest on their outstanding debt obligations and income taxes. Liabilities arising from insurance and investment products include the payment of benefits, as well as cash payments in connection with policy surrenders and withdrawals, policy loans and obligations to redeem funding agreements under applicable put option provisions.
Historically, our insurance subsidiaries have used cash flow from operations and sales of investment securities to fund their liquidity requirements. Our insurance subsidiaries’ principal cash inflows from operating activities derive from premiums, annuity deposits and policy and contract fees and other income, including commissions, cost of insurance, mortality, expense and surrender charges, contract underwriting fees, investment management fees, and dividends and distributions from their subsidiaries. The principal cash inflows from investment activities result from repayments of principal, sales of invested assets and investment income.
As of December 31, 2006, we had approximately $2.7 billion of renewable floating rate funding agreements, which are deposit-type products that generally credit interest on deposits at a floating rate tied to an external market index. Purchasers of renewable funding agreements include money market funds, bank common trust funds and other short-term investors. Some of our funding agreements contain “put” provisions, through which the contractholder has an option to terminate the funding agreement for any reason after giving notice within the contract’s specified notice period. Of the $2.7 billion aggregate amount outstanding as of December 31, 2006, $875 million had put option features including $425 million with put options features of 90 days and $450 million with put options of 180 days.
Our insurance subsidiaries maintain investment strategies intended to provide adequate funds to pay benefits without forced sales of investments. Products having liabilities with longer durations, such as certain life insurance and long-term care insurance policies, are matched with investments having similar estimated lives such as long-term fixed maturities and commercial mortgage loans. Shorter-term liabilities are matched with fixed maturities that have short- and medium-term fixed maturities. In addition, our insurance subsidiaries hold highly liquid, high-quality short-term investment securities and other liquid investment-grade fixed maturities to fund anticipated operating expenses, surrenders, and withdrawals. As of December 31, 2006, our total cash and invested assets was $71.9 billion. Our investments in privately placed fixed maturities, commercial mortgage loans, policy loans and limited partnership interests are relatively illiquid. These asset classes represented approximately 35% of the carrying value of our total cash and invested assets as of December 31, 2006.
135
During 2005, certain of our domestic life insurance subsidiaries transferred primarily foreign-issued investment securities to an affiliated special purpose entity (“SPE”) which is a subsidiary in our Mortgage Insurance segment and consolidated in our financial statements and whose sole purpose is to securitize these investment securities and issue secured notes to various affiliated insurance companies. The securitized investments are owned in their entirety by the SPE and are not available to satisfy the claims of our creditors. These securitized investments provide collateral to the notes issued by the SPE to the insurance companies. The value of those securities as of December 31, 2006 was $1.4 billion.
Capital resources and financing activities
In November 2006, we issued fixed-to-floating rate junior notes having an aggregate principal amount of $600 million, with an annual interest rate equal to 6.15% payable semi-annually, until November 15, 2016, at which point the annual interest rate will be equal to the three-month LIBOR plus 2.0025% payable quarterly, until the notes mature in November 2066 (“2066 Notes”). Subject to certain conditions, we have the right, on one or more occasions, to defer the payment of interest on the 2066 Notes during any period of up to 10 years without giving rise to an event of default and without permitting acceleration under the terms of the 2066 Notes. We will not be required to settle deferred interest payments until we have deferred interest for 5 years or made a payment of current interest. In the event of our bankruptcy, holders will have a limited claim for deferred interest.
We may redeem the 2066 Notes on November 15, 2036, the “scheduled redemption date,” but only to the extent that we have received net proceeds from the sale of certain qualifying capital securities. We may redeem the 2066 Notes (i) in whole or in part, at any time on or after November 15, 2016 at their principal amount plus accrued and unpaid interest to the date of redemption, or (ii) in whole or in part, prior to November 15, 2016 at their principal amount plus accrued and unpaid interest to the date of redemption or, if greater, a make-whole price.
The 2066 Notes will be subordinated to all existing and future senior, subordinated and junior subordinated debt of the company, except for any future debt that by its terms is not superior in right of payment, and will be effectively subordinated to all liabilities of our subsidiaries.
On May 25, 2006 we entered into a $1.0 billion five-year revolving credit facility, which matures in May 2011, replacing our $1.0 billion five-year revolving credit facility, which was scheduled to mature in May 2009. We also have a $1.0 billion revolving credit facility that matures in April 2010. These facilities bear variable interest rates based on a one-month LIBOR plus margin. As of December 31, 2006, we utilized $172 million of the commitment under these facilities for the issuance of a letter of credit for the benefit of one of our Mortgage Insurance subsidiaries.
In 2006, our wholly-owned subsidiaries, River Lake Insurance Company, River Lake Insurance Company III and Rivermont Insurance Company I, issued non-recourse funding obligations in the amounts of $300 million, $750 million and $315 million, respectively. As of December 31, 2006 and 2005, there were $2.8 billion and $1.4 billion of non-recourse funding obligations outstanding, respectively. We may issue additional non-recourse funding obligations from time to time to help satisfy our statutory reserve requirements.
In September 2005, we issued senior notes having an aggregate principal amount of $350 million, with an interest rate equal to 4.95% per year payable semi-annually, and maturing in October 2015 (“2015 Notes”). The 2015 Notes are our direct, unsecured obligations and rank equally with all of our existing and future unsecured and unsubordinated obligations. The 2015 Notes are not guaranteed by any of our subsidiaries. We have the option to redeem all or a portion of the 2015 Notes, at any time with proper notice to the note holders at a price equal to the greater of 100% of principal or the sum of the present value of the remaining scheduled payments of principal and interest discounted at the then-current treasury rate plus an applicable spread.
The net proceeds from the issuance of $348 million from the 2015 Notes were used to reduce our outstanding commercial paper borrowings. The commercial paper was issued under a $1 billion commercial paper program that we have established. As of December 31, 2006, the aggregate amount of our outstanding commercial paper borrowings was $199 million. We may issue additional commercial paper under this program from time to time.
136
In connection with our corporate formation, we assumed ¥60 billion in Yen Notes from GEFAHI. In the third quarter of 2004, we retired the ¥3 billion of Yen Notes that were transferred to us. We entered into arrangements to swap our obligations under the Yen Notes to a U.S. dollar obligation with a principal amount of $478 million and bearing interest at a rate of 4.84% per annum.
In connection with our secondary offering completed in March 2005, we repurchased 19.4 million shares of our Class B Common Stock directly from GE, which were automatically converted to Class A Common Stock upon the transfer of these shares to us, for an aggregate price of $500 million.
On December 21, 2005, our Board of Directors approved a stock repurchase program, authorizing the Company to repurchase up to $750 million of its common stock over the next 18 months. In October of 2006, our Board of Directors authorized the repurchase of an additional $250 million of our common stock. On November 8, 2006 we completed our planned repurchases under this program. Additionally, on December 8, 2006, the Board of Directors approved a stock repurchase program, authorizing the Company to repurchase up to $500 million of our common stock over the 12-month period commencing January 1, 2007.
We believe our revolving credit facilities, further issuances under our commercial paper program and anticipated cash flows from operations, will provide us with sufficient liquidity to meet our operating requirements for the foreseeable future. For further information about our borrowings, refer to note 13 in our consolidated financial statements under “Item 8—Financial Statements and Supplementary Data.”
Contractual obligations and commercial commitments
We enter into obligations to third parties in the ordinary course of our operations. These obligations, as of December 31, 2006, are set forth in the table below. However, we do not believe that our cash flow requirements can be assessed based upon this analysis of these obligations as the funding of these future cash obligations will be from future cash flows from premiums, deposits, fees and investment income that are not reflected herein. Future cash outflows, whether they are contractual obligations or not, also will vary based upon our future needs. Although some outflows are fixed, others depend on future events. Examples of fixed obligations include our obligations to pay principal and interest on fixed-rate borrowings. Examples of obligations that will vary include obligations to pay interest on variable-rate borrowings and insurance liabilities that depend on future interest rates and market performance. Many of our obligations are linked to cash-generating contracts. These obligations include payments to contractholders that assume those contractholders will continue to make deposits in accordance with the terms of their contracts. In addition, our operations involve significant expenditures that are not based upon “commitments.” These include expenditures for income taxes and payroll.
| Payments due by period | |||||||||||||||
| (Amounts in millions) |
Total | 2007 | 2008-2009 | 2010-2011 | 2012 and thereafter | ||||||||||
| Borrowings and interest(1) |
$ | 12,362 | $ | 699 | $ | 1,851 | $ | 578 | $ | 9,234 | |||||
| Operating lease obligations |
9 | 5 | 3 | 1 | — | ||||||||||
| Other purchase liabilities(2) |
536 | 367 | 54 | 45 | 70 | ||||||||||
| Securities lending and repurchase obligations(3) |
2,720 | 2,170 | 70 | 240 | 240 | ||||||||||
| Commercial mortgage loan commitments(4) |
298 | 275 | 23 | — | — | ||||||||||
| Limited partnership commitments(4) |
208 | 103 | 91 | 14 | — | ||||||||||
| Insurance liabilities(5) |
100,961 | 7,377 | 9,277 | 6,572 | 77,735 | ||||||||||
| Tax matters agreement(6) |
573 | 21 | 54 | 91 | 407 | ||||||||||
| Total contractual obligations |
$ | 117,677 | $ | 11,017 | $ | 11,423 | $ | 7,541 | $ | 87,686 | |||||
| (1) | Includes payments of principal and interest of our short- and long-term borrowings, non-recourse funding obligations and senior notes underlying Equity Units and dividend payments on our mandatorily redeemable |
137
| Series A Preferred Stock, as described in note 13 to our consolidated financial statements under “Item 8—Financial Statements and Supplementary Data.” Any payment of principal of, including by redemption, or interest on, the non-recourse funding obligations is subject to regulatory approval. The total amount for borrowings and interest in this table does not equal the amounts on our balance sheet due to interest included in the table that is expected to be incurred in future years. |
| (2) | Includes contractual purchase commitments for goods and services entered into in the ordinary course of business and includes obligations under our pension liabilities. |
| (3) | The timing for the return of the collateral associated with our securities lending program is uncertain; therefore, the return of collateral is reflected as being due in 2007. |
| (4) | Includes amounts we are committed to fund for U.S. commercial mortgage loans and interests in limited partnerships. |
| (5) | Includes estimated claim and benefit, policy surrender and commission obligations offset by expected future deposits and premiums on in-force insurance policies and investment contracts. Estimated claim and benefit obligations are based on mortality, morbidity and lapse assumptions comparable with our historical experience. In contrast to this table, our obligations recorded in the consolidated balance sheets do not incorporate future credited interest for investment contracts or tabular interest for insurance policies. Therefore, the estimated obligations for insurance liabilities presented in this table significantly exceed the liabilities recorded in reserves for future annuity and contract benefits and the liability for policy and contract claims. Due to the significance of the assumptions used, the amounts presented could materially differ from actual results. We have not included separate account obligations as these obligations are legally insulated from general account obligations and will be fully funded by cash flows from separate account assets. We expect to fully fund the obligations for insurance liabilities from cash flows from general account investments and future deposits and premiums. |
| (6) | Because their future cash outflows are uncertain, the following non-current liabilities are excluded from this table: deferred taxes (except the Tax Matters Agreement, which is included, as described in note 14 to our consolidated financial statements under “Item 8—Financial Statements and Supplementary Data”), derivatives, unearned premiums and certain other items. |
Off-Balance Sheet Transactions
We have used off-balance sheet securitization transactions to mitigate and diversify our asset risk position and to adjust the asset class mix in our investment portfolio by reinvesting securitization proceeds in accordance with our approved investment guidelines.
The transactions we have used involved securitizations of some of our receivables and investments that were secured by commercial mortgage loans, fixed maturities or other receivables, consisting primarily of policy loans. Total securitized assets remaining as of December 31, 2006 and 2005 were $1.8 billion and $1.5 billion, respectively.
Securitization transactions typically result in gains or losses that are included in net investment gains (losses) in our financial statements. We recognized an investment loss on sale of $11 million, net of tax, from a resecuritization transaction in 2006 as further discussed in note 19 in our consolidated financial statements under “Item 8 – Financial Statements and Supplementary Data.” There were no off-balance sheet securitization transactions executed in the years ended December 31, 2005 and 2004.
We have arranged for the assets that we have transferred in securitization transactions to be serviced by us directly, or pursuant to arrangements with a third-party service provider. Servicing activities include ongoing review, credit monitoring, reporting and collection activities.
We have entered into credit support arrangements in connection with our securitization transactions. Pursuant to these arrangements, as of December 31, 2006, we provided limited recourse for a maximum of $119 million of credit losses. To date, we have not been required to make any payments under any of the credit support agreements. These agreements will remain in place throughout the life of the related entities.
138
As part of our IPO, we issued $600 million of our Equity Units. These Equity Units consist of two separate and detachable contracts as follows:
| • | a contract to purchase shares of our Class A Common Stock, which we refer to as the stock purchase contracts or forward sale commitment; and |
| • | a $25 ownership interest in our 3.84% senior notes due in 2009. |
For a more complete description of the Equity Units, refer to note 13 in our consolidated financial statements under “Item 8—Financial Statements and Supplementary Data.” The stock purchase contract is, for accounting purposes, a derivative financial instrument indexed to and potentially settled in company stock. We have recorded the stock purchase contract in the equity section of our balance sheet. As such, this derivative financial instrument is not required to be marked to market through income and therefore was included in our balance sheet at the original value of $37 million. Had this forward sale commitment not qualified to be classified in equity, we would be required to record a derivative liability of $279 million and $308 million with a change in value of $28 million and $(158) million recorded currently in income as of and for the years ended December 31, 2006 and 2005, respectively.
Securitization Entities
GE Capital, our former indirect majority stockholder, provides credit and liquidity support to a funding conduit it sponsored, which exposes it to a majority of the risks and rewards of the conduit’s activities and therefore makes GE Capital the primary beneficiary of the funding conduit. Upon adoption of FASB Interpretation (“FIN”) No. 46, Consolidation of Variable Interest Entities, GE Capital was required to consolidate the funding conduit because of this financial support. As a result, assets and liabilities of certain previously off-balance sheet securitization entities, for which we were the transferor, were required to be included in our consolidated financial statements because the funding conduit no longer qualified as a third-party. The assets and liabilities associated with these securitization entities were reported in the corresponding financial statement captions in our consolidated balance sheet, and the assets are noted as restricted due to the lack of legal control we have over them. We applied the same accounting policies to these restricted assets and liabilities as we do to our unrestricted assets and liabilities.
As a result of GE Capital no longer having an ownership interest in us, in March 2006, the respective funding conduit re-qualified as a third-party and these securitization entities regained their qualifying status under SFAS No. 140, Accounting for Transfers and Servicing of Financial Assets and Extinguishment of Liabilities. As a result, the assets were effectively re-securitized and the related assets and liabilities were derecognized from our consolidated financial statements. This resulted in a reduction from December 31, 2005 balances of $685 million, $44 million, $660 million and $15 million of restricted investments held by securitization entities, other assets, borrowings related to securitization entities and other liabilities, respectively. We continue to hold a retained interest in the form of interest-only strips classified as fixed maturity securities available-for-sale in our consolidated balance sheets. We recognized an investment loss on sale of $11 million, net of tax, from this re-securitization transaction in 2006.
Seasonality
In general, our business as a whole is not seasonal in nature. However, in our Mortgage Insurance segment, the level of delinquencies, which increases the likelihood of losses, tends to decrease in the first and second quarters of the calendar year and increase in the third and fourth quarters. As a result, we have experienced lower levels of losses resulting from delinquencies in the first and second quarters, as compared with the third and fourth quarters.
139
Inflation
We do not believe that inflation has had a material effect on our results of operations, except insofar as inflation may affect interest rates.
New Accounting Standards
Recently adopted
For a discussion of recently adopted and not yet adopted accounting standards, see note 2 in our consolidated financial statements under “Item 8—Financial Statements and Supplementary Data.”
140
| Item 7A. | Quantitative and Qualitative Disclosures About Market Risk |
Market risk is the risk of the loss of fair value resulting from adverse changes in market rates and prices, such as interest rates, foreign currency exchange rates and equity prices. Market risk is directly influenced by the volatility and liquidity in the markets in which the related underlying financial instruments are traded. The following is a discussion of our market risk exposures and our risk management practices.
We enter into market-sensitive instruments primarily for purposes other than trading. The carrying value of our investment portfolio as of December 31, 2006 and 2005 was $69 billion and $67 billion, respectively, of which 80% and 81%, respectively, was invested in fixed maturities. The primary market risk to our investment portfolio is interest rate risk associated with investments in fixed maturities. We mitigate the market risk associated with our fixed maturities portfolio by closely matching the duration of our fixed maturities with the duration of the liabilities that those securities are intended to support.
The primary market risk for our long-term borrowings and Equity Units is interest rate risk at the time of maturity or early redemption, when we may be required to refinance these obligations. We continue to monitor the interest rate environment and to evaluate refinancing opportunities as maturity dates approach.
We are exposed to equity risk on our holdings of common stocks and other equities. We manage equity price risk through industry and issuer diversification and asset allocation techniques.
We also have exposure to foreign currency exchange risk. Our international operations generate revenues denominated in local currencies, and we invest cash generated outside the U.S. in non-U.S. denominated securities. Although investing in securities denominated in local currencies limits the effect of currency exchange rate fluctuation on local operating results, we remain exposed to the impact of fluctuations in exchange rates as we translate the operating results of our foreign operations into our historical combined financial statements. We currently do not hedge this exposure. For the years ended December 31, 2006, 2005 and 2004, 35%, 32% and 29%, respectively, of our net income from continuing operations were generated by our international operations.
We use derivative financial instruments, such as interest rate and foreign currency swaps, foreign currency forward contracts, financial futures and option-based financial instruments, as part of our risk management strategy. We use these derivatives to mitigate certain risks, including interest rate risk, currency risk and equity risk, by:
| • | reducing the risk between the timing of the receipt of cash and its investment in the market; |
| • | matching the currency of invested assets with the liabilities they support; |
| • | converting the asset duration to match the duration of the liabilities; |
| • | reducing our exposure to fluctuations in equity market indices that underlie some of our products; and |
| • | protecting against the early termination of an asset or liability. |
As a matter of policy, we have not and will not engage in derivative market-making, speculative derivative trading or other speculative derivatives activities.
Sensitivity analysis
Sensitivity analysis measures the impact of hypothetical changes in interest rates, foreign exchange rates and other market rates or prices on the profitability of market-sensitive financial instruments.
The following discussion about the potential effects of changes in interest rates, foreign currency exchange rates and equity market prices is based on so-called “shock-tests,” which model the effects of interest rate, foreign exchange rate and equity market price shifts on our financial condition and results of operations. Although we believe shock tests provide the most meaningful analysis permitted by the rules and regulations of the SEC, they are constrained by several factors, including the necessity to conduct the analysis based on a single point in time and by their inability to include the extraordinarily complex market reactions that normally would arise from the market shifts modeled. Although the following results of shock tests for changes in interest rates,
141
foreign currency exchange rates and equity market prices may have some limited use as benchmarks, they should not be viewed as forecasts. These forward-looking disclosures also are selective in nature and address only the potential impacts on our financial instruments. They do not include a variety of other potential factors that could affect our business as a result of these changes in interest rates, currency exchange rates and equity market prices.
One means of assessing exposure of our fixed maturities portfolio to interest rate changes is a duration-based analysis that measures the potential changes in market value resulting from a hypothetical change in interest rates of 100 basis points across all maturities. This is sometimes referred to as a parallel shift in the yield curve. Under this model, with all other factors constant and assuming no offsetting change in the value of our liabilities, we estimated that such an increase in interest rates would cause the market value of our fixed income securities portfolio to decline by approximately $2.8 billion before the effect of deferred taxes, DAC and PVFP, based on our securities positions as of December 31, 2006.
One means of assessing exposure to changes in foreign currency exchange rates is to model effects on reported income using a sensitivity analysis. We analyzed our combined currency exposure for the year ended December 31, 2006, including the results of our international operations financial instruments designated and effective as hedges to identify assets and liabilities denominated in currencies other than their relevant functional currencies. Net unhedged exposures in each currency were then remeasured, generally assuming a 10% decrease in currency exchange rates compared to the U.S. dollar. Under this model, with all other factors constant, we estimated that such a decrease would decrease our net income from continuing operations before income taxes by approximately $47 million.
One means of assessing exposure to changes in equity market prices is to estimate the potential changes in market values on our equity investments resulting from a hypothetical broad-based decline in equity market prices of 10%. Under this model, with all other factors constant, we estimated that such a decline in equity market prices would cause the market value of our equity investments to decline by approximately $5 million, based on our equity positions as of December 31, 2006. In addition, fluctuations in equity market prices affect our revenues and returns from our variable annuity and managed money products, which depend upon fees that are related primarily to the value of assets under management, in relation to total change in fair value of the hedged item.
Derivative counterparty credit risk
We manage our derivative counterparty credit risk on an individual counterparty basis, which means that gains and losses are netted for each counterparty to determine the amount at risk. When a counterparty exceeds credit exposure limits in terms of amounts owed to us, typically as the result of changes in market conditions, no additional transactions are executed until the exposure with that counterparty is reduced to an amount that is within the established limit. The swaps that are executed under master swap agreements containing mutual credit downgrade provisions that provide the ability to require assignment or replacement in the event either parties unsecured debt rating is downgraded below Moody’s “Baa” or S&P’s “BBB.”
Swaps and purchased options with contractual maturities longer than one year are conducted within the credit policy constraints provided in the table below. Our policy permits us to enter into derivative transactions with counterparties rated “A2” by Moody’s and “A” by S&P’s if the agreements governing such transactions require both parties to provide collateral in certain circumstances.
The following table sets forth derivative counterparty credit limits by credit rating:
| S&P rating |
Moody’s rating | Long-term (exposures over one year) net of collateral |
Aggregate limits (including those under one year) net of collateral |
Aggregate Limit (gross of collateral) | |||||||
| (Amounts in millions) | |||||||||||
| AAA |
Aaa | $ | 50 | $ | 125 | $ | 300 | ||||
| AA- |
Aa3 | 25 | 100 | 250 | |||||||
| A |
A2 | 15 | 90 | 200 | |||||||
142
| Item 8. | Financial Statements and Supplementary Data |
143
Report of Independent Registered Public Accounting Firm
The Board of Directors and Stockholders
Genworth Financial, Inc.:
We have audited the accompanying consolidated balance sheets of Genworth Financial, Inc. (the Company) as of December 31, 2006 and 2005, and the related consolidated statements of income, changes in stockholders’ equity, and cash flows for each of the years in the three-year period ended December 31, 2006. These consolidated financial statements are the responsibility of the Company’s management. Our responsibility is to express an opinion on these financial statements based on our audits.
We conducted our audits in accordance with the standards of the Public Company Accounting Oversight Board (United States). Those standards require that we plan and perform the audit to obtain reasonable assurance about whether the financial statements are free of material misstatement. An audit includes examining, on a test basis, evidence supporting the amounts and disclosures in the financial statements. An audit also includes assessing the accounting principles used and significant estimates made by management, as well as evaluating the overall financial statement presentation. We believe that our audits provide a reasonable basis for our opinion.
In our opinion, the consolidated financial statements referred to above present fairly, in all material respects, the financial position of Genworth Financial, Inc. as of December 31, 2006 and 2005, and the results of its operations and its cash flows for each of the years in the three-year period ended December 31, 2006, in conformity with U.S. generally accepted accounting principles.
As discussed in note 2 to the consolidated financial statements, the Company changed its method of accounting for share-based payments and pension and other postretirement plan obligations in 2006, and certain nontraditional long-duration contracts and separate accounts in 2004.
We also have audited, in accordance with the standards of the Public Company Accounting Oversight Board (United States), the effectiveness of Genworth Financial Inc.’s internal control over financial reporting as of December 31, 2006, based on criteria established in Internal Control—Integrated Framework issued by the Committee of Sponsoring Organizations of the Treadway Commission (COSO), and our report dated February 28, 2007 expressed an unqualified opinion on management’s assessment of, and the effective operation of, internal control over financial reporting.
/s/ KPMG LLP
Richmond, Virginia
February 28, 2007
144
Genworth Financial, Inc.
Consolidated Statements of Income
(Amounts in millions, except per share amounts)
| Years ended December 31, | |||||||||||
| 2006 | 2005 | 2004 | |||||||||
| Revenues: |
|||||||||||
| Premiums |
$ | 6,487 | $ | 6,297 | $ | 6,559 | |||||
| Net investment income |
3,837 | 3,536 | 3,648 | ||||||||
| Net investment gains (losses) |
(69 | ) | (2 | ) | 26 | ||||||
| Policy fees and other income |
774 | 673 | 824 | ||||||||
| Total revenues |
11,029 | 10,504 | 11,057 | ||||||||
| Benefits and expenses: |
|||||||||||
| Benefits and other changes in policy reserves |
4,485 | 4,205 | 4,804 | ||||||||
| Interest credited |
1,522 | 1,425 | 1,432 | ||||||||
| Acquisition and operating expenses, net of deferrals |
2,013 | 1,989 | 1,902 | ||||||||
| Amortization of deferred acquisition costs and intangibles |
727 | 794 | 1,064 | ||||||||
| Interest expense |
364 | 293 | 217 | ||||||||
| Total benefits and expenses |
9,111 | 8,706 | 9,419 | ||||||||
| Income from continuing operations before income taxes and cumulative effect of accounting change |
1,918 | 1,798 | 1,638 | ||||||||
| Provision for income taxes |
594 | 577 | 493 | ||||||||
| Income from continuing operations before cumulative effect of accounting change |
1,324 | 1,221 | 1,145 | ||||||||
| Gain (loss) on sale of discontinued operations, net of taxes |
— | — | 7 | ||||||||
| Income before cumulative effect of accounting change |
1,324 | 1,221 | 1,152 | ||||||||
| Cumulative effect of accounting change, net of taxes |
4 | — | 5 | ||||||||
| Net income |
$ | 1,328 | $ | 1,221 | $ | 1,157 | |||||
| Earnings per common share: |
|||||||||||
| Basic |
$ | 2.91 | $ | 2.57 | $ | 2.36 | |||||
| Diluted |
$ | 2.83 | $ | 2.52 | $ | 2.36 | |||||
| Weighted-average common shares outstanding: |
|||||||||||
| Basic |
455.9 | 475.3 | 489.5 | ||||||||
| Diluted |
469.4 | 484.6 | 490.5 | ||||||||
See Notes to Consolidated Financial Statements
145
Genworth Financial, Inc.
(Amounts in millions)
| December 31, | ||||||||
| 2006 | 2005 | |||||||
| Assets |
||||||||
| Investments: |
||||||||
| Fixed maturity securities available-for-sale, at fair value |
$ | 55,448 | $ | 53,937 | ||||
| Equity securities available-for-sale, at fair value |
197 | 206 | ||||||
| Commercial mortgage loans |
8,491 | 7,558 | ||||||
| Policy loans |
1,494 | 1,350 | ||||||
| Restricted investments held by securitization entities |
— | 685 | ||||||
| Other invested assets |
3,846 | 3,174 | ||||||
| Total investments |
69,476 | 66,910 | ||||||
| Cash and cash equivalents |
2,469 | 1,875 | ||||||
| Accrued investment income |
753 | 733 | ||||||
| Deferred acquisition costs |
6,325 | 5,586 | ||||||
| Intangible assets |
841 | 782 | ||||||
| Goodwill |
1,737 | 1,450 | ||||||
| Reinsurance recoverable |
17,554 | 18,245 | ||||||
| Other assets |
841 | 967 | ||||||
| Separate account assets |
10,875 | 9,106 | ||||||
| Total assets |
$ | 110,871 | $ | 105,654 | ||||
| Liabilities and stockholders’ equity |
||||||||
| Liabilities: |
||||||||
| Future annuity and contract benefits |
$ | 64,136 | $ | 63,749 | ||||
| Liability for policy and contract claims |
3,542 | 3,364 | ||||||
| Unearned premiums |
4,231 | 3,647 | ||||||
| Other policyholder liabilities |
441 | 507 | ||||||
| Other liabilities |
5,781 | 4,937 | ||||||
| Non-recourse funding obligations |
2,765 | 1,400 | ||||||
| Short-term borrowings |
199 | 152 | ||||||
| Long-term borrowings |
3,321 | 2,736 | ||||||
| Senior notes underlying equity units |
600 | 600 | ||||||
| Mandatorily redeemable preferred stock |
100 | 100 | ||||||
| Deferred tax liability |
1,550 | 1,386 | ||||||
| Borrowings related to securitization entities |
— | 660 | ||||||
| Separate account liabilities |
10,875 | 9,106 | ||||||
| Total liabilities |
97,541 | 92,344 | ||||||
| Commitments and contingencies |
||||||||
| Stockholders’ equity: |
||||||||
| Class A common stock, $0.001 par value; 1.5 billion shares authorized; 493 million and 404 million shares issued as of December 31, 2006 and 2005, respectively; 443 million and 385 million shares outstanding as of December 31, 2006 and 2005, respectively |
— | — | ||||||
| Class B common stock, $0.001 par value; 700 million shares authorized; zero and 86 million shares issued and outstanding as of December 31, 2006 and 2005, respectively |
— | — | ||||||
| Additional paid-in capital |
10,759 | 10,671 | ||||||
| Accumulated other comprehensive income: |
||||||||
| Net unrealized investment gains |
435 | 760 | ||||||
| Derivatives qualifying as hedges |
375 | 389 | ||||||
| Foreign currency translation and other adjustments |
347 | 255 | ||||||
| Total accumulated other comprehensive income |
1,157 | 1,404 | ||||||
| Retained earnings |
2,914 | 1,735 | ||||||
| Treasury stock, at cost (50 million shares and 19 million shares as of December 31, 2006 and 2005, respectively) |
(1,500 | ) | (500 | ) | ||||
| Total stockholders’ equity |
13,330 | 13,310 | ||||||
| Total liabilities and stockholders’ equity |
$ | 110,871 | $ | 105,654 | ||||
See Notes to Consolidated Financial Statements
146
Genworth Financial, Inc.
Consolidated Statements of Changes in Stockholders’ Equity
(Amounts in millions)
| Additional paid-in capital |
Accumulated other comprehensive income |
Retained earnings |
Treasury stock, at cost |
Total stockholders’ equity |
|||||||||||||||
| Balances as of December 31, 2003 |
$ | 8,377 | $ | 1,672 | $ | 5,751 | $ | — | $ | 15,800 | |||||||||
| Comprehensive income: |
|||||||||||||||||||
| Net income |
— | — | 1,157 | — | 1,157 | ||||||||||||||
| Net unrealized gains (losses) on investment securities |
— | (465 | ) | — | — | (465 | ) | ||||||||||||
| Derivatives qualifying as hedges |
— | 273 | — | — | 273 | ||||||||||||||
| Foreign currency translation and other adjustments |
— | 162 | — | — | 162 | ||||||||||||||
| Total comprehensive income |
1,127 | ||||||||||||||||||
| Dividends and other transactions with GE prior to our corporate formation |
2,190 | (34 | ) | (6,198 | ) | — | (4,042 | ) | |||||||||||
| Transactions subsequent to our corporate formation: |
|||||||||||||||||||
| Dividends to stockholders |
— | — | (64 | ) | — | (64 | ) | ||||||||||||
| Stock-based compensation |
29 | — | — | — | 29 | ||||||||||||||
| Capital contributions from GE |
16 | — | — | — | 16 | ||||||||||||||
| Balances as of December 31, 2004 |
10,612 | 1,608 | 646 | — | 12,866 | ||||||||||||||
| Comprehensive income: |
|||||||||||||||||||
| Net income |
— | — | 1,221 | — | 1,221 | ||||||||||||||
| Net unrealized gains (losses) on investment securities |
— | (259 | ) | — | — | (259 | ) | ||||||||||||
| Derivatives qualifying as hedges |
— | 121 | — | — | 121 | ||||||||||||||
| Foreign currency translation and other adjustments |
— | (66 | ) | — | — | (66 | ) | ||||||||||||
| Total comprehensive income |
1,017 | ||||||||||||||||||
| Acquisition of treasury stock |
— | — | — | (500 | ) | (500 | ) | ||||||||||||
| Dividends to stockholders |
— | — | (132 | ) | — | (132 | ) | ||||||||||||
| Stock-based compensation |
51 | — | — | — | 51 | ||||||||||||||
| Capital contributions from GE |
8 | — | — | — | 8 | ||||||||||||||
| Balances as of December 31, 2005 |
10,671 | 1,404 | 1,735 | (500 | ) | 13,310 | |||||||||||||
| Comprehensive income: |
|||||||||||||||||||
| Net income |
— | — | 1,328 | — | 1,328 | ||||||||||||||
| Net unrealized gains (losses) on investment securities |
— | (325 | ) | — | — | (325 | ) | ||||||||||||
| Derivatives qualifying as hedges |
— | (14 | ) | — | — | (14 | ) | ||||||||||||
| Foreign currency translation and other adjustments |
— | 123 | — | — | 123 | ||||||||||||||
| Cumulative effect of change in accounting, net of income taxes |
— | (31 | ) | — | — | (31 | ) | ||||||||||||
| Total comprehensive income |
1,081 | ||||||||||||||||||
| Acquisition of treasury stock |
— | — | — | (1,000 | ) | (1,000 | ) | ||||||||||||
| Dividends to stockholders |
— | — | (149 | ) | — | (149 | ) | ||||||||||||
| Stock-based compensation |
83 | — | — | — | 83 | ||||||||||||||
| Capital contributions from GE |
5 | — | — | — | 5 | ||||||||||||||
| Balances as of December 31, 2006 |
$ | 10,759 | $ | 1,157 | $ | 2,914 | $ | (1,500 | ) | $ | 13,330 | ||||||||
See Notes to Consolidated Financial Statements
147
Genworth Financial, Inc.
Consolidated Statements of Cash Flows
(Amounts in millions)
| Years ended December 31, | ||||||||||||
| 2006 | 2005 | 2004 | ||||||||||
| Cash flows from operating activities: |
||||||||||||
| Net income |
$ | 1,328 | $ | 1,221 | $ | 1,157 | ||||||
| Adjustments to reconcile net income to net cash provided from operating activities: |
||||||||||||
| Amortization of fixed maturity discounts and premiums |
18 | 59 | 81 | |||||||||
| Net investment (gains) losses |
69 | 2 | (26 | ) | ||||||||
| Charges assessed to policyholders |
(338 | ) | (331 | ) | (301 | ) | ||||||
| Acquisition costs deferred |
(1,266 | ) | (1,116 | ) | (957 | ) | ||||||
| Amortization of deferred acquisition costs and intangibles |
727 | 794 | 1,064 | |||||||||
| Deferred income taxes |
368 | 891 | (1,196 | ) | ||||||||
| Corporate overhead allocation |
— | — | 14 | |||||||||
| Cumulative effect of accounting changes, net of taxes |
(4 | ) | — | (5 | ) | |||||||
| Net (gain) loss from sale of discontinued operations |
— | — | (7 | ) | ||||||||
| Purchases of trading securities, net of proceeds from sales |
(96 | ) | — | — | ||||||||
| Change in certain assets and liabilities: |
||||||||||||
| Accrued investment income and other assets |
(27 | ) | (55 | ) | 959 | |||||||
| Insurance reserves |
3,180 | 2,696 | 2,566 | |||||||||
| Current tax liabilities |
55 | (363 | ) | 1,689 | ||||||||
| Other liabilities and other policy-related balances |
351 | (319 | ) | 567 | ||||||||
| Net cash from operating activities |
4,365 | 3,479 | 5,605 | |||||||||
| Cash flows from investing activities: |
||||||||||||
| Proceeds from maturities and repayments of investments: |
||||||||||||
| Fixed maturities |
6,211 | 5,797 | 5,854 | |||||||||
| Commercial mortgage loans |
1,132 | 1,036 | 866 | |||||||||
| Proceeds from sales of investments: |
||||||||||||
| Fixed maturities and equity securities |
7,286 | 2,943 | 4,336 | |||||||||
| Purchases and originations of investments: |
||||||||||||
| Fixed maturities and equity securities |
(14,729 | ) | (10,598 | ) | (14,952 | ) | ||||||
| Commercial mortgage loans |
(2,052 | ) | (2,529 | ) | (1,244 | ) | ||||||
| Other invested assets, net |
(92 | ) | 200 | 327 | ||||||||
| Policy loans, net |
(143 | ) | (126 | ) | (128 | ) | ||||||
| Payments for businesses purchased, net of cash acquired |
(511 | ) | — | (9 | ) | |||||||
| Proceeds from sale of discontinued operations, net of cash disposal |
— | — | 10 | |||||||||
| Net cash from investing activities |
(2,898 | ) | (3,277 | ) | (4,940 | ) | ||||||
| Cash flows from financing activities: |
||||||||||||
| Proceeds from issuance of investment contracts |
7,746 | 7,923 | 7,109 | |||||||||
| Redemption and benefit payments on investment contracts |
(9,511 | ) | (8,007 | ) | (7,163 | ) | ||||||
| Short-term borrowings and other, net |
60 | (407 | ) | (1,841 | ) | |||||||
| Proceeds from issuance of non-recourse funding obligations |
1,365 | 500 | 300 | |||||||||
| Proceeds from long-term borrowings |
598 | 348 | 1,895 | |||||||||
| Repayment of contingent note |
— | — | (550 | ) | ||||||||
| Cash transferred in connection with our corporate formation |
— | — | (838 | ) | ||||||||
| Dividends paid to stockholders |
(145 | ) | (128 | ) | (1,613 | ) | ||||||
| Stock-based compensation awards exercised |
49 | — | — | |||||||||
| Acquisition of treasury stock |
(1,000 | ) | (500 | ) | — | |||||||
| Capital contribution received from GE |
3 | 23 | 1,910 | |||||||||
| Net cash from financing activities |
(835 | ) | (248 | ) | (791 | ) | ||||||
| Effect of exchange rate changes on cash and cash equivalents |
(38 | ) | (42 | ) | 107 | |||||||
| Net change in cash and cash equivalents |
594 | (88 | ) | (19 | ) | |||||||
| Cash and cash equivalents at beginning of year |
1,875 | 1,963 | 1,982 | |||||||||
| Cash and cash equivalents at end of year |
$ | 2,469 | $ | 1,875 | $ | 1,963 | ||||||
See Notes to Consolidated Financial Statements
148
Genworth Financial, Inc.
Notes to Consolidated Financial Statements
Years Ended December 31, 2006, 2005 and 2004
(1) Nature of Business and Formation of Genworth
Genworth Financial, Inc. (“Genworth”) was incorporated in Delaware on October 23, 2003 in preparation for the corporate formation of certain insurance and related subsidiaries of the General Electric Company (“GE”) and an initial public offering of Genworth common stock, which was completed on May 28, 2004 (“IPO”). In connection with the IPO, Genworth acquired substantially all of the assets and liabilities of GE Financial Assurance Holdings, Inc. (“GEFAHI”). Prior to its IPO, Genworth was a wholly-owned subsidiary of GEFAHI. GEFAHI is an indirect subsidiary of General Electric Capital Corporation (“GE Capital”), which in turn is an indirect subsidiary of GE. Prior to the corporate formation, GEFAHI was a holding company for a group of companies that provide life insurance, long-term care insurance, medical supplement insurance, group life and health insurance, annuities, investment products and services, and U.S. mortgage insurance. At the same time, Genworth also acquired certain other insurance businesses previously owned by other GE subsidiaries. These businesses included international mortgage insurance, payment protection insurance, a Bermuda reinsurer, and mortgage contract underwriting.
As of December 31, 2006 we had the following three operating segments:
| • | Protection. In the United States, we are a leading provider of life insurance and long-term care insurance, have developed linked benefit products such as long-term care insurance linked with life insurance or an annuity and offer selected senior services and products including Medicare supplement insurance. We also offer group life and health insurance primarily to companies with fewer than 1,000 employees. In January 2007, we announced an agreement to sell the group life and health business and expect to close the transaction in the second quarter of 2007. Outside the U.S., we offer payment protection insurance, which helps consumers meet specified payment obligations should they become unable to pay due to accident, illness, involuntary unemployment, disability or death. |
| • | Retirement Income and Investments. We offer our U.S. customers a variety of wealth accumulation, income distribution and institutional investment products. Retail products include: individual fixed and variable annuities; group variable annuities offered through retirement plans; single premium immediate annuities; variable life insurance; and a variety of managed account programs and services, financial planning advisory services and managed proprietary and third-party mutual funds. Institutional products include: funding agreements and funding agreements backing notes (“FABNs”), asset management products and services and guaranteed investment contracts (“GICs”). |
| • | Mortgage Insurance. In the U.S., Canada, Australia, New Zealand, Mexico, Japan and multiple European countries, we offer mortgage insurance products that enable borrowers to buy homes with low-down-payments. We also provide mortgage insurance on a structured, or bulk basis, that aids in the sale of mortgages to the capital markets, and which helps lenders manage capital and risks. Additionally, we offer services, analytical tools and technology that enable lenders to operate more efficiently and more effectively manage risk. |
Our Corporate and Other activities include debt financing expenses that are incurred at our holding company level, unallocated corporate income and expenses, and the results of a small, non-core business that is managed outside our operating segments.
In consideration for the assets and liabilities Genworth acquired in connection with the corporate formation, Genworth issued to GEFAHI 489.5 million shares of its Class B Common Stock, $600 million of its 6.00% Equity Units (“Equity Units”), $100 million of its 5.25% Series A Cumulative Preferred Stock (“Series A Preferred Stock”) which is mandatorily redeemable, a $2.4 billion short-term note, and a $550 million contingent
149
Genworth Financial, Inc.
Notes to Consolidated Financial Statements—(Continued)
Years Ended December 31, 2006, 2005 and 2004
non-interest-bearing note (“Contingent Note”). The liabilities Genworth assumed included ¥60 billion aggregate principal amount of 1.6% notes due 2011 issued by GEFAHI. The transactions above, which are accounted for at book value as transfers between entities under common control, are referred to as our corporate formation. Class A Common Stock and Class B Common Stock have identical voting rights, except Class B shares have approval rights over certain corporate actions and rights with respect to the election and removal of directors. Shares of Class B Common Stock convert automatically into shares of Class A Common Stock when they are held by any person other than GE or an affiliate of GE or when GE no longer beneficially owns at least 10% of our outstanding common stock. As a result, all of the 146.4 million shares of common stock sold in Genworth’s IPO consisted of Class A Common Stock.
In December, September and March 2005, GE completed secondary public offerings of 40.9 million, 116.2 million and 80.5 million shares of our Class B Common Stock, respectively. The 237.6 million shares were automatically converted to Class A Common Stock upon the sale of these shares to the public. Concurrently with the March 2005 secondary offering, we repurchased 19.4 million shares of Class B Common Stock from GE at a price of $25.811 per share (a price equal to the net proceeds per share received by the selling stockholder from the underwriters), which were automatically converted to Class A Common Stock upon the transfer of these shares to us and recorded at cost as treasury stock. We did not receive any of the proceeds from these secondary offerings. As of December 31, 2005, approximately 82% of our common stock was owned by public stockholders, and approximately 18% of our common stock was beneficially owned by GE.
On March 8, 2006, GE completed its final secondary offering of 71.2 million shares of our Class B Common Stock. The 71.2 million shares were automatically converted to Class A Common Stock upon the sale of these shares to the public. We did not receive any proceeds in this offering. Concurrently with this offering, we repurchased 15.0 million shares of Class B Common Stock from GE at a price of $31.93125 per share (the net proceeds per share received by the selling stockholder from the underwriters), which is recorded at cost as treasury stock in our consolidated balance sheet. As a result of these transactions, GE no longer owns any of our outstanding common stock.
For the periods prior to our corporate formation, our consolidated financial statements include the accounts of certain indirect subsidiaries and businesses of GE that represent the predecessor of Genworth. The companies and businesses included in the predecessor combined financial statements are GEFAHI, Financial Insurance Company Ltd., FIG Ireland Ltd., WorldCover Direct Ltd., RD Plus S.A., CFI Administrators Ltd., Financial Assurance Company Ltd., Financial Insurance Group Services Ltd., Consolidated Insurance Group Ltd., Viking Insurance Co. Ltd., Genworth Financial Mortgage Insurance Ltd., GE Mortgage Insurance Pty Ltd., Genworth Mortgage Insurance Ltd., Genworth Financial Mortgage Insurance Company Canada, GE Capital Mortgage Insurance Corp. (Australia) Pty Ltd., Genworth Financial Investment Services, Inc., GE Capital Insurance Agency, Inc., CFI Pension Trustees Ltd., Financial Insurance Guernsey PCC Ltd., GE Financial Assurance Compania De Seguros y Reaseguros de Vida S.A., GE Financial Insurance Compania De Seguros y Reaseguros S.A., and GE Residential Connections Corp., Assocred SA, Ennington Properties Limited and the consumer protection insurance business of Vie Plus S.A. All of the combined companies were indirect subsidiaries of GE. For these periods, we refer to the combined predecessor companies and businesses as the “Company”, “we”, “us”, or “our” unless the context otherwise requires.
For the periods subsequent to our reorganization, the accompanying financial statements include on a consolidated basis the accounts of Genworth and our affiliate companies in which we hold a majority voting or economic interest, which for these periods we refer to as the “Company,” “we”, “us”, or “our” unless the context otherwise requires.
150
Genworth Financial, Inc.
Notes to Consolidated Financial Statements—(Continued)
Years Ended December 31, 2006, 2005 and 2004
(2) Summary of Significant Accounting Policies
Our financial statements have been prepared on the basis of U.S. generally accepted accounting principles (“U.S. GAAP”). Preparing financial statements in conformity with U.S. GAAP requires us to make estimates and assumptions that affect reported amounts and related disclosures. Actual results could differ from those estimates. All significant intercompany accounts and transactions have been eliminated in consolidation. Certain prior year amounts have been reclassified to conform to the current year presentation.
a) Premiums
For traditional long-duration insurance contracts, we report premiums as earned when due. For short-duration insurance contracts, we report premiums as revenue over the terms of the related insurance policies on a pro-rata basis or in proportion to expected claims.
For single premium mortgage insurance contracts, we report premiums over the estimated policy life in accordance with the expected pattern of risk emergence as further described in our accounting policy for unearned premiums.
Premiums received under annuity contracts without significant mortality risk and premiums received on investment and universal life products are not reported as revenues but rather as deposits and are included in liabilities for future annuity and contract benefits.
b) Net Investment Income and Net Investment Gains and Losses
Investment income is recognized when earned. Investment gains and losses are calculated on the basis of specific identification.
Investment income on mortgage-backed and asset-backed securities is initially based upon yield, cash flow, and prepayment assumptions at the date of purchase. Subsequent revisions in those assumptions are recorded using the retrospective or prospective method. Under the retrospective method, used for mortgage-backed and asset-backed securities of high credit quality (ratings equal to or greater than AA or that are U.S. Agency backed) which cannot be contractually prepaid, amortized cost of the security is adjusted to the amount that would have existed had the revised assumptions been in place at the date of purchase. The adjustments to amortized cost are recorded as a charge or credit to net investment income. Under the prospective method, which is used for all other mortgage-backed and asset-backed securities, future cash flows are estimated and interest income is recognized going forward using the new internal rate of return. As of December 31, 2006, all our mortgage-backed and asset-backed securities that have had subsequent revisions in yield, cash flow or prepayment assumptions are accounted for under the retrospective method.
c) Policy Fees and Other Income
Policy fees and other income consists primarily of insurance charges assessed on universal life contracts, fees assessed against policyholder account values and commission income. Charges to policyholder accounts for universal life cost of insurance are recognized as revenue when due. Variable product fees are charged to variable annuity and variable life policyholders based upon the daily net assets of the policyholder’s account values and are recognized as revenue when charged. Policy surrender fees are recognized as income when the policy is surrendered.
151
Genworth Financial, Inc.
Notes to Consolidated Financial Statements—(Continued)
Years Ended December 31, 2006, 2005 and 2004
d) Fixed Maturity and Equity Securities
We have designated our investment securities as either available-for-sale or trading and report them in our Consolidated Balance Sheets at fair value. We obtain values for actively traded securities from external pricing services. We determine the appropriate classification of investments securities at the time of purchase. For infrequently traded securities, we obtain quotes from brokers, or we estimate values using internally developed pricing models. These models are based upon common valuation techniques and require us to make assumptions regarding credit quality, liquidity and other factors that affect estimated values. Changes in the fair value of available-for-sale investments, net of the effect on deferred acquisition costs (“DAC”), present value of future profits (“PVFP”) and deferred income taxes, are reflected as unrealized investment gains or losses in a separate component of accumulated other comprehensive income. Realized and unrealized gains and losses related to trading securities are reflected in net investment gains (losses). Trading securities are included in other invested assets in our Consolidated Balance Sheets.
We regularly review investment securities for impairment in accordance with our impairment policy, which includes both quantitative and qualitative criteria. Quantitative criteria include length of time and amount that each security is in an unrealized loss position, and for fixed maturities, whether the issuer is in compliance with terms and covenants of the security. Qualitative criteria include the financial strength and specific prospects for the issuer as well as our intent to hold the security until recovery. Securities that in our judgment are considered to be other-than-temporarily impaired are recognized as a charge to net investment gains (losses) in the period in which such determination is made.
e) Commercial Mortgage Loans
Commercial mortgage loans are stated at principal amounts outstanding, net of deferred expenses and allowance for loan loss. Interest on loans is recognized on an accrual basis at the applicable interest rate on the principal amount outstanding. Loan origination fees and direct costs as well as premiums and discounts are amortized as level yield adjustments over the respective loan terms. Unamortized net fees or costs are recognized upon early repayment of the loans. Loan commitment fees are generally deferred and amortized on an effective yield basis over the term of the loan. Impaired loans are generally carried on a non-accrual status. Loans are ordinarily placed on non-accrual status when, in management’s opinion, the collection of principal or interest is unlikely, or when the collection of principal or interest is 90 days or more past due.
The allowance for loan losses is maintained at a level that management determines is adequate to absorb estimated probable incurred losses in the loan portfolio. Management’s evaluation process to determine the adequacy of the allowance utilizes an analytical model based on historical loss experience, adjusted for current events, trends and economic conditions. The actual amounts realized could differ in the near term from the amounts assumed in arriving at the allowance for loan losses reported in the consolidated financial statements.
All losses of principal are charged to the allowance for loan losses in the period in which the loan is deemed to be uncollectible. Additions and reductions are made to the allowance through periodic provisions or benefits to net investment gains (losses).
f) Cash and Cash Equivalents
Certificates of deposit, money market funds, and other time deposits with original maturities of less than 90 days are considered cash equivalents in the Consolidated Balance Sheets and Consolidated Statements of Cash Flows. Items with maturities greater than 90 days but less than one year at the time of acquisition are included in short-term investments.
152
Genworth Financial, Inc.
Notes to Consolidated Financial Statements—(Continued)
Years Ended December 31, 2006, 2005 and 2004
g) Securities Lending Activity and Repurchase Agreements
We engage in certain securities lending transactions for the purpose of enhancing the yield on our investment securities portfolio, which require the borrower to provide collateral, primarily consisting of cash and government securities, on a daily basis, in amounts equal to or exceeding 102% of the fair value of the applicable securities loaned. We maintain effective control over all loaned securities and, therefore, continue to report such securities as fixed maturity securities in the Consolidated Balance Sheets. Cash and non-cash collateral, such as a security, received by us on securities lending transactions is reflected in other invested assets with an offsetting liability recognized in other liabilities for the obligation to return the collateral. The fair value of collateral held is $2.0 billion and $1.8 billion as of December 31, 2006 and 2005, respectively. We had non-cash collateral of $35 million and $39 million as of December 31, 2006 and 2005, respectively.
We engage in a repurchase program for the purpose of enhancing the yield on our investment securities portfolio in which we sell a security at a specified price and agree to repurchase that security at another specified price at a later date. Repurchase agreements are treated as collateralized financing transactions and are carried at the amounts at which the securities will be subsequently reacquired, including accrued interest, as specified in the respective agreement. The market value of securities to be repurchased is monitored and collateral levels are adjusted where appropriate to protect the counterparty against credit exposure. Cash received is invested in fixed maturities. At December 31, 2006, the fair value of the securities pledged under the repurchase program totaled $712 million and the offsetting repurchase obligation of $690 million is included in other liabilities on the Consolidated Balance Sheets.
h) Deferred Acquisition Costs
Acquisition costs include costs, which vary with and are primarily related to the acquisition of insurance and investment contracts. Such costs are deferred and amortized as follows:
Long-Duration Contracts. Acquisition costs include commissions in excess of ultimate renewal commissions, solicitation and printing costs, sales material and some support costs, such as underwriting and contract and policy issuance expenses. Amortization for traditional long-duration insurance products is determined as a level proportion of premium based on commonly accepted actuarial methods and reasonable assumptions about mortality, morbidity, lapse rates, expenses and future yield on related investments established when the contract or policy is issued. Amortization is adjusted each period to reflect policy lapse or termination rates as compared to anticipated experience. Amortization for annuity contracts without significant mortality risk and investment and universal life products is based on estimated gross profits. Estimated gross profits are adjusted quarterly to reflect actual experience to date or for the unlocking of underlying key assumptions based on experience studies.
Short-Duration Contracts. Acquisition costs consist primarily of commissions and premium taxes and are amortized ratably over the terms of the underlying policies.
We regularly review all of these assumptions and periodically test DAC for recoverability. For deposit products, if the current present value of estimated future gross profits is less than the unamortized DAC for a line of business, a charge to income is recorded for additional DAC amortization. For other products, if the benefit reserve plus anticipated future premiums and interest income for a line of business are less than the current estimate of future benefits and expenses (including any unamortized DAC), a charge to income is recorded for additional DAC amortization or for increased benefit reserves. For the years ended December 31, 2006, 2005 and 2004, there were no significant charges to income recorded as a result of our DAC recoverability testing.
153
Genworth Financial, Inc.
Notes to Consolidated Financial Statements—(Continued)
Years Ended December 31, 2006, 2005 and 2004
i) Intangible Assets
Present Value of Future Profits. In conjunction with the acquisition of a block of insurance policies or investment contracts, a portion of the purchase price is assigned to the right to receive future gross profits arising from existing insurance and investment contracts. This intangible asset, called PVFP, represents the actuarially estimated present value of future cash flows from the acquired policies. PVFP is amortized, net of accreted interest, in a manner similar to the amortization of DAC.
We regularly review all of these assumptions and periodically test PVFP for recoverability. For deposit products, if the current present value of estimated future gross profits is less than the unamortized PVFP for a line of business, a charge to income is recorded for additional PVFP amortization. For other products, if the benefit reserve plus anticipated future premiums and interest income for a line of business are less than the current estimate of future benefits and expenses (including any unamortized PVFP), a charge to income is recorded for additional PVFP amortization or for increased benefit reserves. For the years ended December 31, 2006, 2005 and 2004, no charges to income were recorded as a result of our PVFP recoverability testing.
Deferred Sales Inducements to Contractholders. We defer sales inducements to contractholders for features on variable annuities that entitle the contractholder to an incremental amount to be credited to the account value upon making a deposit, and for fixed annuities with crediting rates higher than the contract’s expected ongoing crediting rates for periods after the inducement. Deferred sales inducements to contractholders are reported as a separate intangible asset and amortized in benefits and other changes in policy reserves using the same methodology and assumptions used to amortize DAC.
Other Intangible Assets. We amortize the costs of other intangibles over their estimated useful lives unless such lives are deemed indefinite. Amortizable intangible assets are tested for impairment at least annually based on undiscounted cash flows, which requires the use of estimates and judgment, and, if impaired, written down to fair value based on either discounted cash flows or appraised values. Intangible assets with indefinite lives are tested at least annually for impairment and written down to fair value as required.
j) Goodwill
Goodwill is not amortized but is tested for impairment at least annually using a fair value approach, which requires the use of estimates and judgment, at the “reporting unit” level. A reporting unit is the operating segment, or a business one level below that operating segment (the “component” level) if discrete financial information is prepared and regularly reviewed by management at the component level. We recognize an impairment charge for any amount by which the carrying amount of a reporting unit’s goodwill exceeds its fair value. We use discounted cash flows to establish fair values. When available and as appropriate, we use comparative market multiples to corroborate discounted cash flow results. When a business within a reporting unit is disposed of, goodwill is allocated to the business using the relative fair value methodology to measure the gain or loss on disposal. For the years ended December 31, 2006, 2005 and 2004, no charges were recorded as a result of our goodwill impairment testing.
k) Reinsurance
Premium revenue, benefits and operating expenses are reported net of the amounts relating to reinsurance ceded to and assumed from other companies. Amounts due from reinsurers for incurred and estimated future claims are reflected in the reinsurance recoverable asset. The cost of reinsurance is accounted for over the terms of the related treaties using assumptions consistent with those used to account for the underlying reinsured policies. Premium revenue, benefits and acquisition and operating expenses, net of deferrals, for reinsurance assumed contracts that do not qualify for reinsurance accounting are accounted for under the deposit method of accounting.
154
Genworth Financial, Inc.
Notes to Consolidated Financial Statements—(Continued)
Years Ended December 31, 2006, 2005 and 2004
l) Derivatives
Derivative financial instruments are used to manage risk through one of four principal risk management strategies including (i) liabilities, (ii) invested assets, (iii) portfolios of assets or liabilities, and (iv) forecasted transactions.
On the date we enter into a derivative contract, management designates the derivative as a hedge of the identified exposure (fair value, cash flow or foreign currency). If a derivative does not qualify for hedge accounting, according to Financial Accounting Standards Board (“FASB”) Statement of Financial Accounting Standards (“SFAS”) No. 133, Accounting for Derivative Instruments and Hedging Activities, as amended, the changes in its fair value and all scheduled periodic settlement receipts and payments are reported in income.
We formally document all relationships between hedging instruments and hedged items, as well as our risk management objective and strategy for undertaking various hedge transactions. In this documentation, we specifically identify the asset, liability, or forecasted transaction that has been designated as a hedged item, state how the hedging instrument is expected to hedge the risks related to the hedged item, and set forth the method that will be used to retrospectively and prospectively assess the hedging instrument’s effectiveness and the method that will be used to measure hedge ineffectiveness. We generally determine hedge effectiveness based on total changes in fair value of a derivative instrument.
We discontinue hedge accounting prospectively when: (i) it is determined that the derivative is no longer effective in offsetting changes in the fair value or cash flows of a hedged item; (ii) the derivative expires or is sold, terminated, or exercised; (iii) the derivative is de-designated as a hedge instrument; or (iv) it is probable that the forecasted transaction will not occur.
We designate and account for the following as cash flow hedges, when they have met the effectiveness requirements of SFAS No.133: (i) various types of interest rate swaps to convert floating rate investments to fixed rate investments; (ii) various types of interest rate swaps to convert floating rate liabilities into fixed rate liabilities; (iii) receive U.S. dollar fixed on foreign currency swaps to hedge the foreign currency cash flow exposure of foreign currency denominated investments; (iv) pay U.S. dollar fixed on foreign currency swaps to hedge the foreign currency cash flow exposure on liabilities denominated in foreign currencies; and (v) other instruments to hedge the cash flows of various other forecasted transactions. For all qualifying and highly effective cash flow hedges, the effective portion of changes in fair value of the derivative instrument is reported as a component of other comprehensive income. The ineffective portion of changes in fair value of the derivative instrument is reported as a component of income.
We designate and account for the following as fair value hedges when they have met the effectiveness requirements of SFAS No.133: (i) various types of interest rate swaps to convert fixed rate investments to floating rate investments; (ii) various types of interest swaps to convert fixed rate liabilities into floating rate liabilities; and (iii) other instruments to hedge various other fair value exposures of investments. For all qualifying and highly effective fair value hedges, the changes in fair value of the derivative instrument are reported in income. In other situations in which hedge accounting is discontinued on a cash flow hedge, amounts previously deferred in other comprehensive income are reclassified into income when income is impacted by the variability of the cash flow of the hedged item. In addition, changes in fair value attributable to the hedged portion of the underlying instrument are reported in income.
When hedge accounting is discontinued because it is determined that the derivative no longer qualifies as an effective fair value hedge, the derivative continues to be carried on the Consolidated Balance Sheets at its fair value, but the hedged asset or liability will no longer be adjusted for changes in fair value. When hedge
155
Genworth Financial, Inc.
Notes to Consolidated Financial Statements—(Continued)
Years Ended December 31, 2006, 2005 and 2004
accounting is discontinued because it is probable that a forecasted transaction will not occur, the derivative continues to be carried on the Consolidated Balance Sheets at its fair value, and gains and losses that were accumulated in other comprehensive income are recognized immediately in income. When the hedged forecasted transaction is no longer probable, but is reasonably possible, the accumulated gain or loss remains in other comprehensive income and is recognized when the transaction affects income; however, prospective hedge accounting for the transaction is terminated. In all other situations in which hedge accounting is discontinued, the derivative is carried at its fair value on the Consolidated Balance Sheets, with changes in its fair value recognized in the current period as income.
We may enter into contracts that are not themselves derivative instruments but contain embedded derivatives. For each contract, we assess whether the economic characteristics of the embedded derivative are clearly and closely related to those of the host contract and determine whether a separate instrument with the same terms as the embedded instrument would meet the definition of a derivative instrument.
If it is determined that the embedded derivative possesses economic characteristics that are not clearly and closely related to the economic characteristics of the host contract, and that a separate instrument with the same terms would qualify as a derivative instrument, the embedded derivative is separated from the host contract and accounted for as a stand-alone derivative. Such embedded derivatives are recorded on the Consolidated Balance Sheets at fair value and are classified consistent with their host contract. Changes in their fair value are recognized in the current period in income. If we are unable to properly identify and measure an embedded derivative for separation from its host contract, the entire contract is carried on the Consolidated Balance Sheets at fair value, with changes in fair value recognized in the current period in income.
m) Separate Accounts
The separate account assets represent funds for which the investment income and investment gains and losses accrue directly to the variable annuity contractholders and variable life policyholders. We assess mortality risk fees and administration charges on the variable mutual fund portfolios. The separate account assets are carried at fair value and are at least equal to the liabilities that represent the policyholders’ equity in those assets.
n) Future Annuity and Contract Benefits
Future annuity and contract benefits consist of the liability for investment contracts, insurance contracts and accident and health contracts. Investment contract liabilities are generally equal to the policyholder’s current account value. The liability for life insurance and accident and health contracts is calculated based upon actuarial assumptions as to mortality, morbidity, interest, expense and withdrawals, with experience adjustments for adverse deviation where appropriate.
o) Liability for Policy and Contract Claims
The liability for policy and contract claims represents the amount needed to provide for the estimated ultimate cost of settling claims relating to insured events that have occurred on or before the end of the respective reporting period. The estimated liability includes requirements for future payments of (a) claims that have been reported to the insurer, (b) claims related to insured events that have occurred but that have not been reported to the insurer as of the date the liability is estimated, and (c) claim adjustment expenses. Claim adjustment expenses include costs incurred in the claim settlement process such as legal fees and costs to record, process and adjust claims.
For our mortgage insurance policies, reserves for losses and loss adjustment expenses are based on notices of mortgage loan defaults and estimates of defaults that have been incurred but have not been reported by loan
156
Genworth Financial, Inc.
Notes to Consolidated Financial Statements—(Continued)
Years Ended December 31, 2006, 2005 and 2004
servicers, using assumptions of claim rates for loans in default and the average amount paid for loans that result in a claim. As is common accounting practice in the mortgage insurance industry and in accordance with U.S. GAAP, loss reserves are not established for future claims on insured loans that are not currently in default. During the fourth quarter of 2006, we performed a periodic update of our Australian loss reserve factors which resulted in a $34 million increase in our reserves for losses and loss adjustment expenses.
Management considers the liability for policy and contract claims provided to be satisfactory to cover the losses that have occurred. Management monitors actual experience, and where circumstances warrant, will revise its assumptions. The methods of determining such estimates and establishing the reserves are reviewed continuously and any adjustments are reflected in operations in the period in which they become known. Future developments may result in losses and loss expenses greater or less than the liability for policy and contract claims provided.
p) Unearned Premiums
For single premium insurance contracts, we recognize premiums over the policy life in accordance with the expected pattern of risk emergence. We recognize a portion of the revenue in premiums earned in the current period, while the remaining portion is deferred as unearned premiums and earned over time in accordance with the expected pattern of risk emergence. If single premium policies are canceled and the premium is non-refundable, then the remaining unearned premium related to each cancelled policy is recognized to earned premiums upon notification of the cancellation. Expected pattern of risk emergence on which we base premium recognition is inherently judgmental and is based on actuarial analysis of historical experience. We periodically review our premium earnings recognition models with any adjustments to the estimates reflected in current period income. For the years ended December 31, 2006 and 2005, we updated our premium recognition models for our international mortgage insurance business. This update included the consideration of recent and projected loss experience and refinement of actuarial methods, which this update and cancellations resulted in an increase in earned premium of $74 million and $21 million, respectively.
q) Employee Benefit Plans
We provide employees with a defined contribution pension plan and recognize expense throughout the year based on the employee’s age, service and eligible pay. We make an annual contribution to the plan. We also provide employees with defined contribution savings plans. We recognize expense for our contributions to the savings plans at the time employees make contributions to the plans.
Some employees participate in defined benefit pension and postretirement benefit plans. We recognize expense for these plans based upon actuarial valuations performed by external experts. We estimate aggregate benefits by using assumptions for employee turnover, future compensation increases, rates of return on pension plan assets and future health care costs. We recognize an expense for differences between actual experience and estimates over the average future service period of participants.
r) Income Taxes
We account for income taxes in accordance with SFAS No. 109, Accounting for Income Taxes. The deferred tax assets and/or liabilities are determined by multiplying the differences between the financial reporting and tax reporting bases for assets and liabilities by the enacted tax rates expected to be in effect when such differences are recovered or settled. The effect on deferred taxes of a change in tax rates is recognized in income in the period that includes the enactment date. Valuation allowances on deferred tax assets are estimated based on the Company’s assessment of the realizability of such amounts.
157
Genworth Financial, Inc.
Notes to Consolidated Financial Statements—(Continued)
Years Ended December 31, 2006, 2005 and 2004
For periods prior to our corporate reorganization, our non-life insurance entities were included in the consolidated federal income tax return of GE and subject to a tax-sharing arrangement that allocates tax on a separate company basis, but provides benefit for current utilization of losses and credits. For periods prior to 2004, our U.S. life insurance entities filed a consolidated life insurance federal income tax return separate from GE and are subject to a separate tax-sharing agreement, as approved by state insurance regulators, which also allocates taxes on a separate company basis but provides benefit for current utilization of losses and credits. For 2004, through the date of our corporate reorganization, our U.S. life insurance entities were included in the consolidated federal income tax return of GE, and subject to separate company principles similar to those applicable to our non-life insurance entities. Intercompany balances under all agreements are settled at least annually.
Effective with our corporate reorganization, our U.S. non-life insurance entities are included in the consolidated federal income tax return of Genworth and subject to a tax-sharing arrangement that allocates tax on a separate company basis, but provides benefit for current utilization of losses and credits. Also effective with our corporate reorganization, our U.S. life insurance entities file a consolidated life insurance federal income tax return, and are subject to a separate tax-sharing agreement, as approved by state insurance regulators, which allocates taxes on a separate company basis but provides benefit for current utilization of losses and credits.
s) Foreign Currency Translation
The determination of the functional currency is made based on the appropriate economic and management indicators. The assets and liabilities of foreign operations are translated into U.S. dollars at the exchange rates in effect at the Consolidated Balance Sheet date. Translation adjustments are included as a separate component of accumulated other comprehensive income. Revenue and expenses of the foreign operations are translated into U.S. dollars at the average rates of exchange prevailing during the year. Gains and losses from foreign currency transactions are reported in income and have not been material in all years presented in our Consolidated Statements of Income.
t) Accounting Changes
Accounting for Stock-Based Compensation
On January 1, 2006, we adopted SFAS No. 123R, Share-Based Payment, an amendment of SFAS No. 123, Accounting for Stock-Based Compensation. We adopted SFAS No. 123R under the modified prospective transition method. The statement requires companies to recognize the grant-date fair value of options and other equity-based awards within the income statement over the respective vesting period of the awards. We adopted SFAS No. 123 effective January 1, 2002 and, as permitted, we determined a grant date fair value using a Black-Scholes model (“Black-Scholes Model”) and recognized the related compensation expense through the income statement for all equity awards issued subsequent to January 1, 2002. As a result of the adoption of SFAS No. 123R, we will continue to recognize the remaining portion of the requisite service under previously granted unvested awards including those awards granted prior to January 1, 2002. Prior to the adoption of SFAS No. 123R, we adjusted compensation cost related to forfeiture of awards when the actual forfeiture occurred. SFAS No. 123R requires forfeitures to be estimated at the time of grant and revised, if necessary, in subsequent periods if actual forfeitures differ from those estimates and requires companies which previously accounted for forfeitures on an occurrence basis to include in income of the period of adoption a cumulative effect of a change in accounting principle for the adjustment to reflect estimated forfeitures for prior periods. On January 1, 2006, we recognized an increase to net income of $4 million related to the cumulative effect of a change in accounting principle for the adoption of SFAS No. 123R. See note 16 for additional information.
158
Genworth Financial, Inc.
Notes to Consolidated Financial Statements—(Continued)
Years Ended December 31, 2006, 2005 and 2004
Accounting for Certain Hybrid Financial Instruments
As of January 1, 2006, we adopted SFAS No. 155, Accounting for Certain Hybrid Financial Instruments. SFAS No. 155 amends SFAS No. 133, Accounting for Derivative Instruments and Hedging Activities, and SFAS No. 140, Accounting for Transfers and Servicing of Financial Assets and Extinguishments of Liabilities. SFAS No. 155 allows financial instruments that have embedded derivatives to be accounted for as a whole, eliminating the need to bifurcate the derivative from its host, if the holder elects to account for the whole instrument on a fair value basis. In addition, among other changes, SFAS No. 155 (i) clarifies which interest-only strips and principal-only strips are not subject to the requirements of SFAS No. 133; (ii) establishes a requirement to evaluate interests in securitized financial assets to identify interests that are freestanding derivatives or that are hybrid financial instruments that contain an embedded derivative requiring bifurcation; (iii) clarifies that concentrations of credit risk in the form of subordination are not embedded derivatives; and (iv) eliminates the prohibition on a qualifying special-purpose entity (“QSPE”) from holding a derivative financial instrument that pertains to a beneficial interest other than another derivative financial interest. Adoption of SFAS No. 155 did not have a material impact on our consolidated financial statements.
Accounting for Defined Benefit, Pension and Other Postretirement Plans
On December 31, 2006, we adopted SFAS No. 158, Employers’ Accounting for Defined Benefit Pension and Other Postretirement Plans that was adopted at December 31, 2006. This statement requires an employer to recognize the overfunded or underfunded status of a defined benefit plan as an asset or liability in its statement of financial position and to recognize changes in that funded status in the year in which the changes occur through comprehensive income. The adoption of SFAS No. 158 resulted in a $31 million reduction of comprehensive income on our Consolidated Balance Sheet as of December 31, 2006.
u) Accounting Pronouncements Not Yet Adopted
In September 2005, the American Institute of Certified Public Accountants (“AICPA”) issued Statement of Position (“SOP”) 05-1, Accounting by Insurance Enterprises for Deferred Acquisition Costs in Connection With Modifications or Exchanges of Insurance Contracts. This statement provides guidance on accounting for deferred acquisition costs and other balances on an internal replacement, defined broadly as a modification in product benefits, features, rights, or coverages that occurs by the exchange of an existing contract for a new contract, or by amendment, endorsement, or rider to an existing contract, or by the election of a benefit, feature, right, or coverage within an existing contract. SOP 05-1 is effective for internal replacements beginning January 1, 2007. The adoption of SOP 05-1 will result in the shortening of the period over which our group life and health insurance business deferred acquisition costs are amortized. Transition to the shorter amortization period will result in a cumulative effect adjustment to retained earnings of approximately $55 million, net of tax on January 1, 2007.
In July 2006, FASB Interpretation (“FIN”) No. 48, Accounting for Uncertainty in Income Taxes, was issued. This guidance clarifies what criteria must be met prior to recognition of the financial statement benefit of a position taken in a tax return. This guidance is effective for fiscal years beginning January 1, 2007. We do not expect the adoption of this interpretation to have a material impact on our consolidated results of operations and financial position.
In September 2006, FASB issued SFAS No. 157, Fair Value Measurements. This statement defines fair value, establishes a framework for measuring fair value and expands disclosures about fair value measurements. SFAS No. 157 is effective for us on January 1, 2008. The adoption of SFAS No. 157 is not expected to have a material impact on our consolidated financial statements.
159
Genworth Financial, Inc.
Notes to Consolidated Financial Statements—(Continued)
Years Ended December 31, 2006, 2005 and 2004
In February 2007, FASB issued SFAS No. 159, The Fair Value Option for Financial Assets and Financial Liabilities. This statement provides an option to report selected financial assets and liabilities, including insurance contracts, at fair value. SFAS No. 159 will be effective for us on January 1, 2008. We have not decided whether we will elect the fair value option for any financial assets or liabilities and therefore do not know the impact, if any, SFAS No. 159 will have on our consolidated financial statements.
(3) Earnings per Share
Basic and diluted earnings per share are calculated by dividing net earnings for the year ended December 31, 2006, 2005 and 2004 by 455.9 million, 475.3 million and 489.5 million weighted average basic shares outstanding and by 469.4 million, 484.6 million and 490.5 million weighted average diluted shares outstanding, respectively. Weighted average shares outstanding for the year ended December 31, 2004 are determined as if our reorganization had occurred at the beginning of the year.
| (Amounts in millions except for per share data) |
2006 | 2005 | 2004 | ||||||
| Basic earnings per common share: |
|||||||||
| Income from continuing operations before accounting change |
$ | 2.90 | $ | 2.57 | $ | 2.34 | |||
| Gain (loss) on sale of discontinued operations, net of taxes |
— | — | 0.01 | ||||||
| Cumulative effect of accounting change, net of taxes |
0.01 | — | 0.01 | ||||||
| Basic earnings per common share |
$ | 2.91 | $ | 2.57 | $ | 2.36 | |||
| Diluted earnings per common share: |
|||||||||
| Net income from continuing operations before accounting change |
$ | 2.82 | $ | 2.52 | $ | 2.33 | |||
| Gain (loss) on sale of discontinued operations, net of taxes |
— | — | 0.01 | ||||||
| Cumulative effect of accounting change, net of taxes |
0.01 | — | 0.01 | ||||||
| Diluted earnings per common share |
$ | 2.83 | $ | 2.52 | $ | 2.36 | |||
| Weighted-average shares used in basic earnings per common share calculations |
455.9 | 475.3 | 489.5 | ||||||
| Potentially dilutive securities: |
|||||||||
| Stock purchase contracts underlying equity units |
7.7 | 5.5 | — | ||||||
| Stock options and stock appreciation rights |
5.0 | 3.4 | 0.5 | ||||||
| Restricted stock units |
0.8 | 0.4 | 0.5 | ||||||
| Weighted-average shares used in diluted earnings per common share calculations |
469.4 | 484.6 | 490.5 | ||||||
(4) Discontinued Operations
Upon completion of our corporate formation described in note 1, we no longer have continuing involvement with the Japanese life insurance and domestic auto and homeowners’ insurance businesses (together “Japan/Auto”), which was sold in August 2003, and accordingly, those operations were accounted for as discontinued operations.
As a result of a settlement related to the sale of our Japan/Auto businesses, we recognized a gain of $7 million, net of $4 million taxes, during the first quarter of 2004.
160
Genworth Financial, Inc.
Notes to Consolidated Financial Statements—(Continued)
Years Ended December 31, 2006, 2005 and 2004
(5) Investments
(a) Net Investment Income
For the years ended December 31, sources of net investment income are as follows:
| (Amounts in millions) |
2006 | 2005 | 2004 | |||||||||
| Fixed maturities—taxable |
$ | 2,974 | $ | 2,719 | $ | 2,925 | ||||||
| Fixed maturities—non-taxable |
122 | 128 | 132 | |||||||||
| Commercial mortgage loans |
514 | 457 | 381 | |||||||||
| Equity securities |
23 | 25 | 23 | |||||||||
| Other investments(a) |
51 | 73 | 58 | |||||||||
| Policy loans |
128 | 110 | 94 | |||||||||
| Restricted investments held by securitization entities |
7 | 50 | 64 | |||||||||
| Cash, cash equivalents and short-term investments |
95 | 45 | 23 | |||||||||
| Gross investment income before expenses and fees |
3,914 | 3,607 | 3,700 | |||||||||
| Expenses and fees |
(77 | ) | (71 | ) | (52 | ) | ||||||
| Net investment income |
$ | 3,837 | $ | 3,536 | $ | 3,648 | ||||||
| (a) | Included in other investments is $6 million of net investment income related to trading securities in 2006. |
(b) Net Investment Gains (Losses)
The following table sets forth net investment gains (losses) for the years ended December 31:
| (Amounts in millions) |
2006 | 2005 | 2004 | |||||||||
| Available-for-sale securities |
||||||||||||
| Realized gains on sale |
$ | 72 | $ | 108 | $ | 90 | ||||||
| Realized losses on sale |
(118 | ) | (39 | ) | (38 | ) | ||||||
| Loss on derecognition of securitization entities |
(17 | ) | — | — | ||||||||
| Impairments |
(8 | ) | (71 | ) | (26 | ) | ||||||
| Net unrealized losses on trading securities |
(1 | ) | — | — | ||||||||
| Derivative instruments |
3 | — | — | |||||||||
| Net investment gains (losses) |
$ | (69 | ) | $ | (2 | ) | $ | 26 | ||||
Derivative instruments primarily consist of changes in fair value on the non-qualifying derivatives, including embedded derivatives, changes in fair value of certain derivatives and related hedged items in fair value hedge relationships and hedge ineffectiveness on qualifying derivative instruments. Effective April 1, 2006, we began classifying changes in fair value of these derivative items as net investment gains (losses). These items were previously included as a component of net investment income, interest credited and benefits and other changes in policy reserves. The amount of these derivative items in prior periods that were included in the aforementioned categories was not material.
(c) Unrealized Investment Gains and Losses
Net unrealized gains and losses on investment securities classified as available-for-sale are reduced by deferred income taxes and adjustments to PVFP and DAC that would have resulted had such gains and losses
161
Genworth Financial, Inc.
Notes to Consolidated Financial Statements—(Continued)
Years Ended December 31, 2006, 2005 and 2004
been realized. Net unrealized gains and losses on available-for-sale investment securities reflected as a separate component of accumulated other comprehensive income as of December 31, are summarized as follows:
| (Amounts in millions) |
2006 | 2005 | 2004 | |||||||||
| Net unrealized gains on available-for-sale investment securities: |
||||||||||||
| Fixed maturities |
$ | 619 | $ | 1,155 | $ | 1,802 | ||||||
| Restricted fixed maturities |
— | (1 | ) | (19 | ) | |||||||
| Equity securities |
26 | 33 | 70 | |||||||||
| Other invested assets |
15 | 8 | — | |||||||||
| Subtotal |
660 | 1,195 | 1,853 | |||||||||
| Adjustments to present value of future profits, deferred acquisition costs and sales inducements |
6 | (25 | ) | (286 | ) | |||||||
| Deferred income taxes, net |
(231 | ) | (410 | ) | (548 | ) | ||||||
| Net unrealized gains on available-for-sale investment securities |
$ | 435 | $ | 760 | $ | 1,019 | ||||||
The change in net unrealized gains (losses) on available-for-sale investment securities reported in accumulated other comprehensive income for the years ended December 31, is as follows:
| (Amounts in millions) |
2006 | 2005 | 2004 | |||||||||
| Net unrealized gains on investment securities as of January 1 |
$ | 760 | $ | 1,019 | $ | 1,518 | ||||||
| Unrealized gains (losses) on investment arising during the period: |
||||||||||||
| Unrealized gain (losses) on investment securities |
(582 | ) | (659 | ) | 62 | |||||||
| Adjustment to deferred acquisition costs |
9 | 201 | 99 | |||||||||
| Adjustment to present value of future profits |
20 | 59 | 3 | |||||||||
| Adjustment to sales inducements |
2 | 1 | — | |||||||||
| Provision for deferred income taxes |
179 | 138 | (53 | ) | ||||||||
| Change in unrealized gains (losses) on investment securities |
(372 | ) | (260 | ) | 111 | |||||||
| Unrealized gains associated with securities transferred in connection with our reorganization, net of deferred taxes of $0, $0 and $317 |
— | — | (593 | ) | ||||||||
| Reclassification adjustments to net realized investment (gains) losses net of deferred taxes of $26, $1 and $(9) |
47 | 1 | (17 | ) | ||||||||
| Net unrealized gains on investment securities as of December 31 |
$ | 435 | $ | 760 | $ | 1,019 | ||||||
162
Genworth Financial, Inc.
Notes to Consolidated Financial Statements—(Continued)
Years Ended December 31, 2006, 2005 and 2004
(d) Fixed Maturities and Equity Securities
As of December 31, 2006 and 2005, the amortized cost or cost, gross unrealized gains (losses), and estimated fair value of our fixed maturities and equity securities classified as available-for-sale are as follows:
| 2006 |
Amortized cost or cost |
Gross unrealized gains |
Gross unrealized losses |
Estimated fair value | |||||||||
| (Amounts in millions) |
|||||||||||||
| Fixed maturities: |
|||||||||||||
| U.S. government, agencies and government sponsored entities |
$ | 873 | $ | 22 | $ | (7 | ) | $ | 888 | ||||
| Tax exempt |
2,126 | 106 | (1 | ) | 2,231 | ||||||||
| Government—non U.S. |
1,688 | 83 | (6 | ) | 1,765 | ||||||||
| U.S. corporate |
24,696 | 648 | (336 | ) | 25,008 | ||||||||
| Corporate—non U.S. |
10,675 | 206 | (140 | ) | 10,741 | ||||||||
| Mortgage and asset-backed |
14,771 | 142 | (98 | ) | 14,815 | ||||||||
| Total fixed maturities |
54,829 | 1,207 | (588 | ) | 55,448 | ||||||||
| Equity securities |
171 | 28 | (2 | ) | 197 | ||||||||
| Total available-for-sale securities |
$ | 55,000 | $ | 1,235 | $ | (590 | ) | $ | 55,645 | ||||
| 2005 |
Amortized cost or cost |
Gross unrealized gains |
Gross unrealized losses |
Estimated fair value | |||||||||
| (Amounts in millions) |
|||||||||||||
| Fixed maturities: |
|||||||||||||
| U.S. government, agencies and government sponsored entities |
$ | 777 | $ | 32 | $ | (4 | ) | $ | 805 | ||||
| Tax exempt |
2,797 | 97 | (4 | ) | 2,890 | ||||||||
| Government—non U.S. |
1,736 | 74 | (4 | ) | 1,806 | ||||||||
| U.S. corporate |
25,378 | 975 | (231 | ) | 26,122 | ||||||||
| Corporate—non U.S. |
9,168 | 306 | (84 | ) | 9,390 | ||||||||
| Mortgage and asset-backed |
12,926 | 140 | (142 | ) | 12,924 | ||||||||
| Total fixed maturities |
52,782 | 1,624 | (469 | ) | 53,937 | ||||||||
| Equity securities |
173 | 36 | (3 | ) | 206 | ||||||||
| Total available-for-sale securities |
$ | 52,955 | $ | 1,660 | $ | (472 | ) | $ | 54,143 | ||||
For fixed maturities, we recognize an impairment charge to income in the period in which we determine that we do not expect either to collect principal and interest in accordance with the contractual terms of the instruments or to recover based upon underlying collateral values, considering events such as a payment default, bankruptcy or disclosure of fraud. For equity securities, we recognize an impairment charge in the period in which we determine that the security will not recover to book value within a reasonable period. We determine what constitutes a reasonable period on a security-by-security basis based upon consideration of all the evidence available to us, including the magnitude of an unrealized loss and its duration. We measure impairment charges based upon the difference between the book value of a security and its fair value.
We generally intend to hold securities in unrealized loss positions until they recover. However, from time to time, we sell securities in the ordinary course of managing our portfolio to meet diversification, credit quality, yield and liquidity requirements. The aggregate fair value of securities sold at a loss during twelve months ended December 31, 2006 was $4,352 million, which was approximately 97.4% of book value.
163
Genworth Financial, Inc.
Notes to Consolidated Financial Statements—(Continued)
Years Ended December 31, 2006, 2005 and 2004
The following table presents the gross unrealized losses and estimated fair values of our investment securities, aggregated by investment type and length of time that individual investment securities have been in a continuous unrealized loss position, as of December 31, 2006:
| Less Than 12 Months | 12 Months or more | |||||||||||||||||
| 2006 |
Estimated fair value |
Gross unrealized losses |
# of securities |
Estimated fair value |
Gross unrealized losses |
# of securities | ||||||||||||
| (Dollar amounts in millions) |
||||||||||||||||||
| Description of Securities |
||||||||||||||||||
| Fixed maturities: |
||||||||||||||||||
| U.S. government, agencies and government sponsored entities |
$ | 375 | $ | (4 | ) | 14 | $ | 123 | $ | (3 | ) | 24 | ||||||
| Tax exempt |
— | — | — | 45 | (1 | ) | 22 | |||||||||||
| Government—non U.S. |
373 | (3 | ) | 72 | 155 | (3 | ) | 40 | ||||||||||
| U.S. corporate |
5,096 | (84 | ) | 502 | 6,213 | (252 | ) | 662 | ||||||||||
| Corporate—non U.S. |
3,254 | (46 | ) | 414 | 2,735 | (94 | ) | 269 | ||||||||||
| Mortgage and asset backed |
2,218 | (13 | ) | 298 | 3,561 | (85 | ) | 448 | ||||||||||
| Subtotal, fixed maturities |
11,316 | (150 | ) | 1,300 | 12,832 | (438 | ) | 1,465 | ||||||||||
| Equity securities |
— | — | — | 23 | (2 | ) | 12 | |||||||||||
| Total temporarily impaired securities |
$ | 11,316 | $ | (150 | ) | 1,300 | $ | 12,855 | $ | (440 | ) | 1,477 | ||||||
| % Below cost—fixed maturities: |
||||||||||||||||||
| <20% Below cost |
$ | 11,311 | $ | (148 | ) | 1,299 | $ | 12,797 | $ | (426 | ) | 1,459 | ||||||
| 20-50% Below cost |
5 | (2 | ) | 1 | 35 | (12 | ) | 6 | ||||||||||
| >50% Below cost |
— | — | — | — | — | — | ||||||||||||
| Total fixed maturities |
$ | 11,316 | $ | (150 | ) | 1,300 | $ | 12,832 | $ | (438 | ) | 1,465 | ||||||
| % Below cost—equity securities: |
||||||||||||||||||
| <20% Below cost |
$ | — | $ | — | — | $ | 23 | $ | (2 | ) | 12 | |||||||
| 20-50% Below cost |
— | — | — | — | — | — | ||||||||||||
| >50% Below cost |
— | — | — | — | — | — | ||||||||||||
| Total equity securities |
— | — | — | 23 | (2 | ) | 12 | |||||||||||
| Total temporarily impaired securities |
$ | 11,316 | $ | (150 | ) | 1,300 | $ | 12,855 | $ | (440 | ) | 1,477 | ||||||
| Investment grade |
$ | 10,961 | $ | (142 | ) | 1,219 | $ | 12,208 | $ | (409 | ) | 1,366 | ||||||
| Below investment grade |
355 | (8 | ) | 81 | 635 | (30 | ) | 101 | ||||||||||
| Not Rated—Fixed maturities |
— | — | — | — | — | — | ||||||||||||
| Not Rated—Equities |
— | — | — | 12 | (1 | ) | 10 | |||||||||||
| Total temporarily impaired securities |
$ | 11,316 | $ | (150 | ) | 1,300 | $ | 12,855 | $ | (440 | ) | 1,477 | ||||||
The investment securities in an unrealized loss position as of December 31, 2006 consisted of 2,777 securities accounting for unrealized losses of $590 million. Of these unrealized losses, 93.4% were investment grade (rated AAA through BBB-) and 97.6% were less than 20% below cost. The amount of the unrealized loss on these securities was primarily attributable to a generally high interest rate environment experienced during 2006.
Of the investment securities in an unrealized loss position for twelve months or more as of December 31, 2006, 6 securities were 20% or more below cost, including one security, which was also below investment grade that accounted for unrealized losses of less than $1 million.
164
Genworth Financial, Inc.
Notes to Consolidated Financial Statements—(Continued)
Years Ended December 31, 2006, 2005 and 2004
Because we expect these investments to continue to perform as to their original contractual terms and we have the ability and intent to hold these investment securities until the recovery of the fair value up to the cost of the investment, which may be maturity, we do not consider these investments to be other-than-temporarily impaired at December 31, 2006.
The following table presents the gross unrealized losses and estimated fair values of our investment securities, aggregated by investment type and length of time that individual investment securities have been in a continuous unrealized loss position, as of December 31, 2005:
| Less Than 12 Months | 12 Months or more | |||||||||||||||||
| 2005 |
Estimated fair value |
Gross unrealized losses |
# of securities |
Estimated fair value |
Gross unrealized losses |
# of securities | ||||||||||||
| (Dollar amounts in millions) |
||||||||||||||||||
| Description of Securities |
||||||||||||||||||
| Fixed maturities: |
||||||||||||||||||
| U.S. government, agencies and government sponsored entities |
$ | 281 | $ | (2 | ) | 24 | $ | 82 | $ | (2 | ) | 11 | ||||||
| Tax exempt |
385 | (3 | ) | 114 | 40 | (1 | ) | 18 | ||||||||||
| Government—non U.S. |
392 | (3 | ) | 75 | 78 | (1 | ) | 11 | ||||||||||
| U.S. corporate |
7,079 | (167 | ) | 731 | 1,466 | (64 | ) | 195 | ||||||||||
| Corporate—non U.S. |
2,884 | (57 | ) | 338 | 777 | (27 | ) | 88 | ||||||||||
| Mortgage and asset backed |
6,813 | (111 | ) | 652 | 1,181 | (31 | ) | 207 | ||||||||||
| Subtotal, fixed maturities |
$ | 17,834 | $ | (343 | ) | 1,934 | $ | 3,624 | $ | (126 | ) | 530 | ||||||
| Equity securities |
18 | — | 12 | 27 | (3 | ) | 26 | |||||||||||
| Total temporarily impaired securities |
$ | 17,852 | $ | (343 | ) | 1,946 | $ | 3,651 | $ | (129 | ) | 556 | ||||||
| % Below cost—fixed maturities: |
||||||||||||||||||
| <20% Below cost |
$ | 17,789 | $ | (327 | ) | 1,925 | $ | 3,579 | $ | (106 | ) | 515 | ||||||
| 20-50% Below cost |
45 | (15 | ) | 7 | 44 | (19 | ) | 14 | ||||||||||
| >50% Below cost |
— | (1 | ) | 2 | 1 | (1 | ) | 1 | ||||||||||
| Total fixed maturities |
17,834 | (343 | ) | 1,934 | 3,624 | (126 | ) | 530 | ||||||||||
| % Below cost—equity securities: |
||||||||||||||||||
| <20% Below cost |
$ | 18 | $ | — | 8 | $ | 26 | $ | (3 | ) | 12 | |||||||
| 20-50% Below cost |
— | — | 1 | 1 | — | 7 | ||||||||||||
| >50% Below cost |
— | — | 3 | — | — | 7 | ||||||||||||
| Total equity securities |
18 | — | 12 | 27 | (3 | ) | 26 | |||||||||||
| Total temporarily impaired securities |
$ | 17,852 | $ | (343 | ) | 1,946 | $ | 3,651 | $ | (129 | ) | 556 | ||||||
| Investment grade |
$ | 16,933 | $ | (305 | ) | 1,765 | $ | 3,453 | $ | (106 | ) | 482 | ||||||
| Below investment grade |
892 | (38 | ) | 167 | 180 | (21 | ) | 52 | ||||||||||
| Not Rated—Fixed maturities |
20 | — | 5 | — | — | — | ||||||||||||
| Not Rated—Equities |
7 | — | 9 | 18 | (2 | ) | 22 | |||||||||||
| Total temporarily impaired securities |
$ | 17,852 | $ | (343 | ) | 1,946 | $ | 3,651 | $ | (129 | ) | 556 | ||||||
The scheduled maturity distribution of fixed maturities as of December 31, 2006 is set forth below. Actual maturities may differ from contractual maturities because issuers of securities may have the right to call or prepay obligations with or without call or prepayment penalties.
165
Genworth Financial, Inc.
Notes to Consolidated Financial Statements—(Continued)
Years Ended December 31, 2006, 2005 and 2004
| (Amounts in millions) |
Amortized cost or cost |
Estimated fair value | ||||
| Due one year or less |
$ | 2,351 | $ | 2,351 | ||
| Due after one year through five years |
10,577 | 10,632 | ||||
| Due after five years through ten years |
10,025 | 10,043 | ||||
| Due after ten years |
17,105 | 17,607 | ||||
| Subtotal |
40,058 | 40,633 | ||||
| Mortgage and asset-backed |
14,771 | 14,815 | ||||
| Total |
$ | 54,829 | $ | 55,448 | ||
As of December 31, 2006, $7,096 million of our investments (excluding mortgage and asset-backed securities) are subject to certain call provisions.
As of December 31, 2006, securities issued by finance and insurance, utilities and energy, and consumer—non cyclical industry groups represented approximately 35%, 18% and 12% of our domestic and foreign corporate fixed maturities portfolio, respectively. No other industry group comprises more than 10% of our investment portfolio. This portfolio is widely diversified among various geographic regions in the U.S. and internationally, and is not dependent on the economic stability of one particular region.
As of December 31, 2006, we did not hold any fixed maturities in any single issuer, other than securities issued or guaranteed by the U.S. government, which exceeded 10% of stockholders’ equity.
As of December 31, 2006 and 2005, $364 million and $298 million, respectively, of securities are on deposit with various state or foreign government insurance departments in order to comply with relevant insurance regulations.
(e) Commercial Mortgage Loans
Our mortgage loans are collateralized by commercial properties, including multi-family residential buildings. The carrying value of commercial mortgage loans is original cost net of prepayments, amortization and allowance for losses.
We diversify our commercial mortgage loans by both property type and geographic region. The following table sets forth the distribution across property type and geographic region for commercial mortgage loans as of December 31:
| December 31, | ||||||||||||||
| 2006 | 2005 | |||||||||||||
| (Amounts in millions) |
Carrying value |
% of total |
Carrying value |
% of total |
||||||||||
| Property Type |
||||||||||||||
| Office |
$ | 2,342 | 27 | % | $ | 2,204 | 29 | % | ||||||
| Industrial |
2,254 | 26 | 2,116 | 28 | ||||||||||
| Retail |
2,261 | 27 | 2,098 | 28 | ||||||||||
| Apartments |
995 | 12 | 835 | 11 | ||||||||||
| Mixed use/other |
649 | 8 | 328 | 4 | ||||||||||
| Total principal balance |
$ | 8,501 | 100 | % | $ | 7,581 | 100 | % | ||||||
| Unamortized balance of loan origination fees and costs |
5 | 8 | ||||||||||||
| Allowance for losses |
(15 | ) | (31 | ) | ||||||||||
| Total |
$ | 8,491 | $ | 7,558 | ||||||||||
166
Genworth Financial, Inc.
Notes to Consolidated Financial Statements—(Continued)
Years Ended December 31, 2006, 2005 and 2004
| December 31, | ||||||||||||||
| 2006 | 2005 | |||||||||||||
| (Amounts in millions) |
Carrying value |
% of total |
Carrying value |
% of total |
||||||||||
| Geographic Region |
||||||||||||||
| Pacific |
$ | 2,356 | 28 | % | $ | 2,279 | 30 | % | ||||||
| South Atlantic |
1,847 | 22 | 1,590 | 21 | ||||||||||
| Middle Atlantic |
1,130 | 13 | 1,091 | 14 | ||||||||||
| East North Central |
842 | 10 | 796 | 10 | ||||||||||
| Mountain |
834 | 10 | 581 | 8 | ||||||||||
| West South Central |
358 | 4 | 337 | 5 | ||||||||||
| West North Central |
538 | 6 | 442 | 6 | ||||||||||
| East South Central |
285 | 3 | 282 | 4 | ||||||||||
| New England |
311 | 4 | 183 | 2 | ||||||||||
| Total principal balance |
$ | 8,501 | 100 | % | $ | 7,581 | 100 | % | ||||||
| Unamortized balance of loan origination fees and costs |
5 | 8 | ||||||||||||
| Allowance for losses |
(15 | ) | (31 | ) | ||||||||||
| Total |
$ | 8,491 | $ | 7,558 | ||||||||||
“Impaired” loans are defined by U.S. GAAP as loans for which it is probable that the lender will be unable to collect all amounts due according to original contractual terms of the loan agreement.
Under these principles, we may have two types of “impaired” loans: loans requiring specific allowances for losses (none as of December 31, 2006 and 2005) and loans expected to be fully recoverable because the carrying amount has been reduced previously through charge-offs or deferral of income recognition ($3 million and $1 million as of December 31, 2006 and 2005, respectively).
Average investment in specifically impaired loans during 2006, 2005 and 2004 is $1 million, $3 million and $3 million, respectively, and interest income recognized on these loans while they were considered impaired is $0, $0 million and $1 million, respectively.
The following table presents the activity in the allowance for losses during the years ended December 31:
| (Amounts in millions) |
2006 | 2005 | 2004 | |||||||||
| Balance as of January 1 |
$ | 31 | $ | 52 | $ | 50 | ||||||
| Provision |
1 | 11 | 7 | |||||||||
| Release |
(17 | ) | (32 | ) | — | |||||||
| Amounts written off, net of recoveries |
— | — | (5 | ) | ||||||||
| Balance as of December 31 |
$ | 15 | $ | 31 | $ | 52 | ||||||
During 2005, we refined our process for estimating credit losses in our commercial mortgage loan portfolio. As a result of this adjustment, we released $32 million ($19 million net of deferred acquisition costs and of deferred taxes) of commercial mortgage loan reserves to net investment income in the fourth quarter of 2005.
167
Genworth Financial, Inc.
Notes to Consolidated Financial Statements—(Continued)
Years Ended December 31, 2006, 2005 and 2004
(6) Deferred Acquisition Costs
Activity impacting deferred acquisition costs for the years ended December 31:
| (Amounts in millions) |
2006 | 2005 | 2004 | |||||||||
| Unamortized balance as of January 1 |
$ | 5,571 | $ | 5,206 | $ | 6,073 | ||||||
| Amounts transferred in connection with our corporate formation |
— | — | (1,004 | ) | ||||||||
| Impact of foreign currency translation |
58 | (69 | ) | 91 | ||||||||
| Costs deferred |
1,266 | 1,116 | 957 | |||||||||
| Amortization |
(619 | ) | (682 | ) | (911 | ) | ||||||
| Adjustments |
25 | — | — | |||||||||
| Unamortized balance as of December 31 |
6,301 | 5,571 | 5,206 | |||||||||
| Accumulated effect of net unrealized investment gains |
24 | 15 | (186 | ) | ||||||||
| Balance as of December 31 |
$ | 6,325 | $ | 5,586 | $ | 5,020 | ||||||
Adjustments are the result of a $69 million reclassification from future annuity and contract benefits, partially offset by a $44 million decrease related to the reclassification of certain reinsurance assumed determined to be deposit method of accounting.
(7) Intangible Assets
The following table presents our intangible assets as of December 31:
| 2006 | 2005 | |||||||||||||
| (Amounts in millions) |
Gross carrying amount |
Accumulated amortization |
Gross carrying amount |
Accumulated amortization |
||||||||||
| Present value of future profits |
$ | 2,162 | $ | (1,507 | ) | $ | 2,086 | $ | (1,427 | ) | ||||
| Capitalized software |
298 | (184 | ) | 234 | (157 | ) | ||||||||
| Deferred sales inducements to contractholders |
80 | (13 | ) | 45 | (4 | ) | ||||||||
| Other |
43 | (38 | ) | 42 | (37 | ) | ||||||||
| Total |
$ | 2,583 | $ | (1,742 | ) | $ | 2,407 | $ | (1,625 | ) | ||||
Amortization related to present value of future profits, capitalized software and other intangible assets for the years ended December 31, 2006, 2005 and 2004 was $108 million, $112 million and $153 million, respectively. Amortization expense related to sales inducements of $9 million, $3 million and $1 million for the years ended December 31, 2006, 2005 and 2004 was included in benefits and other changes in policy reserves.
Present Value of Future Profits
The following table presents the activity in PVFP for the years ended December 31:
| (Amounts in millions) |
2006 | 2005 | 2004 | |||||||||
| Unamortized balance as of January 1 |
$ | 700 | $ | 781 | $ | 1,254 | ||||||
| Amounts transferred in connection with corporate formation |
— | — | (375 | ) | ||||||||
| Acquisitions |
58 | — | — | |||||||||
| Impact of foreign currency translation |
(2 | ) | (1 | ) | 1 | |||||||
| Interest accreted at 5.4%, 5.5%, 5.8%, respectively |
37 | 41 | 59 | |||||||||
| Amortization |
(117 | ) | (121 | ) | (158 | ) | ||||||
| Unamortized balance as of December 31 |
676 | 700 | 781 | |||||||||
| Accumulated effect of net unrealized investment gains |
(21 | ) | (41 | ) | (100 | ) | ||||||
| Balance as of December 31 |
$ | 655 | $ | 659 | $ | 681 | ||||||
168
Genworth Financial, Inc.
Notes to Consolidated Financial Statements—(Continued)
Years Ended December 31, 2006, 2005 and 2004
The percentage of the December 31, 2006 PVFP balance net of interest accretion, before the effect of unrealized investment gains or losses, estimated to be amortized over each of the next five years is as follows:
| 2007 |
11.3 | % | |
| 2008 |
10.3 | % | |
| 2009 |
8.8 | % | |
| 2010 |
7.6 | % | |
| 2011 |
6.4 | % |
Amortization expenses for PVFP in future periods will be affected by acquisitions, dispositions, realized capital gains/losses or other factors affecting the ultimate amount of gross profits realized from certain lines of business. Similarly, future amortization expenses for other intangibles will depend on future acquisitions, dispositions and other business transactions.
(8) Goodwill and Significant Acquisitions and Dispositions
Our goodwill balance by segment and activity is as follows:
| (Amounts in millions) |
Protection | Retirement Income and Investments |
Mortgage Insurance |
Total | |||||||||||
| Balance as of December 31, 2004 |
$ | 1,082 | $ | 346 | $ | 37 | $ | 1,465 | |||||||
| Acquisitions |
— | 5 | — | 5 | |||||||||||
| Foreign exchange translation |
(9 | ) | — | 1 | (8 | ) | |||||||||
| Pre acquisition tax contingency release |
(8 | ) | (4 | ) | — | (12 | ) | ||||||||
| Balance as of December 31, 2005 |
$ | 1,065 | $ | 347 | $ | 38 | $ | 1,450 | |||||||
| Acquisitions |
51 | 226 | — | 277 | |||||||||||
| Foreign exchange translation |
10 | — | — | 10 | |||||||||||
| Balance as of December 31, 2006 |
$ | 1,126 | $ | 573 | $ | 38 | $ | 1,737 | |||||||
In October 2005, we acquired C.J.M. Planning Corp. and affiliates for an up-front cost of $5 million, plus potential contingent consideration of $7 million. The initial payment of $5 million was recorded to goodwill in 2005 and an additional $3 million related to the contingent consideration was recorded to goodwill in 2006.
On May 1, 2006, we completed the acquisition of Continental Life Insurance Company of Brentwood, Tennessee (“Continental Life”), for $145 million, plus contingent consideration of $5 million per year for two years based on attaining certain sales production thresholds. Continental Life’s business provides primarily Medicare supplement insurance and is a part of our Protection segment. This acquisition was accounted for using the purchase method. The excess purchase price over the estimated fair value of the net assets acquired of $51 million has been recorded as goodwill. In addition, $54 million of PVFP was recorded in connection with this transaction. The results of operations of Continental Life have been included in our consolidated results beginning May 1, 2006. Such estimated values may change as additional information is obtained and the valuation is finalized.
On July 3, 2006, we completed the acquisition of Vero Lenders Mortgage Insurance Limited (“Vero LMI”), a subsidiary of Vero Insurance Limited, which had been a wholly-owned by Promina Group Limited of Sydney, Australia, for $82 million, net of post-closing dividends to us. Vero LMI, consisted solely of a runoff mortgage insurance block and is now part of our Mortgage Insurance segment as Genworth Financial Mortgage Indemnity
169
Genworth Financial, Inc.
Notes to Consolidated Financial Statements—(Continued)
Years Ended December 31, 2006, 2005 and 2004
Limited. This acquisition was accounted for using the purchase method. PVFP of $4 million and no goodwill was recorded in connection with this transaction. Such estimated values may change as additional information is obtained and the valuation is finalized.
On October 20, 2006, we acquired AssetMark Investment Services, Inc. (“AssetMark”) of Pleasant Hill, California, for approximately $230 million. AssetMark is an investment management and adviser company with more than $9 billion in third-party assets under management. Under terms of the agreement, we may pay additional performance-based payments of up to $100 million over three to five years. This acquisition was accounted for using the purchase method and $223 million has been recorded as goodwill in connection with this transaction. The results of operation of AssetMark are included in our consolidated results beginning October 20, 2006. Such estimated values may change as additional information is obtained and the valuation is finalized.
On January 10, 2007, we entered into a Stock Purchase Agreement, whereby we have agreed to sell our group life and health insurance business for $650 million in cash. We expect to account for this business as part of discontinued operations beginning in first quarter 2007 financial statements. As of December 31, 2006, the group life and health insurance business had goodwill and PVFP of $135 million and $9 million, respectively. We expect to recognize a realized gain on the sale of approximately $45 million to $55 million upon closing, which is expected to occur in the second quarter of 2007.
(9) Reinsurance
We reinsure a portion of our policy risks to other companies in order to reduce our ultimate losses and to diversify our exposures. We also assume certain policy risks written by other insurance companies. Reinsurance accounting is followed for assumed and ceded transactions when there is adequate risk transfer. Otherwise, the deposit method of accounting is followed.
Reinsurance does not relieve us from our obligations to policyholders. In the event that the reinsurers are unable to meet their obligations, we remain liable for the reinsured claims. We monitor both the financial condition of individual reinsurers and risk concentrations arising from similar geographic regions, activities and economic characteristics of reinsurers to lessen the risk of default by such reinsurers. Other than the relationship discussed below with UFLIC, we do not have significant concentrations of reinsurance with any one reinsurer that could have a material impact on our financial position.
As of December 31, 2006, the maximum amount of individual ordinary life insurance normally retained by us on any one individual life policy is $1 million. Beginning January 1, 2007, we increased the maximum amount to $5 million on new policy issues.
Prior to our IPO, we entered into several significant reinsurance transactions (“Reinsurance Transactions”) with other affiliates of GE. In these transactions, we ceded to Union Fidelity Life Insurance Company (“UFLIC”), in-force blocks of structured settlements, substantially all of our in-force blocks of variable annuities and a block of long-term care insurance policies that we reinsured in 2000 from Travelers Insurance Company (“Travelers”). Although we remain directly liable under these contracts and policies as the ceding insurer, the Reinsurance Transactions have the effect of transferring the financial results of the reinsured blocks to UFLIC. As of December 31, 2006 and 2005 we have a reinsurance recoverable of $15,010 million and $15,737 million, respectively, associated with those Reinsurance Transactions.
170
Genworth Financial, Inc.
Notes to Consolidated Financial Statements—(Continued)
Years Ended December 31, 2006, 2005 and 2004
To secure the payment of its obligations to us under the reinsurance agreements governing the Reinsurance Transactions, UFLIC has established trust accounts to maintain an aggregate amount of assets with a statutory book value at least equal to the statutory general account reserves attributable to the reinsured business less an amount required to be held in certain claims paying accounts. A trustee administers the trust accounts and we are permitted to withdraw from the trust accounts amounts due to us pursuant to the terms of the reinsurance agreements that are not otherwise paid by UFLIC. In addition, pursuant to a Capital Maintenance Agreement, GE Capital agreed to maintain sufficient capital in UFLIC to maintain UFLIC’s risk-based capital at not less than 150% of its company action level, as defined from time to time by the National Association of Insurance Commissioners (“NAIC”).
The following table sets forth net domestic life insurance in-force as of December 31:
| (Amounts in millions) |
2006 | 2005 | 2004 | |||||||||
| Direct life insurance in-force |
$ | 703,196 | $ | 643,673 | $ | 596,765 | ||||||
| Amounts assumed from other companies |
1,661 | 1,876 | 25,461 | |||||||||
| Amounts ceded to other companies |
(171,069 | ) | (170,851 | ) | (168,885 | ) | ||||||
| Net life insurance in-force |
$ | 533,788 | $ | 474,698 | $ | 453,341 | ||||||
| Percentage of amount assumed to net |
— | % | — | % | 6 | % | ||||||
The following table sets forth the effects of reinsurance on premiums written and earned for the years ended December 31:
| Written | Earned | |||||||||||||||||||||||
| (Amounts in millions) |
2006 | 2005 | 2004 | 2006 | 2005 | 2004 | ||||||||||||||||||
| Direct: |
||||||||||||||||||||||||
| Life insurance |
$ | 2,131 | $ | 2,228 | $ | 2,164 | $ | 2,093 | $ | 2,164 | $ | 2,111 | ||||||||||||
| Accident and health insurance |
3,144 | 2,917 | 2,715 | 3,221 | 3,085 | 3,313 | ||||||||||||||||||
| Property and casualty insurance |
76 | 138 | 157 | 68 | 121 | 172 | ||||||||||||||||||
| Mortgage insurance |
1,639 | 1,285 | 1,199 | 1,250 | 1,015 | 933 | ||||||||||||||||||
| Total direct |
6,990 | 6,568 | 6,235 | 6,632 | 6,385 | 6,529 | ||||||||||||||||||
| Assumed: |
||||||||||||||||||||||||
| Life insurance |
341 | 196 | 251 | 274 | 220 | 249 | ||||||||||||||||||
| Accident and health insurance |
516 | 547 | 560 | 393 | 507 | 556 | ||||||||||||||||||
| Property and casualty insurance |
— | — | 35 | — | — | 53 | ||||||||||||||||||
| Mortgage insurance |
29 | 15 | 15 | 18 | 7 | 9 | ||||||||||||||||||
| Total assumed |
886 | 758 | 861 | 685 | 734 | 867 | ||||||||||||||||||
| Ceded: |
||||||||||||||||||||||||
| Life insurance |
(322 | ) | (311 | ) | (318 | ) | (283 | ) | (281 | ) | (290 | ) | ||||||||||||
| Accident and health insurance |
(409 | ) | (424 | ) | (433 | ) | (406 | ) | (395 | ) | (396 | ) | ||||||||||||
| Property and casualty insurance |
(5 | ) | (6 | ) | (10 | ) | (5 | ) | (6 | ) | (9 | ) | ||||||||||||
| Mortgage insurance |
(134 | ) | (136 | ) | (141 | ) | (136 | ) | (140 | ) | (142 | ) | ||||||||||||
| Total ceded |
(870 | ) | (877 | ) | (902 | ) | (830 | ) | (822 | ) | (837 | ) | ||||||||||||
| Net premiums |
$ | 7,006 | $ | 6,449 | $ | 6,194 | $ | 6,487 | $ | 6,297 | $ | 6,559 | ||||||||||||
| Percentage of amount assumed to net |
11 | % | 12 | % | 13 | % | ||||||||||||||||||
171
Genworth Financial, Inc.
Notes to Consolidated Financial Statements—(Continued)
Years Ended December 31, 2006, 2005 and 2004
Reinsurance recoveries recognized as a reduction of benefits and other changes in policy reserves amounted to $2,204 million, $1,881 million and $1,264 million during 2006, 2005 and 2004, respectively.
(10) Future Annuity and Contract Benefits
Investment Contracts
Investment contracts are broadly defined to include contracts without significant mortality or morbidity risk. Payments received from sales of investment contracts are recognized by providing a liability equal to the current account value of the policyholders’ contracts. Interest rates credited to investment contracts are guaranteed for the initial policy term with renewal rates determined as necessary by management.
Insurance Contracts
Insurance contracts are broadly defined to include contracts with significant mortality and/or morbidity risk. The liability for future benefits of insurance contracts is the present value of such benefits less the present value of future net premiums based on mortality, morbidity, and other assumptions, which are appropriate at the time the policies are issued or acquired. These assumptions are periodically evaluated for potential reserve deficiencies. Reserves for cancelable accident and health insurance are based upon unearned premiums, claims incurred but not reported, and claims in the process of settlement. This estimate is based on our historical experience and that of the insurance industry, adjusted for current trends. Any changes in the estimated liability are reflected in income as the estimates are revised.
The following table sets forth the major assumptions underlying our recorded liabilities for future annuity and contract benefits as of December 31:
| (Amounts in millions) |
Mortality/ morbidity assumption |
Interest rate assumption |
2006 | 2005 | ||||||
| Investment contracts |
Account balance | N/A | $ | 30,587 | $ | 32,098 | ||||
| Universal life-type contracts |
Account balance | N/A | 7,273 | 7,088 | ||||||
| Limited-payment contracts |
(a) | 3.5% – 8.0% | 14,585 | 14,139 | ||||||
| Traditional life insurance contracts |
(b) | 2.5% – 6.0% | 3,037 | 2,846 | ||||||
| Accident and health |
(c) | 4.0% – 5.3% | 86 | 28 | ||||||
| Long-term care |
(d) | 4.5% – 7.5% | 8,568 | 7,550 | ||||||
| Total future annuity and contract benefits |
$ | 64,136 | $ | 63,749 | ||||||
| (a) | Either the U.S Population Table, 1983 Group Annuitant Mortality Table, 1983 Individual Annuitant Mortality Table or a-2000 Mortality Table. |
| (b) | Principally modifications of the 1965-70 or 1975-80 Select and Ultimate Tables, 1958 and 1980 Commissioner’s Standard Ordinary Tables, 1980 Commissioner’s Extended Term table and (IA) Standard Table 1996 (modified). |
| (c) | The 1958 and 1980 Commissioner’s Standard Ordinary Tables, 1960 Commissioner’s Standard Group Tables, 1970 Intercompany Group Life Disability Valuation Table, 1985 Commissioner’s Individual Disability A Tables and 1987 Commissioner’s Disability Tables and company experience. |
| (d) | The 1983 Individual Annuitant Mortality Table or 2000 Commissioner’s Standard Ordinary Table and the 1985 National Nursing Home Study and company experience. |
172
Genworth Financial, Inc.
Notes to Consolidated Financial Statements—(Continued)
Years Ended December 31, 2006, 2005 and 2004
Assumptions as to persistency are based on company experience.
Our variable annuities provide a basic guaranteed minimum death benefit (“GMDB”) which provides a minimum account value to be paid upon the annuitant’s death. Our contractholders have the option to purchase through riders, at an additional charge, enhanced death benefits. Our separate account guarantees are predominantly death benefits; we also have some guaranteed minimum withdrawal benefits.
The total account value, net of reinsurance, of our variable annuities with death benefits, including both separate account and fixed account assets, is approximately $4,268 million and $2,135 million at December 31, 2006 and 2005, respectively, with related GMDB exposure (or net amount at risk) of approximately $16 million and $8 million, respectively.
The GMDB liability for our variable annuity contracts with death benefits, net of reinsurance, is $7 million and $2 million at December 31, 2006 and 2005, respectively.
The assets supporting the separate accounts of the variable contracts are primarily mutual fund equity securities and are reflected in our Consolidated Balance Sheets at fair value and reported as summary total separate account assets with an equivalent summary total reported for liabilities. Amounts assessed against the contractholders for mortality, administrative, and other services are included in revenues. Changes in liabilities for minimum guarantees are included in benefits and other changes in policy reserves.
Separate account net investment income, net investment gains and losses, and the related liability changes are offset within the same line item in the Consolidated Statements of Income. There are no gains or losses on transfers of assets from the general account to the separate account.
(11) Liability for Policy and Contract Claims
The following table sets forth changes in the liability for policy and contract claims for the years ended December 31:
| (Amounts in millions) |
2006 | 2005 | 2004 | |||||||||
| Balance as of January 1 |
$ | 3,364 | $ | 3,329 | $ | 3,207 | ||||||
| Less reinsurance recoverables |
(801 | ) | (741 | ) | (389 | ) | ||||||
| Net balance as of January 1 |
2,563 | 2,588 | 2,818 | |||||||||
| Amounts transferred in connection with our corporate formation |
— | — | (405 | ) | ||||||||
| Incurred related to insured events of: |
||||||||||||
| Current year |
2,509 | 1,956 | 1,937 | |||||||||
| Prior years |
31 | (43 | ) | (98 | ) | |||||||
| Total incurred |
2,540 | 1,913 | 1,839 | |||||||||
| Interest on liability for policy and contract claims |
61 | 71 | 66 | |||||||||
| Paid related to insured events of: |
||||||||||||
| Current year |
(1,216 | ) | (1,132 | ) | (989 | ) | ||||||
| Prior years |
(1,215 | ) | (858 | ) | (768 | ) | ||||||
| Total paid |
(2,431 | ) | (1,990 | ) | (1,757 | ) | ||||||
| Foreign currency translation |
(3 | ) | (19 | ) | 27 | |||||||
| Net balance as of December 31 |
2,730 | 2,563 | 2,588 | |||||||||
| Add reinsurance recoverables |
812 | 801 | 741 | |||||||||
| Balance as of December 31 |
$ | 3,542 | $ | 3,364 | $ | 3,329 | ||||||
173
Genworth Financial, Inc.
Notes to Consolidated Financial Statements—(Continued)
Years Ended December 31, 2006, 2005 and 2004
For the year ended December 31, 2006, the unfavorable change in liability for policy and contract claims is primarily due to increased case reserves for our mortgage and long-term care businesses. For the year ended December 31, 2005, the change in prior year incurred liabilities primarily relates to favorable development in claims incurred but not reported for our mortgage insurance and certain accident and health insurance businesses.
(12) Employee Benefit Plans
Prior to September 27, 2005, our employees participated in GE’s retirement plan (“GE Pension Plan”), retiree health and life insurance benefit plans and defined contribution savings plan. Our employees also received health and life benefits through GE’s benefit program. The Genworth related assets and liabilities of the GE Pension Plan remained with GE upon separation and as a result, we have no future funding obligations associated with this plan. Certain company employees also participated in GE’s Supplementary Pension Plan.
Our costs associated with these GE plans were $11 million, $95 million and $108 million for the years ended December 31, 2006, 2005 and 2004, respectively.
Effective as of September 27, 2005, GE ceased to own more than 50% of our outstanding common stock. At that time, our applicable employees ceased participating in the GE benefit plans and began participating in employee benefit plans established and maintained by us. During the last half of 2005, all international employees transitioned to Genworth benefits applicable to their country. The following summarizes information related to the Genworth benefit plans.
On December 31, 2006, we adopted SFAS No. 158, under the prospective method. The statement requires an employer to recognize the overfunded or underfunded status of a defined benefit plan as an asset or liability on its statement of financial position and to recognize changes in that funded status in the year in which the changes occur through accumulated other comprehensive income. Accordingly, in December of 2006, we recognized a $31 million charge to other comprehensive income related to the adoption of SFAS No. 158. The following table sets forth the incremental effect of applying SFAS No. 158:
| (Amounts in millions) |
Before application of SFAS No. 158 |
Adjustments | After application of SFAS No. 158 | |||||||
| Liability for defined benefit plans (other liabilities) |
$ | 62 | $ | 51 | $ | 113 | ||||
| Deferred income taxes |
1,570 | (20 | ) | 1,550 | ||||||
| Total liabilities |
97,510 | 31 | 97,541 | |||||||
| Accumulated other comprehensive income |
1,188 | (31 | ) | 1,157 | ||||||
| Total stockholders’ equity |
13,361 | (31 | ) | 13,330 | ||||||
(a) Pension and Retiree Health and Life Insurance Benefit Plans
Essentially all of our employees are enrolled in a qualified defined contribution pension plan. The plan is 100% funded by Genworth. We make annual contributions to each employee’s pension plan account based on the employee’s age, service and eligible pay. Employees are vested in the plan after five years of service. In addition, certain company employees also participate in non-qualified defined contribution plans and in qualified and non-qualified defined benefit pension plans. The plan assets, projected benefit obligation and accumulated benefit obligation liabilities of these defined benefit pension plans are not material to our consolidated financial statements individually or in the aggregate. As of December 31, 2006, we had a recorded liability of $35 million
174
Genworth Financial, Inc.
Notes to Consolidated Financial Statements—(Continued)
Years Ended December 31, 2006, 2005 and 2004
of which $9 million was charged to accumulated other comprehensive income in compliance with SFAS No. 158 related to these benefits. As of December 31, 2005, we had accrued $21 million in other liabilities associated with these benefits.
We provide retiree health benefits to domestic employees hired prior to January 1, 2005 who meet certain service requirements. Under this plan, retirees over 65 years of age receive Medigap policy coverage, and retirees under 65 years of age receive medical benefits similar to our employees’ medical benefits. We also provide retiree life insurance benefits, which are provided through our Group business. The amount of fees recorded by Group related to the retiree life insurance benefits was insignificant for all periods presented. The plans are funded as claims are incurred. As of December 31, 2006 and 2005, the accumulated postretirement benefit obligation associated with these benefits was $78 and $61 million, respectively, of which we had accrued $78 and $29 million in other liabilities, respectively. In compliance with SFAS No. 158, $22 million of the accrued $78 million was charged to accumulated other comprehensive income as of December 31, 2006.
Our cost associated with these Genworth plans was $48 million and $11 million for the year ended December 31, 2006 and for the period from September 27, 2005 through December 31, 2005, respectively.
(b) Savings Plans
Our domestic employees participate in qualified and non-qualified defined contribution savings plans that allow employees to contribute a portion of their pay to the plan on a pre-tax basis. We match these contributions, which vest immediately, up to 4% of the employee’s pay. One option available to employees in the defined contribution savings plan is the ClearCourse® variable annuity option offered by our Retirement Income and Investments segment (“RI&I”). The amount of deposits recorded by our RI&I segment in relation to this plan option was $2 million and $0 million as of December 31, 2006 and 2005, respectively. Employees also have the option of purchasing Genworth stock as part of the defined contribution plan. Our cost associated with these plans was $18 million and $3 million for the year ended December 31, 2006 and the period from September 27, 2005 through December 31, 2005, respectively.
(c) Health and Welfare Benefits
We provide health and welfare benefits to our employees, including health, life, disability, dental and long-term care insurance. Our dental insurance is provided through Group, and our long-term care insurance is provided through our group long-term care business. The premiums recorded by these businesses related to these benefits were insignificant during 2006 and 2005.
(13) Borrowings
(a) Short-Term Borrowings
Total short-term borrowings as of December 31:
| (Amounts in millions) |
2006 | 2005 | ||||
| Commercial paper |
$ | 199 | $ | 152 | ||
| Revolving credit |
— | — | ||||
| Total short-term borrowings |
$ | 199 | $ | 152 | ||
175
Genworth Financial, Inc.
Notes to Consolidated Financial Statements—(Continued)
Years Ended December 31, 2006, 2005 and 2004
Commercial Paper Facility
On June 9, 2004, we established a $1 billion commercial paper program. The notes under the commercial paper program are offered pursuant to an exemption from registration under the Securities Act of 1933 and may have a maturity of up to 364 days from the date of issue. In September 2005, we used the proceeds from our senior notes to pay down $348 million of our commercial paper. In the first and fourth quarter of 2006, we issued $229 million and $223 million of commercial paper, respectively. These issuances were offset by pay downs of commercial paper in the second and fourth quarters of 2006 of $85 million and $319 million, respectively. The fourth quarter reduction of commercial paper was funded by the proceeds received from our $600 million junior subordinated notes issuance. As of December 31, 2006 and 2005, the weighted average interest rate on commercial paper outstanding is 5.24% and 3.29%, respectively, and the weighted average maturity is 37 and 53 days, respectively.
Revolving Credit Facilities
On May 25, 2006, we entered into a $1.0 billion five-year revolving credit facility, which matures in May 2011, replacing our $1.0 billion five-year revolving credit facility, which was scheduled to mature in May 2009. We also have a $1.0 billion revolving credit facility that matures in April 2010. These facilities bear variable interest rates based on one-month LIBOR plus a margin. As of December 31, 2006 and 2005, we had no borrowings under these facilities; however, we utilized $172 million and $171 million of the commitment under these facilities, respectively, for the issuance of letters of credit for the benefit of one of our Mortgage Insurance subsidiaries.
(b) Long-Term Borrowings
Total long-term borrowings as of December 31:
| (Amounts in millions) |
2006 | 2005 | ||||
| 1.6% Notes (Japanese Yen), due 2011 |
$ | 478 | $ | 491 | ||
| LIBOR Floating Rate Senior Notes, due 2007(a) |
500 | 500 | ||||
| 4.75% Senior Notes, due 2009 |
500 | 500 | ||||
| 5.75% Senior Notes, due 2014 |
599 | 599 | ||||
| 4.95% Senior Notes, due 2015 |
350 | 350 | ||||
| 6.50% Senior Notes, due 2034 |
296 | 296 | ||||
| 6.15% Junior Notes, due 2066 |
598 | — | ||||
| Total |
$ | 3,321 | $ | 2,736 | ||
| (a) | Accrual of interest based on three-month LIBOR plus 0.15% |
Long-term Senior Notes
In September 2005, we issued senior notes having an aggregate principal amount of $350 million, with an interest rate equal to 4.95% per year payable semi-annually, and maturing in October 2015 (“2015 Notes”). The 2015 Notes are our direct, unsecured obligations and will rank equally with all of our existing and future unsecured and unsubordinated obligations. We have the option to redeem all or a portion of the 2015 Notes, at any time with proper notice to the note holders at a price equal to the greater of 100% of principal or the sum of
176
Genworth Financial, Inc.
Notes to Consolidated Financial Statements—(Continued)
Years Ended December 31, 2006, 2005 and 2004
the present value of the remaining scheduled payments of principal and interest discounted at the then-current treasury rate plus an applicable spread. The net proceeds of $348 million from the issuance of the 2015 Notes were used to reduce our outstanding commercial paper borrowings.
On June 15, 2004, we issued senior notes having an aggregate principal amount of $1.9 billion. As a result of hedging arrangements entered into with respect to these securities, our effective interest rates will be 3.39% on the 2007 Notes, 4.48% on the 2009 Notes, 5.51% on the 2014 Notes and 6.35% on the 2034 Notes. These Notes are direct unsecured obligations and will rank without preference or priority among themselves and equally with all of our existing and future unsecured and unsubordinated obligations. We have the option to redeem all or a portion of the 2009 Notes, the 2014 Notes and the 2034 Notes at any time with proper notice to the note holders at a price equal to the greater of 100% of principal or the sum of the present values of the remaining scheduled payments of principal and interest discounted at the then-current treasury rate plus an applicable spread.
In June 2001, GEFAHI issued ¥60.0 billion of senior notes through a public offering at a price of ¥59.9 billion. ¥3.0 billion of the notes were retired during 2004. We have entered into arrangements to swap our obligations under these notes to a U.S. dollar obligation with a notional principal amount of $478 million and bearing interest at a rate of 4.84% per annum. The notes are unsecured and mature at par in 2011. As of December 31, 2006, we had $1 million of accrued interest relating to these notes. We assumed this obligation under these notes in 2004 in connection with our corporation formation and IPO.
Long-term Junior Subordinated Notes
In November 2006, we issued fixed-to-floating rate junior notes having an aggregate principal amount of $600 million, with an annual interest rate equal to 6.15% payable semi-annually, until November 15, 2016, at which point the annual interest rate will be equal to the three-month LIBOR plus 2.0025% payable quarterly, until the notes mature in November 2066 (“2066 Notes”). Subject to certain conditions, we have the right, on one or more occasions, to defer the payment of interest on the 2066 Notes during any period of up to 10 years without giving rise to an event of default and without permitting acceleration under the terms of the 2066 Notes. We will not be required to settle deferred interest payments until we have deferred interest for 5 years or made a payment of current interest. In the event of our bankruptcy, holders will have a limited claim for deferred interest.
We may redeem the 2066 Notes on November 15, 2036, the “scheduled redemption date,” but only to the extent that we have received net proceeds from the sale of certain qualifying capital securities. We may redeem the 2066 Notes (i) in whole or in part, at any time on or after November 15, 2016 at their principal amount plus accrued and unpaid interest to the date of redemption, or (ii) in whole or in part, prior to November 15, 2016 at their principal amount plus accrued and unpaid interest to the date of redemption or, if greater, a make-whole price.
The 2066 Notes will be subordinated to all existing and future senior, subordinated and junior subordinated debt of the company, except for any future debt that by its terms is not superior in right of payment, and will be effectively subordinated to all liabilities of our subsidiaries.
(c) Non-recourse Funding Obligations
We have issued non-recourse funding obligations in connection with our capital management strategy related to our term and universal life insurance businesses.
177
Genworth Financial, Inc.
Notes to Consolidated Financial Statements—(Continued)
Years Ended December 31, 2006, 2005 and 2004
The following table sets forth the non-recourse funding obligations (surplus notes) of the River Lake and Rivermont Life Insurance Companies, wholly owned, special purpose consolidated captive insurance subsidiaries as of December 31:
| (Amounts in millions) |
2006 | 2005 | ||||
| Issuance |
||||||
| River Lake I(a), due 2033 |
$ | 900 | $ | 600 | ||
| River Lake I(b), due 2033 |
200 | 200 | ||||
| River Lake II(a), due 2035 |
300 | 300 | ||||
| River Lake II(b), due 2035 |
300 | 300 | ||||
| River Lake III(b), due 2036 |
750 | — | ||||
| Rivermont I(b), due 2050 |
315 | — | ||||
| Total Non-recourse Funding Obligations |
$ | 2,765 | $ | 1,400 | ||
| (a) | Accrual of interest based on one-month LIBOR plus or minus margin |
| (b) | Accrual of interest based on one-month LIBOR plus margin |
The floating rate notes have been deposited into a series of trusts that have issued money market or term securities. Both principal and interest payments on the money market and term securities are guaranteed by a third-party insurance company. The holders of the money market or term securities cannot require repayment from us or any of our subsidiaries, other than the River Lake, and Rivermont Insurance Companies, as applicable, the direct issuers of the notes. We have provided a limited guarantee to Rivermont I, where under adverse interest rate, mortality or lapse scenarios (or combination thereof), which we consider remote, we may be required to provide additional funds to Rivermont I. First Colony Life Insurance Company has agreed to indemnify the issuers and the third-party insurer for certain limited costs related to the issuance of these obligations.
Any payment of principal, including by redemption, or interest on the notes may only be made with the prior approval of the Director of Insurance of the State of South Carolina in accordance with the terms of its licensing orders and in accordance with applicable law. The holders of the notes have no rights to accelerate payment of principal of the notes under any circumstances, including without limitation, for nonpayment or breach of any covenant. Each issuer reserves the right to repay the notes that it has issued at any time, subject to prior regulatory approval.
The weighted average interest rate on the non-recourse funding obligations as of December 31, 2006 and 2005 is 5.4% and 4.5%, respectively. Because the non-recourse funding obligations bear variable interest rates, carrying value approximates fair value as of December 31, 2006 and 2005.
(d) Equity Units
As part of our corporate formation, we issued $600 million of our Equity Units to GEFAHI, and GEFAHI sold all these Equity Units in a public offering concurrent with the IPO. The Equity Units initially were issued in the form of Corporate Units. Each Corporate Unit consisted of:
| • | a contract to purchase shares of our Class A Common Stock, which we refer to as the stock purchase contracts; and |
| • | a $25 ownership interest in our 3.84% senior notes due 2009, which we refer to in this section as the notes. |
The stock purchase contract that is a component of an Equity Unit requires the holder to purchase, and us to sell, for $25, on May 16, 2007, which we refer to as the purchase contract settlement date, a number of newly
178
Genworth Financial, Inc.
Notes to Consolidated Financial Statements—(Continued)
Years Ended December 31, 2006, 2005 and 2004
issued shares of our Class A Common Stock equal to the settlement rate. If the market value of our Class A Common Stock is greater than or equal to $23.5960, the threshold appreciation price, the settlement rate would be 1.0615 shares of our Class A Common Stock as of December 31, 2006. If the market value of our class A Common Stock is less than the threshold appreciation price but greater than $19.50, the reference price, the settlement rate will be a number of our Class A Common Stock equal to the stated amount of $25 divided by the market value. If the market value is less than or equal to the reference price, the settlement rate will be 1.2821 shares of our Class A Common Stock. Holders may settle their purchase contract anytime after May 28, 2005. Accordingly, upon settlement in the aggregate, we will receive proceeds of $600 million and issue between 25.4 million and 30.8 million new shares. We will also pay quarterly contract adjustment payments on each stock purchase contract at an annual rate of 2.16% of the stated amount of $25 per Equity Unit. During both of the years ended December 31, 2006 and 2005 we paid $13.0 million in contract adjustment payments. We recorded the estimated present value at issuance, $37 million, of the contract adjustment payments on the stock purchase contracts as other liabilities, with an offsetting decrease in additional paid-in-capital. When we make contract adjustment payments, they are charged to other liabilities, and we accrue interest expense on the unpaid balance at the rate of 3.84% per year. The fair value of the stock purchase contracts were $279 million and $308 million at December 31, 2006 and 2005, respectively.
On May 9, 2007, the notes will be remarketed. At that time, our remarketing agent will have the ability to reset the interest rate on the notes in order to generate sufficient remarketing proceeds to satisfy the holders’ obligation under the stock purchase contracts. If the initial remarketing is unsuccessful, the remarketing agent will attempt to remarket the notes, as necessary, on May 10 and 11, 2007. If all remarketing attempts are unsuccessful, holders of these notes will have the right to put their notes to us for an amount equal to the principal amount of their notes, plus accrued and unpaid interest, on the purchase contract settlement date.
The Equity Units are reflected in diluted earnings per share using the treasury stock method, and are dilutive when the weighted-average market price of our Class A Common Stock is greater than or equal to the threshold appreciation price. During the period from the date of issuance through December 31, 2006, our weighted-average market price fluctuated higher or lower than the threshold appreciation price.
Interest on the notes will be payable quarterly at the annual rate of 3.84% of the principal amount of the notes, to, but excluding May 16, 2007, the purchase contract settlement date. For each of the years ended December 31, 2006, 2005 and 2004, we incurred $23.0 million, $23.0 million and $13.9 million, respectively, of interest expense. As of December 31, 2006 and 2005, we had $2.9 million of interest accrued relating to these notes.
(e) Mandatorily Redeemable Preferred Stock
As part of our corporate formation, we issued $100 million of Series A Preferred Stock to GEFAHI. GEFAHI sold all the Series A Preferred Stock in a public offering concurrent with the IPO. As of December 31, 2005, 2 million shares of our authorized preferred stock have been designated 5.25% Cumulative Series A Preferred Stock and are outstanding. Dividends on the Series A Preferred Stock are fixed at an annual rate equal to 5.25% of the sum of (1) the stated liquidation value of $50 per share, plus (2) accumulated and unpaid dividends. Dividends are payable quarterly in arrears on March 1, June 1, September 1 and December 1 of each year. For each of the years ended December 31, 2006 and 2005, we paid dividends of $5.3 million, which has been recorded as interest expense in the consolidated financial statements. We are required to redeem the Series A Preferred Stock on June 1, 2011 in whole at a price of $50 per share, plus unpaid dividends accrued to the date of redemption. There are no provisions for early redemption. Except under certain conditions or otherwise required by applicable law, the holders of the Series A Preferred Stock have no voting rights.
179
Genworth Financial, Inc.
Notes to Consolidated Financial Statements—(Continued)
Years Ended December 31, 2006, 2005 and 2004
(f) Liquidity
Long-term borrowings, non-recourse funding obligations, senior notes underlying Equity Units and mandatorily redeemable preferred stock as of December 31, 2006 by maturity are as follows:
| (Amounts in millions) |
Amount | ||
| 2007(1) |
$ | 1,100 | |
| 2008 |
— | ||
| 2009 |
500 | ||
| 2010 |
— | ||
| 2011 and thereafter(2) |
5,193 | ||
| Total |
$ | 6,793 | |
| (1) | Includes the notes associated with the Equity Units that will be remarketed on May 9, 2007. |
| (2) | Repayment of $2,765 million of non-recourse funding agreements requires regulatory approval. |
Our liquidity requirements are principally met through dividends from our insurance subsidiaries to our parent company, cash flows from operations, the commercial paper program and our revolving credit facilities. As of December 31, 2006, we have an unused credit capacity within our revolving credit facilities of $1.8 billion.
(14) Income Taxes
The total provision (benefit) for income taxes for the years ended December 31:
| (Amounts in millions) |
2006 | 2005 | 2004 | ||||||||
| Current federal income taxes |
$ | 36 | $ | (302 | ) | $ | 1,478 | ||||
| Deferred federal income taxes |
349 | 703 | (1,194 | ) | |||||||
| Total federal income taxes |
385 | 401 | 284 | ||||||||
| Current state income taxes |
8 | (18 | ) | 27 | |||||||
| Deferred state income taxes |
3 | 19 | 31 | ||||||||
| Total state income taxes |
11 | 1 | 58 | ||||||||
| Current foreign income taxes |
182 | 59 | 184 | ||||||||
| Deferred foreign income taxes |
16 | 116 | (33 | ) | |||||||
| Total foreign income taxes |
198 | 175 | 151 | ||||||||
| Total provision for income taxes |
$ | 594 | $ | 577 | $ | 493 | |||||
The reconciliation of the federal statutory tax rate to the effective income tax rate is as follows:
| 2006 | 2005 | 2004 | |||||||
| Statutory U.S. federal income tax rate |
35.0 | % | 35.0 | % | 35.0 | % | |||
| Increase (reduction) in rate resulting from: |
|||||||||
| State income tax, net of federal income tax effect |
0.4 | 0.1 | (0.6 | ) | |||||
| Net tax benefit related to IPO(a) |
— | — | (2.9 | ) | |||||
| Tax exempt income |
(1.9 | ) | (2.1 | ) | (2.4 | ) | |||
| Effect of foreign operations |
(1.9 | ) | 0.2 | 0.9 | |||||
| Other, net |
(0.6 | ) | (1.1 | ) | 0.1 | ||||
| Effective rate |
31.0 | % | 32.1 | % | 30.1 | % | |||
| (a) | Tax benefit of $47 million arising from our separation from GE on May 24, 2004. |
180
Genworth Financial, Inc.
Notes to Consolidated Financial Statements—(Continued)
Years Ended December 31, 2006, 2005 and 2004
The components of the net deferred income tax liability as of December 31, are as follows:
| (Amounts in millions) |
2006 | 2005 | ||||||
| Assets: |
||||||||
| Investments |
$ | 413 | $ | 371 | ||||
| Future annuity and contract benefits |
— | 55 | ||||||
| Present value of future profits |
69 | 26 | ||||||
| Accrued commission and general expenses |
129 | 135 | ||||||
| NOL carryforwards |
239 | 40 | ||||||
| Other |
150 | 89 | ||||||
| Gross deferred income tax assets |
1,000 | 716 | ||||||
| Valuation allowance |
(56 | ) | (70 | ) | ||||
| Total deferred income tax assets |
944 | 646 | ||||||
| Liabilities: |
||||||||
| Net unrealized gains on investment securities |
231 | 410 | ||||||
| Net unrealized gains on derivatives |
208 | 216 | ||||||
| Future annuity and contract benefits |
388 | — | ||||||
| Deferred acquisition costs |
1,411 | 1,246 | ||||||
| Other |
256 | 160 | ||||||
| Total deferred income tax liabilities |
2,494 | 2,032 | ||||||
| Net deferred income tax liability |
$ | 1,550 | $ | 1,386 | ||||
The above valuation allowance of $56 million relates to state deferred tax assets and foreign net operating losses at December 31, 2006, while the $70 million valuation allowance at December 31, 2005 relates to state deferred tax assets and foreign tax credits. The state deferred tax assets relate primarily to the future deductions associated with the Section 338 elections and non-insurance net operating loss carryforwards. The excess foreign tax credits through December 31, 2005 reflected inefficiencies in our post-IPO structure. Based on our analysis, we believe it is more likely than not that the results of future operations and implementations of tax planning strategies will generate sufficient taxable income to enable us to realize the deferred tax assets for which we have not established valuation allowances.
Net operating loss carryforwards (“NOL”) amounted to $684 million as of December 31, 2006 and, if unused, will expire beginning in 2020. The benefits of the NOL carryforwards have been recognized in our consolidated financial statements, except to the extent of the valuation allowances described above relating to state and foreign taxes.
As a consequence of our separation from GE, and our joint election with GE to treat that separation as an asset sale under section 338 of the Internal Revenue Code, we became entitled to additional tax deductions in post-IPO periods. We have recorded on our Consolidated Balance Sheets, at $656 million and $659 million, our estimates of the remaining deferred tax benefits (reducing net deferred income tax liabilities) associated with these deductions as of December 31, 2006 and 2005, respectively. We are obligated, pursuant to our Tax Matters Agreement with GE, to make fixed payments to GE, over the next 16 years, on an after-tax basis and subject to a cumulative cap of $640 million, 80% of the projected tax savings associated with the section 338 deductions. We recorded net interest expense of $22 million, $25 million and $10 million for the years ended December 31, 2006, 2005 and 2004, respectively, reflecting accretion of our liability at the Tax Matters Agreement rate of 5.72%. We have recorded the estimated $380 million and $379 million present value of our remaining obligation
181
Genworth Financial, Inc.
Notes to Consolidated Financial Statements—(Continued)
Years Ended December 31, 2006, 2005 and 2004
to GE as of December 31, 2006 and 2005, respectively, as a liability on our Consolidated Balance Sheets. Both our IPO-related deferred tax assets and our obligation to GE are estimates subject to change.
U.S. deferred income taxes are not provided on unremitted foreign earnings that are considered permanently reinvested, which at December 31, 2006 amounted to approximately $300 million. It is not practicable to determine the income tax liability that might be incurred if all such earnings were remitted to the U.S.
The American Jobs Creation Act of 2004 contained a Foreign Earnings Repatriation Provision, which grants a one-time dividend received deduction for repatriation of qualifying foreign earnings to a U.S. taxpayer. On December 22, 2005 we repatriated approximately $61 million of foreign earnings under this provision. As of December 31, 2005, Genworth had provided U.S. deferred tax liabilities on all of its undistributed foreign earnings, including a valuation allowance for excess foreign tax credits. Accordingly, the repatriation did not materially change Genworth’s total tax position, as the current tax benefit associated with the one-time dividends received deduction was offset by a corresponding increase in excess foreign tax credits.
Our current income tax asset (liability) is ($30) million and $39 million as of December 31, 2006 and 2005, respectively.
(15) Supplemental Cash Flow Information
Net cash (received) paid for taxes is $171 million, $48 million and $(128) million and cash paid for interest is $329 million, $241 million and $282 million for the years ended December 31, 2006, 2005 and 2004, respectively.
In connection with our corporate formation on May 24, 2004, we completed several non-cash transactions with our then majority stockholder. These transactions included the transfer of the assets and liabilities of entities that did not remain with Genworth, as well as non-cash consideration paid to our then-sole stockholder through the issuance of debt and other liabilities. The following table details these transactions as well as other non-cash items:
Supplemental schedule of non-cash investing and financing activities
| Years ended December 31, | ||||||||||
| (Amounts in millions) |
2006 | 2005 | 2004 | |||||||
| Excluded net assets: |
||||||||||
| Assets (net of cash of $838 in 2004) excluded in our corporate formation |
$ | — | $ | — | $ | 21,873 | ||||
| Liabilities excluded in corporate formation |
— | — | (20,962 | ) | ||||||
| Net assets transferred to majority stockholder in connection with corporate formation |
$ | — | $ | — | $ | 911 | ||||
| Other non-cash transactions in connection with our corporate formation: |
||||||||||
| Issuance of senior notes underlying equity units |
$ | — | $ | — | $ | 600 | ||||
| Issuance of Series A preferred stock |
— | — | 100 | |||||||
| Issuance of contingent note |
— | — | 550 | |||||||
| Issuance of short-term note |
— | — | 2,400 | |||||||
| Total other non-cash transactions in connection with our corporate formation |
$ | — | $ | — | $ | 3,650 | ||||
182
Genworth Financial, Inc.
Notes to Consolidated Financial Statements—(Continued)
Years Ended December 31, 2006, 2005 and 2004
| Years ended December 31, | |||||||||||
| (Amounts in millions) |
2006 | 2005 | 2004 | ||||||||
| Non-cash transactions subsequent to our corporate formation |
|||||||||||
| Stock-based compensation |
$ | 41 | $ | 50 | $ | 29 | |||||
| Change in collateral for securities lending transactions |
(5 | ) | 5 | (44 | ) | ||||||
| Dividends declared not yet paid |
40 | 35 | 32 | ||||||||
| Total non-cash transactions subsequent to our corporate formation |
$ | 76 | $ | 90 | $ | 17 | |||||
(16) Stock-Based Compensation
On January 1, 2006, we adopted SFAS No. 123R under the modified prospective transition method. The statement requires the measurement and recognition of compensation expense for all share-based awards made to employees and directors, including stock options, stock appreciation rights (“SARs”), restricted stock units (“RSUs”) and deferred stock units (“DSUs”) under the 2004 Genworth Financial, Inc. Omnibus Incentive Plan (“Omnibus Incentive Plan”). We previously accounted for these awards under the fair value expense provisions of SFAS No. 123. Effective January 1, 2006, we recognized a $4 million after-tax increase to income related to our cumulative effect of adopting SFAS No. 123R.
We have recorded stock-based compensation expense for the years ended December 31:
| (Amounts in millions) |
2006 | 2005 | 2004 | ||||||
| Stock-based compensation expense |
$ | 34 | $ | 50 | $ | 29 | |||
For awards issued prior to January 1, 2006, stock-based compensation expense is recognized on a graded vesting attribution method over the awards’ respective vesting schedule. For awards issued after January 1, 2006, stock-based compensation expense is recognized evenly on a straight-line attribution method over the awards’ respective vesting period.
For purposes of determining the estimated fair value of stock-based payment awards on the date of grant we use the Black-Scholes Model. The Black-Scholes Model requires the input of certain assumptions that involve judgment. Management periodically evaluates the assumptions and methodologies used to calculate estimated fair value of share-based compensation. Circumstances may change and additional data may become available over time, which could result in changes to these assumptions and methodologies.
The following table contains the stock option weighted-average grant-date fair value information and related valuation assumptions for the years ended December 31, 2006, 2005 and 2004. Fair value is estimated using the Black-Scholes Model.
| 2006 | 2005 | 2004 | ||||||||||
| Estimated fair value per option |
$ | 11.60 | $ | 10.49 | $ | 6.66 | ||||||
| Valuation Assumptions: |
||||||||||||
| Expected term (years) |
6.0 | 6.0 | 6.0 | |||||||||
| Expected volatility |
28.0 | % | 30.0 | % | 34.2 | % | ||||||
| Expected dividend yield |
0.9 | % | 1.1 | % | 1.3 | % | ||||||
| Risk-free interest rate |
4.8 | % | 4.0 | % | 3.5 | % | ||||||
Under the Omnibus Incentive Plan, we are authorized to grant 38 million equity awards.
183
Genworth Financial, Inc.
Notes to Consolidated Financial Statements—(Continued)
Years Ended December 31, 2006, 2005 and 2004
For the years ended December 31, 2006 and 2005, we granted stock options with exercise prices ranging from $32.45 to $35.61 and $26.68 to $33.52, respectively, which equaled the closing market prices on the date of grant and have an exercise term of 10 years. The stock options will vest in 20% annual increments commencing on the first anniversary of the date of grant. Additionally, during the year ended December 31, 2006 and 2005 we issued RSUs with restriction periods ranging from 3 to 5 years and a fair value of $34.15 and $30.62, respectively, which is measured at the market price of a share of our nonrestricted stock on the grant date. Additionally, during the years ended December 31, 2006 and 2005, we granted SARs with exercise prices of $34.13 and $32.10, respectively.
A summary of stock option activity for the years ended December 31, 2006 and 2005 is presented below:
| (Shares in thousands) |
Shares subject to option |
Weighted average exercise price | ||||
| Balance as of January 1, 2005 |
15,197 | $ | 20.40 | |||
| Granted |
1,835 | $ | 31.75 | |||
| Exercised |
(489 | ) | $ | 13.79 | ||
| Forfeited |
(772 | ) | $ | 20.34 | ||
| Expired |
— | $ | — | |||
| Balance as of January 1, 2006 |
15,771 | $ | 21.93 | |||
| Granted |
1,763 | $ | 34.14 | |||
| Exercised |
(2,738 | ) | $ | 20.18 | ||
| Forfeited |
(834 | ) | $ | 22.62 | ||
| Expired |
— | $ | — | |||
| Balance as of December 31, 2006 |
13,962 | $ | 23.77 | |||
| Exercisable as of December 31, 2006 |
4,197 | $ | 23.15 | |||
A summary of the status of our other equity-based awards as of December 31, 2006 and 2005 is presented below:
| Restricted stock units (RSUs) |
Deferred stock units (DSUs) |
Stock appreciation rights (SARs) | |||||||||||||||
| (Awards in thousands) |
Number of awards |
Weighted average grant date fair value |
Number of awards |
Weighted average fair value |
Number of awards |
Weighted average grant date fair value | |||||||||||
| Balance as of January 1, 2005 |
1,458 | $ | 19.50 | 8 | $ | 24.22 | 6,255 | $ | 19.53 | ||||||||
| Granted |
920 | $ | 30.45 | 12 | $ | 31.02 | 629 | $ | 32.10 | ||||||||
| Exercised |
(438 | ) | $ | 19.50 | — | $ | — | — | $ | — | |||||||
| Terminated |
(60 | ) | $ | 23.37 | — | $ | — | — | $ | — | |||||||
| Balance as of January 1, 2006 |
1,880 | $ | 24.74 | 20 | $ | 28.38 | 6,884 | $ | 7.02 | ||||||||
| Granted |
470 | $ | 34.15 | 26 | $ | 34.10 | 731 | $ | 34.13 | ||||||||
| Exercised |
(113 | ) | $ | 19.51 | — | $ | — | (698 | ) | $ | 19.67 | ||||||
| Terminated |
(221 | ) | $ | 24.60 | — | $ | — | (841 | ) | $ | 21.29 | ||||||
| Balance as of December 31, 2006 |
2,016 | $ | 27.24 | 46 | $ | 32.11 | 6,076 | $ | 22.33 | ||||||||
184
Genworth Financial, Inc.
Notes to Consolidated Financial Statements—(Continued)
Years Ended December 31, 2006, 2005 and 2004
As of December 31, 2006 and 2005, there was $86 million and $124 million, respectively, of total unrecognized stock-based compensation expense related to non-vested awards not yet recognized. This expense is expected to be recognized over a weighted average period of two years.
Cash received from stock options exercised for the years ended December 31, 2006 and 2005 was $55 million and $7 million, respectively. New shares were issued to settle all exercised awards. The actual tax benefit realized for the tax deductions from the exercise of equity based awards was $18 million and $7 million for the years ended December 31, 2006 and 2005, respectively.
The following table summarizes information about stock options outstanding as of December 31, 2006:
| Outstanding | Exercisable | |||||||||||
| Exercise price range |
Shares in thousands |
Average life(1) |
Average exercise price |
Shares in thousands |
Average exercise price | |||||||
| $14.11 – $18.51 |
889 | 5.70 | $ | 17.28 | 534 | $ | 17.29 | |||||
| $19.45 – $22.67 |
8,236 | 7.22 | $ | 19.71 | 1,882 | $ | 20.35 | |||||
| $23.20 – $27.95 |
1,201 | 4.25 | $ | 27.28 | 1,143 | $ | 27.37 | |||||
| $28.00 – $36.62 |
3,635 | 9.21 | $ | 33.40 | 637 | $ | 34.19 | |||||
| $37.89 – $39.60 |
1 | 4.56 | $ | 38.77 | 1 | $ | 38.77 | |||||
| 13,962 | 7.23 | $ | 23.77 | 4,197 | $ | 23.15 | ||||||
| (1) | Average contractual life remaining in years |
(17) Related Party Transactions
In the first quarter of 2006, GEFAHI completed its final secondary offering of 71.2 million shares of our Class B Common Stock. As a result GEFAHI no longer owns any of our outstanding common stock and ceases to be a related party. As such, all GE related party information is presented for the three month period ended March 31, 2006 and the years ended December 31, 2005 and 2004.
GE provided a variety of products and services to us prior to the IPO, and we provided a variety of products and services to GE. The services we received from GE included:
| • | customer service, transaction processing and a variety of functional support services provided by GENPACT International formerly GE Capital International Services, or GECIS; |
| • | employee benefit processing and payroll administration; |
| • | employee training programs, including access to GE training courses; |
| • | insurance coverage under the GE insurance program; |
| • | information systems, network and related services; |
| • | leases for vehicles, equipment and facilities; and |
| • | other financial advisory services such as tax consulting, capital markets services, research and development activities, and trademark licenses. |
Our total expense for these services was $13 million, $34 million and $65 million for the years ended December 31, 2006, 2005 and 2004, respectively. We also receive investment management and related administrative services provided by GE Asset Management (“GEAM”), for which we incurred expenses of $5 million, $22 million and $33 million for the period ended March 31, 2006 and years ended December 31, 2005 and 2004, respectively.
185
Genworth Financial, Inc.
Notes to Consolidated Financial Statements—(Continued)
Years Ended December 31, 2006, 2005 and 2004
We provide services to certain of GE’s insurance businesses that we did not acquire. These services include finance, information systems, network services and regulatory support. GE paid us $40 million in equal quarterly installments during each of the first two years following the completion of the IPO for our provision of the transition services to GE. This arrangement was extended through May 2007 for $2 million, payable in equal quarterly installments. The charges for the transition services generally are intended to allow the providing company to fully recover the allocated direct costs of providing the services, plus all out-of-pocket costs and expenses, generally without profit.
We have agreed to provide certain management consulting services to GE for a period of five years following the IPO. These services include delivering training, providing consultation and strategic advice with respect to actuarial, regulatory and other emerging issues, planning and participating in meetings with rating agencies and regulators, participating in government relations activities and various other activities. In consideration for these services, GE will pay us a fee of $1 million per month during the first four years following the completion of the IPO and $0.5 million per month during the fifth year. GE cannot terminate this arrangement before the expiration of the five-year term.
We entered into three agreements with affiliates of GE, effective as of January 1, 2004, to manage a pool of municipal GICs, issued by those affiliates. Pursuant to these agreements, we have agreed to originate municipal GIC liabilities and advise the GE affiliates regarding the investment, administration and management of their assets that support those liabilities. We recorded fees and reimbursements of $10 million, $40 million and $37 million for the period ended March 31, 2006 and years ended December 31, 2005 and 2004, respectively, for these services. We also will receive reimbursement of our operating expenses under each of the agreements. The three agreements expired December 31, 2006. As of January 1, 2007, we entered into a new agreement with GE relating to the management of their municipal GICs. Under this agreement we agreed to sell the business, which provided services under the agreements outlined above for $1 million. We also agreed to provide consulting services for a 2-year period and in return we expect to receive fees of $19 million in year 1 and $10 million in year 2.
Prior to the completion of the IPO, we offered a broad range of institutional asset management services to third parties. GEAM provided the portfolio management services for this business, and we provided marketing, sales and support services. We did not acquire the institutional asset management services business from GEFAHI, but pursuant to an agreement among GEAM, GEFAHI and us, we have agreed to continue to provide services to GEAM and GEFAHI related to this asset management business, including client introduction services, asset retention services and compliance support. GEFAHI has agreed to pay us a fee of up to $10 million per year for four years to provide these services. The fee will be determined based upon the level of third-party assets under management managed by GEAM over the four-year term following the completion of the IPO.
We entered into the Tax Matters Agreement in connection with the IPO. The Tax Matters Agreement, among other things, governs our continuing tax sharing arrangements with GE relating to pre-separation periods, and also allocates responsibility and benefits associated with the elections made in connection with our separation from GE. The Tax Matters Agreement also allocates rights, obligations and responsibilities in connection with certain administrative matters relating to taxes, as described in note 14.
We have also entered into several significant reinsurance transactions with UFLIC as part of our corporate reorganization as described in note 9.
We distribute some of our products through affiliates. We distribute our payment protection insurance, in part, through arrangements with GE’s consumer finance division and other GE entities, for which we have
186
Genworth Financial, Inc.
Notes to Consolidated Financial Statements—(Continued)
Years Ended December 31, 2006, 2005 and 2004
received gross written premiums of $99 million, $424 million and $380 million during 2006, 2005 and 2004, respectively. We have also reinsured lease obligation insurance and credit insurance marketed by GE’s consumer finance division and other GE entities, for which we received premiums of $5 million, $22 million and $40 million during 2006, 2005 and 2004, respectively.
For the period ended March 31, 2006 and years ended December 31, 2005 and 2004, we received an aggregate of $2 million, $10 million and $10 million, respectively, for services provided pursuant to the Asset Management Agreement.
In December 2004, we entered into a Consideration Agreement with GE Capital International (Mauritius) (“GECIM”), a subsidiary of GE. The Consideration Agreement set forth the terms in which we participated in GE’s sale of its global outsourcing business. Pursuant to the Consideration Agreement, upon the closing of the sale we received consideration of $40 million from GECIM related to our waiver of certain contractual rights and entered into an Outsourcing Services Amendment Agreement (“Service Agreement”) with GECIS International Holdings, Luxembourg, Swiss Branch Zug, a Luxembourg company. The consideration of $40 million is included in policy fees and other income on the Consolidated Statements of Income as a result of our waiver of contractual rights under the Service Agreement. We also agreed to purchase a minimum volume of services, at market rates, during an eight-year period. Our minimum volume commitment during the each of the first five years of the service agreement will be $24 million, and our minimum volume commitment during the sixth, seventh and eighth years will be $18 million, $12 million and $6 million, respectively.
(18) Fair Value of Financial and Derivative Instruments
Assets and liabilities that are reflected in the accompanying consolidated financial statements at fair value are not included in the following disclosure of fair value; such items include cash and cash equivalents, investment securities, separate accounts, securities lending collateral and derivative financial instruments. Other financial assets and liabilities—those not carried at fair value—are discussed below. Apart from certain of our borrowings and certain marketable securities, few of the instruments discussed below are actively traded and their fair values must often be determined using models. The fair value estimates are made at a specific point in time, based upon available market information and judgments about the financial instruments, including estimates of the timing and amount of expected future cash flows and the credit standing of counterparties. Such estimates do not reflect any premium or discount that could result from offering for sale at one time our entire holdings of a particular financial instrument, nor do they consider the tax impact of the realization of unrealized gains or losses. In many cases, the fair value estimates cannot be substantiated by comparison to independent markets, nor can the disclosed value be realized in immediate settlement of the financial instrument.
The basis on which we estimate fair value is as follows:
Commercial mortgage loans. Based on quoted market prices, recent transactions and/or discounted future cash flows, using current market rates at which similar loans would have been made to similar borrowers.
Other financial instruments. Based on comparable market transactions, discounted future cash flows, quoted market prices, and/or estimates of the cost to terminate or otherwise settle obligations.
Borrowings, non-recourse funding obligations, senior notes underlying equity units. Based on market quotes or comparables.
Investment contract benefits. Based on expected future cash flows, discounted at currently offered discount rates for immediate annuity contracts or cash surrender values for single premium deferred annuities.
187
Genworth Financial, Inc.
Notes to Consolidated Financial Statements—(Continued)
Years Ended December 31, 2006, 2005 and 2004
Insurance—mortgage. Based on carrying value, which approximates fair value.
Mandatorily redeemable preferred stock. Based on quoted market prices or discounted future cash flows.
The following represents the fair value of financial assets and liabilities as of December 31:
| 2006 | 2005 | |||||||||||||||||||
| (Amounts in millions) |
Notional amount |
Carrying amount |
Estimated fair value |
Notional amount |
Carrying amount |
Estimated fair value | ||||||||||||||
| Assets: |
||||||||||||||||||||
| Commercial mortgage loans |
$ | (a | ) | $ | 8,491 | $ | 8,457 | $ | (a | ) | $ | 7,558 | $ | 7,682 | ||||||
| Other financial instruments |
(a | ) | 400 | 412 | (a | ) | 337 | 355 | ||||||||||||
| Liabilities: |
||||||||||||||||||||
| Borrowings and related instruments(b): |
||||||||||||||||||||
| Borrowings |
(a | ) | 3,520 | 3,562 | (a | ) | 2,888 | 2,935 | ||||||||||||
| Non-recourse funding obligations |
(a | ) | 2,765 | 2,765 | (a | ) | 1,400 | 1,400 | ||||||||||||
| Senior notes underlying equity units |
(a | ) | 600 | 601 | (a | ) | 600 | 606 | ||||||||||||
| Mandatorily redeemable preferred stock |
(a | ) | 100 | 101 | (a | ) | 100 | 100 | ||||||||||||
| Investment contract benefits |
(a | ) | 30,588 | 30,524 | (a | ) | 32,098 | 32,022 | ||||||||||||
| Performance guarantees, principally letters of credit |
119 | — | — | 119 | — | — | ||||||||||||||
| Insurance—mortgage |
(a | ) | 427 | 427 | (a | ) | 330 | 330 | ||||||||||||
| Unearned premiums—mortgage |
(a | ) | 2,333 | 2,333 | (a | ) | 1,870 | 1,870 | ||||||||||||
| Other firm commitments: |
||||||||||||||||||||
| Ordinary course of business lending commitments |
298 | — | — | 210 | — | — | ||||||||||||||
| Commitments to fund limited partnerships |
208 | — | — | 99 | — | — | ||||||||||||||
| (a) | These financial instruments do not have notional amounts. |
| (b) | See note 13. |
Our business activities routinely deal with fluctuations in interest rates, currency exchange rates and other asset prices. We use derivative financial instruments to mitigate or eliminate certain of these risks. We follow strict policies for managing each of these risks, including prohibition on derivatives market-making, speculative derivatives trading or other speculative derivatives activities. These policies require the use of derivative instruments in concert with other techniques to reduce or eliminate these risks.
A reconciliation of current period changes for the years ended December 31, 2006 and 2005, net of applicable income taxes in the separate component of stockholders’ equity labeled “derivatives qualifying as hedges”, follows:
| (Amounts in millions) |
2006 | 2005 | |||||
| Derivatives qualifying as effective accounting hedges as of January 1 |
$ | 389 | $ | 268 | |||
| Current period increases in fair value, net of deferred taxes of $(9) and $42 |
(15 | ) | 81 | ||||
| Reclassification to net income, net of deferred taxes of $1 and $23 |
1 | 40 | |||||
| Balance as of December 31 |
$ | 375 | $ | 389 | |||
188
Genworth Financial, Inc.
Notes to Consolidated Financial Statements—(Continued)
Years Ended December 31, 2006, 2005 and 2004
The $375 million, net of taxes, recorded in stockholders’ equity at December 31, 2006 is expected to be reclassified to future income, concurrently, with and primarily offsetting changes in interest expense and interest income on floating-rate instruments. Of this amount, $25 million, net of income taxes, is expected to be reclassified to income in the year ending December 31, 2007. Actual amounts may vary from this amount as a result of market conditions. All forecasted transactions currently being hedged are expected to occur by 2035. No amounts were reclassified to income during the year ended December 31, 2006 and 2005 in connection with forecasted transactions that were no longer considered probable of occurring.
Positions in derivative instruments. The following table sets forth our positions in derivative instruments and the estimated fair values as of the dates indicated. The fair value of derivative instruments, including financial futures, interest rate and foreign currency swaps, and equity index options, are based upon quotations obtained from dealers or other reliable sources.
| December 31, | |||||||||||||
| 2006 | 2005 | ||||||||||||
| (Amounts in millions) |
Notional value |
Estimated fair value |
Notional value |
Estimated fair value | |||||||||
| Interest rate swaps |
$ | 17,832 | $ | 496 | $ | 7,894 | $ | 508 | |||||
| Foreign currency swaps |
567 | (8 | ) | 533 | 4 | ||||||||
| Equity index options |
323 | 22 | 265 | 21 | |||||||||
| Financial futures |
19 | — | 27 | — | |||||||||
| Total |
$ | 18,741 | $ | 510 | $ | 8,719 | $ | 533 | |||||
As of December 31, 2006 and 2005, the fair value of derivatives in a gain position and recorded in other invested assets was $543 million and $559 million, respectively, and the fair value of derivatives in a loss position and recorded in other liabilities was $33 million and $26 million, respectively.
Earnings effects of derivatives. The table that follows provides additional information about the earnings effects of derivatives. In the context of hedging relationships, “effectiveness” refers to the degree to which fair value changes in the hedging instrument offset corresponding fair value changes in the hedged item attributable to the risk being hedged. Certain elements of hedge positions cannot qualify for hedge accounting whether effective or not, and must therefore be marked to market through income. Time value of purchased options is the most common example of such elements in instruments we use. Pre-tax income effects of such items for the year ended December 31, 2006 are shown in the following table as “Amounts excluded from the measure of effectiveness.”
| (Amounts in millions) |
Cash flow hedges |
Fair value hedges | ||||
| Ineffectiveness |
$ | 3 | $ | — | ||
| Amounts excluded from the measure of effectiveness |
$ | — | $ | — | ||
We hold certain derivative instruments that do not qualify for hedge accounting. The changes in fair value of these instruments are recognized currently in income. For the periods ended December 31, 2006, 2005 and 2004, the effect on pre-tax income was $5 million, $18 million and $2 million, respectively.
Derivative counterparty credit risk. We manage derivative counterparty credit risk on an individual counterparty basis, which means that gains and losses are netted for each counterparty to determine the amount at risk. When a counterparty exceeds credit exposure limits in terms of amounts owed to us, typically as the result
189
Genworth Financial, Inc.
Notes to Consolidated Financial Statements—(Continued)
Years Ended December 31, 2006, 2005 and 2004
of changes in market conditions, no additional transactions are executed until the exposure with that counterparty is reduced to an amount that is within the established limit. The swaps that are executed under master swap agreements contain mutual credit downgrade provisions that provide the ability to require assignment or replacement in the event either parties unsecured debt rating is downgraded below Moody’s “Baa” or S&P’s “BBB.” If the downgrade provisions had been triggered as of December 31, 2006, we could have been required to disburse up to $3 million and claim up to $161 million from counterparties. This represents the net fair value of losses and gains by counterparty, less $353 million of available collateral held. As of December 31, 2006 and 2005, gross fair value gains were $514 million and $538 million, respectively. As of December 31, 2006 and 2005, gross fair value losses were $3 million and $5 million, respectively.
Swaps and purchased options with contractual maturities longer than one year are conducted within our credit policy constraints. Our policy permits us to enter into derivative transactions with counterparties rated “A3” by Moody’s and “A-” by S&P if the agreements governing such transactions require both us and the counterparties to provide collateral in certain circumstances. As of December 31, 2006 and 2005, we retained collateral of $399 million and $362 million, respectively, related to these agreements including over collateralization from certain counterparties.
(19) Securitization Entities
We have used third-party entities to facilitate asset securitizations. Disclosure requirements related to off-balance sheet arrangements encompass a broader array of arrangements than those at risk for consolidation. These arrangements include transactions with term securitization entities, as well as transactions with conduits that are sponsored by third parties. As of December 31, 2006 and 2005, assets in these entities, which are Qualified Special Purposes Entities (“QSPE’s”), were $1.8 billion and $1.5 billion, respectively.
An analysis of total “securitized assets” as of December 31 was as follows:
| (Amounts in millions) |
2006 | 2005 | ||||
| Receivables secured by: |
||||||
| Commercial mortgage loans |
$ | 853 | $ | 1,001 | ||
| Fixed maturities |
208 | 389 | ||||
| Other assets |
743 | 803 | ||||
| Total securitized assets |
$ | 1,804 | $ | 2,193 | ||
| Consolidated assets held by securitization entities |
$ | — | $ | 729 | ||
| Off-balance sheet: |
||||||
| Sponsored and supported |
1,154 | 759 | ||||
| Other |
650 | 705 | ||||
| Total securitized assets |
$ | 1,804 | $ | 2,193 | ||
We evaluated the economic, liquidity and credit risk related to the above Special Purpose Entities (“SPE’s”) and believed that the likelihood is remote that any such arrangements could have had a significant adverse effect on our financial position, results of operations, or liquidity. Financial support for certain SPE’s was provided under credit support agreements, in which we provided limited recourse for a maximum of $119 million of credit losses. Assets with credit support were funded by demand notes that were further enhanced with support provided by a third-party. We recorded liabilities for such guarantees based on our best estimate of probable losses. We were not required to make any payments under any of the credit support agreements. These agreements remained in place throughout the life of the related entities.
190
Genworth Financial, Inc.
Notes to Consolidated Financial Statements—(Continued)
Years Ended December 31, 2006, 2005 and 2004
The following table summarizes the current balance of assets sold to QSPE’s as of December 31:
| (Amounts in millions) |
2006 | 2005 | ||||
| Assets—collateralized by: |
||||||
| Commercial mortgage loans |
$ | 853 | $ | 705 | ||
| Fixed maturities |
208 | — | ||||
| Other receivables |
743 | 759 | ||||
| Total assets |
$ | 1,804 | $ | 1,464 | ||
Sales of securitized assets to QSPEs resulted in a gain or loss amounting to the net of sales proceeds, the carrying amount of net assets sold, the fair value of servicing rights and retained interests and an allowance for losses. Amounts recognized in our consolidated financial statements related to sales to QSPEs as of December 31 were as follows:
| 2006 | 2005 | |||||||||||
| (Amounts in millions) |
Cost | Fair value |
Cost | Fair value | ||||||||
| Retained interests—assets |
$ | 147 | $ | 203 | $ | 125 | $ | 173 | ||||
| Servicing asset |
— | — | — | — | ||||||||
| Recourse liability |
— | — | — | — | ||||||||
| Total |
$ | 147 | $ | 203 | $ | 125 | $ | 173 | ||||
Retained interests. In certain securitization transactions, we retained an interest in transferred assets. Those interests take various forms and may be subject to credit prepayment and interest rate risks. When we securitized receivables, we determined the fair value based on discounted cash flow models that incorporate, among other things, assumptions including credit losses, prepayment speeds and discount rates. These assumptions were based on our experience, market trends and anticipated performance related to the particular assets securitized. Subsequent to recording retained interests, we reviewed recorded values quarterly in the same manner and using current assumptions.
Servicing assets. Following a securitization transaction, we retained the responsibility for servicing the receivables, and, as such, were entitled to receive an ongoing fee based on the outstanding principal balances of the receivables. There were no servicing assets nor liabilities recorded as the benefits of servicing the assets were adequate to compensate an independent servicer for its servicing responsibilities.
Recourse liability. As described previously, under credit support agreements we provided recourse for credit losses in special purpose entities. We provided for expected credit losses under these agreements and such amounts approximated fair value.
GE Capital, our former indirect majority stockholder, provides credit and liquidity support to a funding conduit it sponsored, which exposes it to a majority of the risks and rewards of the conduit’s activities and therefore makes GE Capital the primary beneficiary of the funding conduit. Upon adoption of FIN No. 46, Consolidation of Variable Interest Entities, GE Capital was required to consolidate the funding conduit because of this financial support. As a result, assets and liabilities of certain previously off-balance sheet securitization entities, for which we were the transferor, were required to be included in our consolidated financial statements because the funding conduit no longer qualified as a third-party. The assets and liabilities associated with these
191
Genworth Financial, Inc.
Notes to Consolidated Financial Statements—(Continued)
Years Ended December 31, 2006, 2005 and 2004
securitization entities were reported in the corresponding financial statement captions in our Consolidated Balance Sheet, and the assets are noted as restricted due to the lack of legal control we have over them. We applied the same accounting policies to these restricted assets and liabilities as we do to our unrestricted assets and liabilities.
As a result of GE Capital no longer having an ownership interest in us, in March 2006, the respective funding conduit re-qualified as a third-party and these securitization entities regained their qualifying status under SFAS No. 140, Accounting for Transfers and Servicing of Financial Assets and Extinguishment of Liabilities. As a result, the assets were effectively re-securitized and the related assets and liabilities were derecognized from our consolidated financial statements. This resulted in a reduction from December 31, 2005 balances of $685 million, $44 million, $660 million and $15 million of restricted investments held by securitization entities, other assets, borrowings related to securitization entities and other liabilities, respectively. We continue to hold a retained interest in the form of interest-only strips classified as fixed maturity securities available-for-sale in our Consolidated Balance Sheets. We recognized an investment loss on sale of $11 million, net of tax, from this re-securitization transaction in 2006. There were no off-balance sheet securitizations in 2005 and 2004.
The following table summarizes the assets and liabilities associated with these consolidated entities, which were included in Corporate and Other for reporting purposes, as of December 31, 2005:
| (Amounts in millions) |
2005 | ||
| Assets |
|||
| Restricted investments held by securitization entities |
$ | 685 | |
| Other assets |
44 | ||
| Total(a) |
$ | 729 | |
| Liabilities |
|||
| Borrowings related to securitization entities |
$ | 660 | |
| Other liabilities |
15 | ||
| Total |
$ | 675 | |
| (a) | Includes $25 million of former retained interests in securitized assets as of December 31, 2005, that were consolidated. |
As of December 31, 2005, restricted investments held by securitization entities consisted of $389 million of fixed maturities and $296 million of commercial mortgage loans. These balances decreased as the assets mature because we did not sell any additional assets to these consolidated entities. In addition, as of December 31, 2005, the borrowings related to securitization entities consisted of $373 million at a fixed interest rate of 5.528% due June 2025 and $287 million at a fixed rate of 6.0175% due October 2023. These borrowings were required to be paid down as principal is collected on the restricted investments held by the securitization entities and accordingly the repayment of these borrowings follows the maturity or prepayment, as permitted, of the restricted investments.
192
Genworth Financial, Inc.
Notes to Consolidated Financial Statements—(Continued)
Years Ended December 31, 2006, 2005 and 2004
As of December 31, 2005, the amortized cost, gross unrealized gains and losses, and estimated fair value of our restricted fixed maturities held by securitization entities were as follows:
| 2005 |
Amortized cost or cost |
Gross unrealized gains |
Gross unrealized losses |
Estimated fair value | |||||||||
| (Amounts in millions) |
|||||||||||||
| Fixed maturities: |
|||||||||||||
| U.S. corporate |
$ | 345 | $ | 2 | $ | (10 | ) | $ | 337 | ||||
| Public utilities |
18 | 1 | (2 | ) | 17 | ||||||||
| Mortgage and asset-backed |
27 | 8 | — | 35 | |||||||||
| Total restricted fixed maturities |
$ | 390 | $ | 11 | $ | (12 | ) | $ | 389 | ||||
Securities with gross unrealized losses at December 31, 2005 were not considered to be temporarily impaired as management expects such securities to perform as to their original contractual terms.
The scheduled maturity distribution of these restricted fixed maturities as of December 31, 2005 is set forth below. Actual maturities may have differed from contractual maturities because issuers of securities may have had the right to call or prepay obligations with or without call or prepayment penalties.
| (Amounts in millions) |
Amortized cost |
Estimated fair value | ||||
| Due 2006 |
$ | 99 | $ | 99 | ||
| Due 2007-2010 |
160 | 159 | ||||
| Due 2011-2015 |
73 | 69 | ||||
| Due 2016 and later |
31 | 27 | ||||
| Subtotal |
363 | 354 | ||||
| Mortgage and asset-backed |
27 | 35 | ||||
| Total restricted fixed maturities |
$ | 390 | $ | 389 | ||
The following table sets forth the distribution across property type and geographic region for restricted commercial mortgage loans as of December 31, 2005:
| 2005 | ||||||
| (Amounts in millions) |
Carrying value |
% of total |
||||
| Property Type |
||||||
| Retail |
$ | 132 | 45 | % | ||
| Office |
87 | 29 | ||||
| Industrial |
43 | 15 | ||||
| Apartments |
16 | 5 | ||||
| Mixed use/other |
18 | 6 | ||||
| Total |
$ | 296 | 100 | % | ||
193
Genworth Financial, Inc.
Notes to Consolidated Financial Statements—(Continued)
Years Ended December 31, 2006, 2005 and 2004
| 2005 | ||||||
| (Amounts in millions) |
Carrying value |
% of total |
||||
| Region |
||||||
| South Atlantic |
$ | 78 | 26 | % | ||
| Pacific |
70 | 24 | ||||
| East North Central |
41 | 14 | ||||
| Mountain |
25 | 9 | ||||
| Middle Atlantic |
26 | 9 | ||||
| East South Central |
19 | 6 | ||||
| West North Central |
16 | 5 | ||||
| West South Central |
9 | 3 | ||||
| New England |
12 | 4 | ||||
| Total |
$ | 296 | 100 | % | ||
There was no allowance for losses related to these restricted commercial mortgage loans.
(20) Insurance Subsidiary Financial Information and Regulatory Matters
Our insurance company subsidiaries are restricted by state and foreign laws and regulations as to the amount of dividends they may pay to their parent without regulatory approval in any year, the purpose of which is to protect affected insurance policyholders, depositors or investors. Any dividends in excess of limits are deemed “extraordinary” and require approval. Based on statutory results as of December 31, 2006, we estimate our domestic and international insurance companies could pay dividends of approximately $1,400 million to us in 2007 without obtaining regulatory approval.
Our holding companies received dividends from our domestic insurance subsidiaries of $587 million ($231 million of which are deemed “extraordinary”), $639 million ($76 million of which are deemed “extraordinary”) and $2,111 million ($1,244 million of which are deemed “extraordinary”), during 2006, 2005 and 2004, respectively.
In addition to the guarantees discussed in notes 19 and 23, we have provided guarantees to third parties for the performance of certain obligations of our subsidiaries. We estimate that our potential obligations under such guarantees, other than guarantees provided in connection with derivative contracts, were $607 million and $164 million as of December 31, 2006 and 2005, respectively. Our potential obligations under guarantees of derivative contracts were $9 million and $10 million as of December 31, 2006 and 2005, respectively, which reflects the fair value of such derivative contracts. We also provide an unlimited guarantee to third parties for the solvency of our mortgage insurance subsidiary located in the United Kingdom.
Our U.S. domiciled insurance subsidiaries file financial statements with state insurance regulatory authorities and the NAIC that are prepared on an accounting basis prescribed or permitted by such authorities (statutory basis). Statutory accounting practices differ from U.S. GAAP in several respects, causing differences in reported net income and stockholders’ equity. Permitted statutory accounting practices encompass all accounting practices not so prescribed but that have been specifically allowed by state insurance authorities. Our insurance subsidiaries have no material permitted accounting practices.
194
Genworth Financial, Inc.
Notes to Consolidated Financial Statements—(Continued)
Years Ended December 31, 2006, 2005 and 2004
The tables below include the combined statutory net income and statutory capital and surplus for our U.S. domiciled insurance subsidiaries.
| Years ended December 31, | ||||||||||||
| (Amounts in millions) |
2006 | 2005 | 2004 | |||||||||
| Combined statutory net income: |
||||||||||||
| Life insurance subsidiaries, excluding captive reinsurance subsidiaries |
$ | 653 | $ | 321 | $ | 782 | ||||||
| Mortgage insurance subsidiaries |
243 | 221 | 222 | |||||||||
| Combined statutory net income, excluding captive reinsurance subsidiaries |
896 | 542 | 1,004 | |||||||||
| Captive life reinsurance subsidiaries combined statutory net losses |
(895 | ) | (333 | ) | (365 | ) | ||||||
| Combined statutory net income |
$ | 1 | $ | 209 | $ | 639 | ||||||
| As of December 31, | ||||||||||||
| 2006 | 2005 | |||||||||||
| Combined statutory capital and surplus: |
||||||||||||
| Life insurance subsidiaries |
$ | 3,368 | $ | 3,462 | ||||||||
| Mortgage insurance subsidiaries |
2,691 | 2,689 | ||||||||||
| Combined statutory capital and surplus |
$ | 6,059 | $ | 6,151 | ||||||||
Statutory net income (losses) from our captive life reinsurance subsidiaries relate to their assumption reinsurance of statutorily required term and universal life insurance reserves from our U.S. domiciled life insurance companies. These reserves are, in turn, funded through the issuance of surplus notes (non-recourse funding obligations) to third parties. Accordingly, the life insurance subsidiaries combined statutory net income and distributable earnings are not affected by the statutory net income (losses) of the captives, except to the extent dividends are received from the captives. The combined statutory capital and surplus of our life insurance subsidiaries does not include the capital and surplus of our captive life reinsurance subsidiaries of $1,175 million and $521 million as of December 31, 2006 and 2005, respectively. Capital and surplus of our captive life reinsurance subsidiaries includes surplus notes (non-recourse funding obligations) as further described in note 13.
The NAIC has adopted Risk-Based Capital (“RBC”) requirements to evaluate the adequacy of statutory capital and surplus in relation to risks associated with: (i) asset risk, (ii) insurance risk, (iii) interest rate risk, and (iv) business risk. The RBC formula is designated as an early warning tool for the states to identify possible undercapitalized companies for the purpose of initiating regulatory action. In the course of operations, we periodically monitor the RBC level of each of our insurance subsidiaries. As of December 31, 2006 and 2005, each of our insurance subsidiaries exceeded the minimum required RBC levels.
For regulatory purposes, our mortgage insurance subsidiaries are required to maintain a statutory contingency reserve. Annual additions to the statutory contingency reserve must equal the greater of (i) 50% of earned premiums or (ii) the required level of policyholders position, as defined by state insurance laws. These contingency reserves generally are held until the earlier of (i) the time that loss ratios exceed 35% or (ii) ten years. The statutory contingency reserves as of December 31, 2006 for our U.S. mortgage insurance subsidiaries was approximately $2.4 billion.
195
Genworth Financial, Inc.
Notes to Consolidated Financial Statements—(Continued)
Years Ended December 31, 2006, 2005 and 2004
(21) Operating and Geographic Segments
(a) Operating Segment Information
We currently conduct our operations in three operating business segments: (1) Protection, which includes our life insurance, long-term care insurance, linked benefit products, Medicare supplement insurance, group life and health insurance and payment protection insurance business; (2) Retirement Income and Investments, which includes our fixed annuities, individual variable annuities, group variable annuities designed for retirement plans, single premium immediate annuities, variable life insurance, specialized products, including GICs, funding agreements, and FABNs, and asset management products and services; (3) Mortgage Insurance, which includes our mortgage insurance products and mortgage-related services that facilitate homeownership by enabling borrowers to buy homes with low-down-payment mortgages business. Prior to our corporate formation we also conducted operations in a fourth business segment, Affinity, which included life and health insurance and other financial products and services offered directly to consumers through affinity marketing arrangements with a variety of organizations, an institutional asset management business and several other small businesses that are not part of our core ongoing business. The lines of business and assets and liabilities of our Affinity segment were not transferred to us in our corporate formation, therefore the results or operations of the Affinity segment are only included in our results until May 24, 2004. We also have Corporate and Other activities, which include interest and other debt financing expenses and other corporate income and expenses not allocated to the segments, as well as the results of a small, non-core business that is managed outside of our operating segments.
In 2006, we began to allocate net investment gains (losses) from Corporate and Other to our Protection (except payment protection insurance) and Retirement Income and Investments segments using an approach based principally upon the investment portfolio established to support each of those segments’ products and targeted capital levels. We do not allocate net investment gains (losses) from Corporate and Other to our Mortgage Insurance segment or to our payment protection insurance business within the Protection segment, because they have their own separate investment portfolios, and net investment gains (losses) from those portfolios are reflected in the Mortgage Insurance and Protection segment results, respectively.
Prior to 2006, all net investment gains (losses) were recorded in Corporate and Other and were not reflected in the results of any of our other segments.
Effective January 1, 2006, our Mexican insurance operations, previously included in Corporate and Other, is being managed within our Protection segment and those results are now included as part of the payment protection insurance business. Segment information related to this move is reflected in all periods presented.
On January 9, 2007, we announced an organizational repositioning to more directly align high-growth international, mortgage insurance and retirement and protection business opportunities. Under the reorganization and beginning in the first quarter 2007, we will have three operating segments: Retirement and Protection; International; and U.S. Mortgage Insurance; as well as Corporate and Other. The Retirement and Protection segment will include the following operations: retirement income, managed money, life insurance, long-term care insurance, and spread-based institutional products. The International segment will include international mortgage insurance, payment protection insurance and international new business developments. The results of these reorganized segments for all periods reported will be represented in the first quarter of 2007. The U.S. Mortgage Insurance segment will consist of the U.S. mortgage insurance business. We will continue to have Corporate and Other activities, which consist primarily of unallocated corporate income and expenses, the results of a small, non-core business that is managed outside the operating segments, and most of the interest and other financing expenses.
196
Genworth Financial, Inc.
Notes to Consolidated Financial Statements—(Continued)
Years Ended December 31, 2006, 2005 and 2004
We use the same accounting policies and procedures to measure segment income and assets as our consolidated net income and assets. Segment income is generally measured as income before income taxes and cumulative effect of accounting change. Investment gains (losses), net of taxes, are allocated to Corporate and Other. Segment income represents the basis on which the performance of our business is assessed by management. Policy premiums and fees, other income, policy benefits and acquisition and operating expenses and policy related amortizations are attributed directly to each operating segment. With the exception of our Mortgage Insurance segment and the payment protection business within our Protection segment that have separate investment portfolios, net investment income and invested assets are allocated based on the assets required to support the underlying liabilities and capital of the products included in each segment.
The following is a summary of segment activity as of or for the years ended December 31, 2006, 2005 and 2004:
| 2006 |
Protection | Retirement Income and Investments |
Mortgage Insurance |
Affinity | Corporate Other |
Total | |||||||||||||||
| (Amounts in millions) |
|||||||||||||||||||||
| Premiums |
$ | 4,594 | $ | 736 | $ | 1,132 | $ | — | $ | 25 | $ | 6,487 | |||||||||
| Net investment income |
1,482 | 1,915 | 341 | — | 99 | 3,837 | |||||||||||||||
| Net investment gains (losses) |
5 | (69 | ) | 7 | — | (12 | ) | (69 | ) | ||||||||||||
| Policy fees and other income |
379 | 350 | 31 | — | 14 | 774 | |||||||||||||||
| Total revenues |
6,460 | 2,932 | 1,511 | — | 126 | 11,029 | |||||||||||||||
| Benefits and other changes in policy reserves |
3,175 | 1,015 | 293 | — | 2 | 4,485 | |||||||||||||||
| Interest credited |
384 | 1,138 | — | — | — | 1,522 | |||||||||||||||
| Acquisition and operating expenses, net of deferrals |
1,339 | 314 | 296 | — | 64 | 2,013 | |||||||||||||||
| Amortization of deferred acquisition costs and intangibles |
488 | 174 | 61 | — | 4 | 727 | |||||||||||||||
| Interest expense |
141 | 5 | — | — | 218 | 364 | |||||||||||||||
| Total benefits and expenses |
5,527 | 2,646 | 650 | — | 288 | 9,111 | |||||||||||||||
| Income (loss) from continuing operations before income taxes |
933 | 286 | 861 | — | (162 | ) | 1,918 | ||||||||||||||
| Provision (benefit) for income taxes |
315 | 83 | 243 | — | (47 | ) | 594 | ||||||||||||||
| Net income (loss) from continuing operations |
$ | 618 | $ | 203 | $ | 618 | $ | — | $ | (115 | ) | $ | 1,324 | ||||||||
| Total assets |
$ | 38,653 | $ | 59,391 | $ | 8,456 | $ | — | $ | 4,371 | $ | 110,871 | |||||||||
197
Genworth Financial, Inc.
Notes to Consolidated Financial Statements—(Continued)
Years Ended December 31, 2006, 2005 and 2004
| 2005 |
Protection | Retirement Income and Investments |
Mortgage Insurance |
Affinity | Corporate Other |
Total | |||||||||||||||
| (Amounts in millions) |
|||||||||||||||||||||
| Premiums |
$ | 4,521 | $ | 855 | $ | 882 | $ | — | $ | 39 | $ | 6,297 | |||||||||
| Net investment income |
1,287 | 1,813 | 287 | — | 149 | 3,536 | |||||||||||||||
| Net realized investment gains (losses) |
— | — | — | — | (2 | ) | (2 | ) | |||||||||||||
| Policy fees and other income |
371 | 244 | 45 | — | 13 | 673 | |||||||||||||||
| Total revenues |
6,179 | 2,912 | 1,214 | — | 199 | 10,504 | |||||||||||||||
| Benefits and other changes in policy reserves |
2,926 | 1,111 | 162 | — | 6 | 4,205 | |||||||||||||||
| Interest credited |
369 | 1,056 | — | — | — | 1,425 | |||||||||||||||
| Acquisition and operating expenses, net of deferrals |
1,350 | 259 | 289 | — | 91 | 1,989 | |||||||||||||||
| Amortization of deferred acquisition costs and intangibles |
597 | 131 | 56 | — | 10 | 794 | |||||||||||||||
| Interest expense |
52 | 3 | — | — | 238 | 293 | |||||||||||||||
| Total benefits and expenses |
5,294 | 2,560 | 507 | — | 345 | 8,706 | |||||||||||||||
| Income (loss) from continuing operations before income taxes |
885 | 352 | 707 | — | (146 | ) | 1,798 | ||||||||||||||
| Provision (benefit) for income taxes |
317 | 105 | 200 | — | (45 | ) | 577 | ||||||||||||||
| Net income (loss) from continuing operations |
$ | 568 | $ | 247 | $ | 507 | $ | — | $ | (101 | ) | $ | 1,221 | ||||||||
| Total assets |
$ | 33,945 | $ | 58,281 | $ | 7,118 | $ | — | $ | 6,310 | $ | 105,654 | |||||||||
| 2004 |
Protection | Retirement Income and Investments |
Mortgage Insurance |
Affinity | Corporate and Other |
Total | |||||||||||||||
| (Amounts in millions) |
|||||||||||||||||||||
| Premiums |
$ | 4,527 | $ | 1,094 | $ | 800 | $ | 88 | $ | 50 | $ | 6,559 | |||||||||
| Net investment income |
1,226 | 1,996 | 254 | 26 | 146 | 3,648 | |||||||||||||||
| Net realized investment gains (losses) |
— | — | — | — | 26 | 26 | |||||||||||||||
| Policy fees and other income |
364 | 271 | 36 | 104 | 49 | 824 | |||||||||||||||
| Total revenues |
6,117 | 3,361 | 1,090 | 218 | 271 | 11,057 | |||||||||||||||
| Benefits and other changes in policy reserves |
2,920 | 1,633 | 165 | 80 | 6 | 4,804 | |||||||||||||||
| Interest credited |
362 | 1,070 | — | — | — | 1,432 | |||||||||||||||
| Acquisition and operating expenses, net of deferrals |
1,197 | 250 | 262 | 123 | 70 | 1,902 | |||||||||||||||
| Amortization of deferred acquisition costs and intangibles |
786 | 170 | 51 | 47 | 10 | 1,064 | |||||||||||||||
| Interest expense |
15 | 1 | — | — | 201 | 217 | |||||||||||||||
| Total benefits and expenses |
5,280 | 3,124 | 478 | 250 | 287 | 9,419 | |||||||||||||||
| Income (loss) from continuing operations before income taxes |
837 | 237 | 612 | (32 | ) | (16 | ) | 1,638 | |||||||||||||
| Provision (benefit) for income taxes |
307 | 84 | 186 | (18 | ) | (66 | ) | 493 | |||||||||||||
| Net income (loss) from continuing operations |
$ | 530 | $ | 153 | $ | 426 | $ | (14 | ) | $ | 50 | $ | 1,145 | ||||||||
198
Genworth Financial, Inc.
Notes to Consolidated Financial Statements—(Continued)
Years Ended December 31, 2006, 2005 and 2004
(b) Revenues of Major Product Groups
| (Amounts in millions) |
2006 | 2005 | 2004 | ||||||
| Life insurance |
$ | 1,807 | $ | 1,623 | $ | 1,518 | |||
| Long-term care insurance |
2,626 | 2,347 | 2,311 | ||||||
| Payment protection insurance |
1,284 | 1,492 | 1,602 | ||||||
| Group life and health insurance |
743 | 717 | 686 | ||||||
| Total Protection segment revenues |
6,460 | 6,179 | 6,117 | ||||||
| Spread-based retail products |
2,012 | 2,224 | 2,712 | ||||||
| Fee-based products |
348 | 246 | 317 | ||||||
| Spread-based institutional products |
572 | 442 | 332 | ||||||
| Total Retirement Income and Investments segment revenues |
2,932 | 2,912 | 3,361 | ||||||
| U.S. mortgage insurance |
651 | 603 | 609 | ||||||
| International mortgage insurance |
860 | 611 | 481 | ||||||
| Total Mortgage Insurance segment revenues |
1,511 | 1,214 | 1,090 | ||||||
| Affinity segment revenues |
— | — | 218 | ||||||
| Corporate and Other revenues |
126 | 199 | 271 | ||||||
| Total revenues |
$ | 11,029 | $ | 10,504 | $ | 11,057 | |||
(c) Net Operating Income (Loss)
| (Amounts in millions) |
2006 | 2005 | 2004 | |||||||||
| Life insurance |
$ | 313 | $ | 275 | $ | 245 | ||||||
| Long-term care insurance |
153 | 172 | 172 | |||||||||
| Payment protection insurance |
113 | 90 | 83 | |||||||||
| Group life and health insurance |
35 | 31 | 30 | |||||||||
| Total Protection segment net operating income |
614 | 568 | 530 | |||||||||
| Spread-based retail products |
119 | 151 | 79 | |||||||||
| Fee-based products |
76 | 59 | 44 | |||||||||
| Spread-based institutional products |
42 | 37 | 30 | |||||||||
| Total Retirement Income and Investments segment net operating income |
237 | 247 | 153 | |||||||||
| U.S. mortgage insurance |
259 | 238 | 224 | |||||||||
| International mortgage insurance |
355 | 269 | 202 | |||||||||
| Total Mortgage Insurance segment net operating income |
614 | 507 | 426 | |||||||||
| Affinity segment net operating income (loss) |
— | — | (14 | ) | ||||||||
| Corporate and Other net operating income (loss) |
(107 | ) | (100 | ) | (37 | ) | ||||||
| Net operating income |
1,358 | 1,222 | 1,058 | |||||||||
| Net investment gains (losses), net of taxes and other adjustments |
(34 | ) | (1 | ) | 16 | |||||||
| Net tax benefit related to IPO |
— | — | 46 | |||||||||
| Gain on outsourcing services agreement, net of taxes |
— | — | 25 | |||||||||
| Gain (loss) on sale of discontinued operations, net of taxes |
— | — | 7 | |||||||||
| Net income before accounting change, net of taxes |
1,324 | 1,221 | 1,152 | |||||||||
| Cumulative effect of accounting changes, net of taxes |
4 | — | 5 | |||||||||
| Net income from continuing operations |
$ | 1,328 | $ | 1,221 | $ | 1,157 | ||||||
199
Genworth Financial, Inc.
Notes to Consolidated Financial Statements—(Continued)
Years Ended December 31, 2006, 2005 and 2004
(d) Geographic Segment Information
We conduct our operations in two geographic regions: (1) United States and (2) International.
The following is a summary of geographic region activity as of or for the years ended December 31, 2006, 2005 and 2004.
| 2006 |
United States |
International | Total | ||||||
| (Amounts in millions) |
|||||||||
| Total revenues |
$ | 8,849 | $ | 2,180 | $ | 11,029 | |||
| Net income from continuing operations before accounting change |
$ | 835 | $ | 489 | $ | 1,324 | |||
| Total assets |
$ | 102,165 | $ | 8,706 | $ | 110,871 | |||
| 2005 |
United States |
International | Total | ||||||
| (Amounts in millions) |
|||||||||
| Total revenues |
$ | 8,354 | $ | 2,150 | $ | 10,504 | |||
| Net income from continuing operations before accounting change |
$ | 835 | $ | 386 | $ | 1,221 | |||
| Total assets |
$ | 98,481 | $ | 7,173 | $ | 105,654 | |||
| 2004 |
United States |
International | Total | ||||||
| (Amounts in millions) |
|||||||||
| Total revenues |
$ | 8,902 | $ | 2,155 | $ | 11,057 | |||
| Net income from continuing operations before accounting change |
$ | 818 | $ | 327 | $ | 1,145 | |||
200
Genworth Financial, Inc.
Notes to Consolidated Financial Statements—(Continued)
Years Ended December 31, 2006, 2005 and 2004
(22) Quarterly Results of Operations (unaudited)
Our unaudited quarterly results of operations for the year ended December 31, 2006 are summarized in the table below.
| Three months ended | ||||||||||||
| (Amounts in millions, except per share amounts) |
March 31, 2006 |
June 30, 2006 |
September 30, 2006 |
December 31, 2006 | ||||||||
| Total revenues |
$ | 2,625 | $ | 2,754 | $ | 2,804 | $ | 2,846 | ||||
| Total benefits and expenses |
$ | 2,139 | $ | 2,290 | $ | 2,356 | $ | 2,326 | ||||
| Net income before accounting change |
$ | 330 | $ | 317 | $ | 304 | $ | 373 | ||||
| Cumulative effect of accounting change, net of taxes |
4 | — | — | — | ||||||||
| Net income |
$ | 334 | $ | 317 | $ | 304 | $ | 373 | ||||
| Earnings per share: |
||||||||||||
| Basic earnings per common share: |
||||||||||||
| Net income before accounting change |
$ | 0.71 | $ | 0.70 | $ | 0.67 | $ | 0.83 | ||||
| Cumulative effect of accounting change, net of taxes |
0.01 | — | — | — | ||||||||
| Basic earnings per common share |
$ | 0.72 | $ | 0.70 | $ | 0.67 | $ | 0.83 | ||||
| Diluted earnings per common share: |
||||||||||||
| Net income before accounting change |
$ | 0.69 | $ | 0.68 | $ | 0.65 | $ | 0.81 | ||||
| Cumulative effect of accounting change, net of taxes |
0.01 | — | — | — | ||||||||
| Diluted earnings per share |
$ | 0.70 | $ | 0.68 | $ | 0.65 | $ | 0.81 | ||||
| Shares outstanding: |
||||||||||||
| Basic |
467.0 | 455.8 | 453.8 | 447.4 | ||||||||
| Diluted |
479.5 | 468.3 | 467.2 | 460.7 | ||||||||
Our unaudited quarterly results of operations for the year ended December 31, 2005 are summarized in the table below.
| Three months ended | ||||||||||||
| (Amounts in millions, except per share amounts) |
March 31, 2005 |
June 30, 2005 |
September 30, 2005 |
December 31, 2005 | ||||||||
| Total revenues |
$ | 2,611 | $ | 2,610 | $ | 2,628 | $ | 2,655 | ||||
| Total benefits and expenses |
$ | 2,127 | $ | 2,198 | $ | 2,185 | $ | 2,196 | ||||
| Net income before accounting change |
$ | 322 | $ | 285 | $ | 307 | $ | 307 | ||||
| Net income |
$ | 322 | $ | 285 | $ | 307 | $ | 307 | ||||
| Earnings per share: |
||||||||||||
| Basic earnings per common share: |
||||||||||||
| Net income before accounting change |
$ | 0.66 | $ | 0.61 | $ | 0.65 | $ | 0.65 | ||||
| Basic earnings per common share |
$ | 0.66 | $ | 0.61 | $ | 0.65 | $ | 0.65 | ||||
| Diluted earnings per common share: |
||||||||||||
| Net income before accounting change |
$ | 0.65 | $ | 0.60 | $ | 0.64 | $ | 0.64 | ||||
| Diluted earnings per share |
$ | 0.65 | $ | 0.60 | $ | 0.64 | $ | 0.64 | ||||
| Shares outstanding: |
||||||||||||
| Basic |
488.8 | 470.4 | 470.7 | 470.9 | ||||||||
| Diluted |
494.3 | 477.4 | 481.1 | 482.6 | ||||||||
201
Genworth Financial, Inc.
Notes to Consolidated Financial Statements—(Continued)
Years Ended December 31, 2006, 2005 and 2004
(23) Commitments and Contingencies
(a) Litigation
We face a significant risk of litigation and regulatory investigations and actions in the ordinary course of operating our businesses, including class action lawsuits. Our pending legal and regulatory actions include proceedings specific to us and others generally applicable to business practices in the industries in which we operate. Plaintiffs in class action and other lawsuits against us may seek very large or indeterminate amounts, including punitive and treble damages, which may remain unknown for substantial periods of time. A substantial legal liability or a significant regulatory action against us could have an adverse effect on our financial condition and results of operations. Moreover, even if we ultimately prevail in the litigation, regulatory action or investigation, we could suffer significant reputational harm, which could have an adverse effect on our business, financial condition or results of operations.
(b) Commitments
As of December 31, 2006, we were committed to fund $298 million in U.S. commercial mortgage loans and $208 million to fund interests in limited partnerships.
In connection with the issuance of non-recourse funding obligations by Rivermont I, Genworth entered into a liquidity commitment agreement with the third-party trusts in which the floating rate notes have been deposited. The liquidity agreement requires that Genworth issue to the trusts either a loan or a letter of credit (“LOC”), at maturity of the notes (2050), in the amount equal to the then market value of the assets held in the trust. Any loan or LOC issued is an obligation of the trust and shall accrue interest at LIBOR plus a margin. In consideration for entering into this agreement, Genworth received, from Rivermont I, a one-time commitment fee of approximately $2 million. The maximum potential amount of future obligation under this agreement is approximately $95 million.
202
| Item 9. | Changes In and Disagreements With Accountants on Accounting and Financial Disclosure |
None.
| Item 9A. | Controls and Procedures |
Evaluation of Disclosure Controls and Procedures
As of December 31, 2006, an evaluation was conducted under the supervision and with the participation of our management, including our Chief Executive Officer and Acting Chief Financial Officer, of the effectiveness of the design and operation of our disclosure controls and procedures (as defined in Rules 13a-15(e) and 15d-15(e) under the Securities Exchange Act of 1934). Based on this evaluation, the Chief Executive Officer and the Acting Chief Financial Officer concluded that the design and operation of these disclosure controls and procedures were effective.
Management’s Annual Report On Internal Control Over Financial Reporting
Our management is responsible for establishing and maintaining adequate internal control over financial reporting for our company. With the participation of the Chief Executive Officer and the Acting Chief Financial Officer, our management conducted an evaluation of the effectiveness of our internal control over financial reporting based on the framework and criteria established in Internal Control—Integrated Framework, issued by the Committee of Sponsoring Organizations of the Treadway Commission. Based on this evaluation, our management has concluded that our internal control over financial reporting was effective as of December 31, 2006.
Our independent auditor, KPMG LLP, a registered public accounting firm, has issued an attestation report on our management’s assessment of our internal control over financial reporting. This attestation report appears below.
| /s/ MICHAEL D. FRAIZER |
| Michael D. Fraizer Chairman of the Board, President and Chief Executive Officer (Principal Executive Officer) |
| /s/ VICTOR C. MOSES |
| Victor C. Moses Senior Vice President—Actuarial & Risk; Acting Chief Financial Officer (Principal Financial Officer) |
February 28, 2007
203
Report of Independent Registered Public Accounting Firm
The Board of Directors and Stockholders
Genworth Financial, Inc.:
We have audited management’s assessment, included in the accompanying Management’s Annual Report on Internal Control over Financial Reporting that Genworth Financial, Inc. (the Company) maintained effective internal control over financial reporting as of December 31, 2006, based on criteria established in Internal Control—Integrated Framework issued by the Committee of Sponsoring Organizations of the Treadway Commission (COSO). The Company’s management is responsible for maintaining effective internal control over financial reporting and for its assessment of the effectiveness of internal control over financial reporting. Our responsibility is to express an opinion on management’s assessment and an opinion on the effectiveness of the Company’s internal control over financial reporting based on our audit.
We conducted our audit in accordance with the standards of the Public Company Accounting Oversight Board (United States). Those standards require that we plan and perform the audit to obtain reasonable assurance about whether effective internal control over financial reporting was maintained in all material respects. Our audit included obtaining an understanding of internal control over financial reporting, evaluating management’s assessment, testing and evaluating the design and operating effectiveness of internal control, and performing such other procedures as we considered necessary in the circumstances. We believe that our audit provides a reasonable basis for our opinion.
A company’s internal control over financial reporting is a process designed to provide reasonable assurance regarding the reliability of financial reporting and the preparation of financial statements for external purposes in accordance with generally accepted accounting principles. A company’s internal control over financial reporting includes those policies and procedures that (1) pertain to the maintenance of records that, in reasonable detail, accurately and fairly reflect the transactions and dispositions of the assets of the company; (2) provide reasonable assurance that transactions are recorded as necessary to permit preparation of financial statements in accordance with generally accepted accounting principles, and that receipts and expenditures of the company are being made only in accordance with authorizations of management and directors of the company; and (3) provide reasonable assurance regarding prevention or timely detection of unauthorized acquisition, use, or disposition of the company’s assets that could have a material effect on the financial statements.
Because of its inherent limitations, internal control over financial reporting may not prevent or detect misstatements. Also, projections of any evaluation of effectiveness to future periods are subject to the risk that controls may become inadequate because of changes in conditions, or that the degree of compliance with the policies or procedures may deteriorate.
In our opinion, management’s assessment that Genworth Financial, Inc. maintained effective internal control over financial reporting as of December 31, 2006, is fairly stated, in all material respects, based on criteria established in Internal Control—Integrated Framework issued by COSO. Also, in our opinion, Genworth Financial, Inc. maintained, in all material respects, effective internal control over financial reporting as of December 31, 2006, based on criteria established in Internal Control—Integrated Framework issued by COSO.
We also have audited, in accordance with the standards of the Public Company Accounting Oversight Board (United States), the consolidated balance sheets of Genworth Financial, Inc. as of December 31, 2006 and 2005, and the related consolidated statements of income, changes in stockholders’ equity, and cash flows for each of the years in the three-year period ended December 31, 2006, and our report dated February 28, 2007 expressed an unqualified opinion on those financial statements.
/s/ KPMG LLP
Richmond, Virginia
February 28, 2007
204
Changes in Internal Control Over Financial Reporting During the Quarter Ended December 31, 2006
There were no changes in our internal control over financial reporting that occurred during the quarter ended December 31, 2006 that have materially affected, or are reasonably likely to materially affect, our internal control over financial reporting.
| Item 9B. | Other Information |
None.
205
| Item 10. | Directors, Executive Officers and Corporate Governance |
The following table sets forth certain information concerning our directors and executive officers:
| Name |
Age | Positions | ||
| Michael D. Fraizer |
48 | Chairman of the Board, President and Chief Executive Officer | ||
| Thomas H. Mann |
56 | Executive Vice President—Genworth | ||
| Pamela S. Schutz |
52 | Executive Vice President—Genworth | ||
| Mark W. Griffin |
48 | Senior Vice President—Chief Investment Officer | ||
| Patrick B. Kelleher |
49 | Senior Vice President | ||
| Michael S. Laming |
55 | Senior Vice President—Human Resources | ||
| Samuel D. Marsico |
49 | Senior Vice President—Chief Risk Officer | ||
| Scott J. McKay |
45 | Senior Vice President—Operations & Quality and Chief Information Officer | ||
| Victor C. Moses |
59 | Senior Vice President—Actuarial & Risk; Acting Chief Financial Officer | ||
| Joseph J. Pehota |
45 | Senior Vice President—Mergers & Acquisitions | ||
| Jean S. Peters |
55 | Senior Vice President—Corporate Communications & External Relations | ||
| Leon E. Roday |
53 | Senior Vice President, General Counsel and Secretary | ||
| Cheryl C. Whaley |
41 | Senior Vice President—Capital Markets & Growth Ventures | ||
| Frank J. Borelli |
71 | Director, member of Audit and Management Development and Compensation Committees | ||
| Nancy J. Karch |
59 | Director, member of Management Development and Compensation and Nominating and Corporate Governance Committees | ||
| J. Robert Kerrey |
63 | Director, member of Nominating and Corporate Governance and Legal and Public Affairs Committees | ||
| Saiyid T. Naqvi |
57 | Director, member of Audit and Legal and Public Affairs Committees | ||
| James A. Parke |
61 | Director, member of Legal and Public Affairs Committee | ||
| James S. Riepe |
63 | Director, member of Management Development and Compensation and Audit Committees | ||
| Barrett A. Toan |
59 | Director, member of Nominating and Corporate Governance and Legal and Public Affairs Committees | ||
| Thomas B. Wheeler |
70 | Director, member of Management Development and Compensation and Nominating and Corporate Governance Committees | ||
Executive Officers and Directors
The following sets forth certain biographical information with respect to our executive officers and directors listed above.
Michael D. Fraizer has been our Chairman of the Board, President and Chief Executive Officer since the completion of the IPO in May 2004. Prior to the IPO, he had served as a Vice President of GE since December
206
1995 and a Senior Vice President of GE since June 2000. Mr. Fraizer was Chairman of the Board of GEFAHI from November 1996 to May 2004 and President and Chief Executive Officer of GEFAHI from April 1997 to June 2004. Mr. Fraizer also has been a director of GE Capital and General Electric Capital Services, Inc. Mr. Fraizer led the Consumer Savings and Insurance Group, a predecessor of GEFAHI, from February 1996 until the formation of GEFAHI in October 1996. Prior to that time, Mr. Fraizer was President and Chief Executive Officer of GE Capital Commercial Real Estate, an affiliate of our company, from July 1993 to December 1996, leading both the GE Consumer Savings and Insurance Group and GE Capital Commercial Real Estate from February to December 1996. From July 1991 to June 1993, he was Vice President—Portfolio Acquisitions and Ventures of GE Capital Commercial Real Estate. From December 1989 to June 1991, Mr. Fraizer was President and Managing Director, GE Japan. From July 1983 to November 1989 Mr. Fraizer served in various capacities as a member of GE’s Corporate Audit Staff and Corporate Business Development after joining GE in its Financial Management Program. Mr. Fraizer received a B.A. in Political Science from Carleton College. Mr. Fraizer serves as a trustee of the Virginia Foundation for Independent Colleges and the Virginia Commonwealth University School of Business Foundation; and serves on the board of the American Council of Life Insurers, the Financial Services Roundtable and the Andre Agassi Charitable Foundation.
Thomas H. Mann has been our Executive Vice President—Genworth responsible for the company’s International and U.S. Mortgage Insurance segments since January 2007. Prior thereto, Mr. Mann had served as the President and Chief Executive Officer—Mortgage Insurance since the completion of the IPO in May 2004 and has been President, Chief Executive Officer and a Director of Genworth Mortgage Insurance Corporation, a subsidiary of our company, since May 1996. Prior to the IPO, he was a Vice President of GE since April 1996. From March 1990 to April 1996, Mr. Mann served as Vice President of GE Capital and General Manager of GE Capital Vendor Financial Services. Prior to that time, he served as Executive Vice President—Operations with GE Mortgage from August 1986 to March 1990. From November 1984 to August 1986, Mr. Mann served as Manager—Finance Operations at GE Capital’s Real Estate Financial Services Division, and from August 1976 to November 1984, he served in various capacities as a member of GE’s Corporate Audit Staff. Mr. Mann received a B.S. in Business Administration from the University of North Carolina at Chapel Hill. He is a member of the Housing Policy Council Executive Committee, part of the Financial Services Roundtable.
Pamela S. Schutz has been our Executive Vice President—Genworth responsible for the company’s Retirement and Protection segment since January 2007. Prior thereto, Ms. Schutz had served as the President and Chief Executive Officer—Retirement Income and Investments since the completion of the IPO in May 2004 and has been President and Chief Executive Officer of Genworth Life and Annuity Insurance Company, a subsidiary of our company, since June 1998. Prior to the IPO, she was a Vice President of GE since October 2000. From May 1997 to July 1998, Ms. Schutz served as President of The Harvest Life Insurance Company, then an affiliate of our company. Prior to that time, Ms. Schutz served in various capacities with GE Capital Commercial Real Estate from February 1978 to May 1997, attaining the position of President, GE Capital Realty Group in May 1994. Ms. Schutz received a B.A. in Urban Planning from Briarcliff College and an M.S. in Business from American University. She is a member of the boards of the National Association of Variable Annuities and MIB Group, Inc.
Patrick B. Kelleher has been our Senior Vice President since the end of January 2007. Mr. Kelleher will become the Senior Vice President—Chief Financial Officer of the company effective March 2, 2007. Prior to joining the company, Mr. Kelleher had been the Executive Vice President and Chief Financial Officer of Transamerica Reinsurance in Charlotte, North Carolina, a reinsurance provider and division of Transamerica Occidental Life Insurance Company, which is a member of AEGON Group, a life insurance pension company. He had served in this capacity since 1998. Prior thereto, Mr. Kelleher had been with Manulife Financial where he led its life and financial reinsurance business from 1996 to 1998 and where he served as the chief financial officer of the reinsurance division from 1994 to 1996 and as an insurance products leader from 1992 to 1994. From 1980 to 1992, Mr. Kelleher was with the Sun Life Assurance Company of Canada where he held various positions. Mr. Kelleher is a member of the Certified General Accountants Association of Canada, a Fellow of the Society of Actuaries, a Fellow of the Canadian of Actuaries. He received a Bachelor’s degree from Franklin & Marshall College.
207
Mark W. Griffin has been our Senior Vice President—Chief Investment Officer since October 2005. Prior thereto, he was Senior Vice President—Chief Risk Officer from completion of the IPO in May 2004 as well as Acting Chief Investment Officer from June 17, 2005. From August 2002 to the IPO, he was the Chief Risk Manager of GE Insurance, a business unit of GE Capital. From January 2000 to August 2002, Mr. Griffin was Chief Risk Manager of GEFAHI. Prior thereto, Mr. Griffin was Vice President, Risk Markets & Executive Director, Pension & Insurance with Goldman, Sachs & Co. from August 1994 to December 1999. From December 1986 to August 1994, Mr. Griffin was Executive Director—Fixed Income and Principal, Fixed Income Sales with Morgan Stanley. Prior thereto, Mr. Griffin was an Assistant Actuary with the Metropolitan Life Insurance Company from July 1982 to December 1986. Mr. Griffin received a B.A. in Mathematics from the University of Waterloo. Mr. Griffin is a Fellow of the Society of Actuaries and the Canadian Institute of Actuaries, and is a Chartered Financial Analyst. He holds an FRM, or Financial Risk Manager, designation from the Global Association of Risk Professionals and a PRM, or Professional Risk Manager, designation from the Professional Risk Management International Association.
Michael S. Laming has been our Senior Vice President—Human Resources since the completion of the IPO in May 2004 and prior to the IPO was a Senior Vice President of GE Insurance, a business unit of GE Capital, since August 2001 and a Vice President of GE since April 2003. From July 1996 to August 2001, Mr. Laming was a Senior Vice President at GEFAHI and its predecessor companies. Prior thereto, he held a broad range of human resource positions in operating units of GE and at GE corporate headquarters. He graduated from the GE Manufacturing Management Program. Mr. Laming received both a B.S. in Business Administration and a Masters of Organization Development from Bowling Green State University.
Samuel D. Marsico has been our Senior Vice President—Chief Risk Officer since January 2006. Prior thereto, he was Senior Vice President and Chief Risk Officer for our Mortgage Insurance segment since completion of the IPO in May 2004. From April 2001 to the IPO, he was the Chief Risk Officer for GE Mortgage Insurance. From September 1999 to March 2001, Mr. Marsico held leadership positions in the division’s Marketing and New Markets departments and from August 1997 to August 1999, Mr. Marsico was the Chief Financial Officer of GE Mortgage Insurance. Mr. Marsico also held prior leadership positions at both GE Transportation Systems and GE Corporate Finance. Prior to joining GE, Mr. Marsico was a senior executive at Price Waterhouse in New York, NY. Mr. Marsico is a graduate of Fairfield University with a B.S. in Accounting and is a member of the AICPA.
Scott J. McKay has been our Senior Vice President—Operations & Quality and Chief Information Officer since August 2004. Prior thereto, he was Senior Vice President—Operations & Quality from the completion of the IPO in May 2004 to August 2004. Prior to the IPO, he was the Senior Vice President, Operations & Quality of GEFAHI since December 2002. From July 1993 to December 2002, Mr. McKay served in various information technology related positions at GEFAHI’s subsidiaries, including Chief Technology Officer, and Chief Information Officer of Federal Home Life Assurance Company. Prior thereto, he was Officer and Director of Applications for United Pacific Life Insurance Company from July 1992 to July 1993, and an IT consultant for Sycomm Systems and Data Executives, Inc. from January 1985 to July 1992. Mr. McKay received a B.S. in Computer Science from West Chester University of Pennsylvania.
Victor C. Moses has been our Senior Vice President—Actuarial & Risk since January 2007 and has been serving as Acting Chief Financial Officer since August 2006. Prior thereto and from the completion of the IPO in May 2004, Mr. Moses was our Senior Vice President—Chief Actuary. Prior to the IPO, he was Senior Vice President—Actuarial/Capital Management of GEFAHI since January 2000. From 1971 to 1983 Mr. Moses worked in various positions at SAFECO Life Insurance Company and from 1983 to 1993 he served in various capacities with GNA, ultimately serving as both Chief Actuary and Chief Financial Officer. In 1993, GNA was acquired by GE Capital, and from then until December 1999, Mr. Moses was Senior Vice President—Business Development at GEFAHI and its predecessor companies. Mr. Moses received a B.S. in Math from Seattle Pacific University. Mr. Moses is a Fellow in the Society of Actuaries and a Member of the American Academy of Actuaries. He serves on the Board of Trustees of Seattle Pacific University.
208
Joseph J. Pehota has been our Senior Vice President—Mergers & Acquisitions since January 2007. Prior thereto, he had served as Senior Vice President—Business Development since the completion of the IPO in May 2004, and prior to the IPO, he was Senior Vice President—Business Development of GEFAHI since August 1998. From February 1996 to July 1998, he was the Chief Risk Manager for GE Equity, an affiliate of our company. Prior thereto, Mr. Pehota was Vice President and Manager of Global Distribution for the GE Capital Structured Finance Group, an affiliate of our company, from January 1995 to February 1996. From March to December 1994, he was the Vice President of Restructuring and Underwriting—North America, for GE Capital’s Aviation Services business, an affiliate of our company. Prior thereto, Mr. Pehota held various leadership positions with GE Capital’s Structured Finance Group, an affiliate of our company, from July 1988 to February 1994. Mr. Pehota received a B.S. in Finance from the University of Connecticut and an M.B.A. from New York University.
Jean S. Peters has been our Senior Vice President—Corporate Communications & External Relations since January 2007. Prior thereto and since the completion of the IPO in May 2004, she served as Senior Vice President—Investor Relations and Corporation Communications. From January 1999 to April 2004, she was the Senior Vice President of Investor Relations for John Hancock Financial Services, Inc. From February 1994 to January 1999, Ms. Peters was the Vice President of Investor Relations for Allmerica Financial Corporation. Prior thereto, she was the Second Vice President of Investor Relations from August 1989 to February 1994, and the Assistant Vice President of Corporate Communications from January 1986 to August 1989, for Capital Holding Corporation. From August 1984 to January 1986, Ms. Peters was the Business Editor for the Dayton Daily News and Journal Herald. Prior thereto, from February 1982 to August 1984, she was a business writer for the Louisville Courier-Journal. Ms. Peters received a B.S. in Journalism from Northwestern University. She is a member of the board of the National Investor Relations Institute, Boston Chapter.
Leon E. Roday has been our Senior Vice President, General Counsel and Secretary since the completion of the IPO in May 2004 and prior to the IPO was Senior Vice President, General Counsel, Secretary and a director of GEFAHI and its predecessor companies since May 1996 and a Vice President of GE since November 2002. From October 1982 through May 1996, Mr. Roday was at the law firm of LeBoeuf, Lamb, Greene & MacRae, LLP, and he was a partner at that firm from 1991 to 1996. Mr. Roday received a B.A. in Political Science from the University of California at Santa Barbara and a J.D. from Brooklyn Law School. Mr. Roday is a member of the New York Bar.
Cheryl C. Whaley has been our Senior Vice President—Capital Markets & Growth Ventures since January 2007. Prior thereto, she served as Vice President responsible for Growth Ventures since October 2005. From December 1996 to August 1998, Ms. Whaley was the Senior Vice President of Quality and Business Integration of GE Financial Assurance Holdings, Inc. Subsequent to this position, from May 2000 to July 2001, she served as the President, Chief Executive Officer and Chairperson of the Board of GE Capital Life Assurance Company of New York and American Mayflower Life Insurance Company of New York. From July 2001 to January 2004, Ms. Whaley was the Managing Director and Business Leader, Public Finance at Financial Guaranty Insurance Corporation, where she served on the Board of Directors and Senior Credit Committee. She has also held positions at CS First Boston, Northwest Airlines and Bain & Company. Ms. Whaley graduated as a Durant Scholar, magna cum laude from Wellesley College and holds an M.B.A. from Harvard University.
Frank J. Borelli has served as a member of our board of directors since June 2004. Mr. Borelli has been a Senior Advisor to Stone Point Capital, a former wholly owned subsidiary of Marsh & McLennan Companies, Inc., since his retirement from Marsh & McLennan on January 2001. Prior thereto, he was Senior Vice President of Marsh & McLennan from April to December 2000 and Senior Vice President and Chief Financial Officer from September 1984 to April 2000. He is a director and Audit Committee Chairman of Express Scripts, Inc. and is a director of the Interpublic Group of Companies. He was a Director of Marsh & McLennan from May 1988 to October 2000. Mr. Borelli is past Chairman and Director of Financial Executives International and is also a Trustee of St. Thomas Aquinas College. Mr. Borelli received a B.B.A. in Business Administration from Bernard M. Baruch College, City University of New York.
209
Nancy J. Karch has served as a member of our board of directors since October 2005. Ms. Karch was a Senior Partner of McKinsey & Company, an independent consulting firm, from 1988 until her retirement in 2000. Prior thereto, Ms. Karch served in various executive capacities at McKinsey since 1974. She is a director of Liz Claiborne, Inc., MasterCard Incorporated, and The Corporate Executive Board Company. Ms. Karch is also on the board of the Westchester Land Trust, Northern Westchester Hospital, and the American Folk Art Museum, all not-for-profit organization. Ms. Karch received a B.A. from Cornell University, an M.S. from Northeastern University and an M.B.A. from Harvard Business School.
J. Robert “Bob” Kerrey has served as a member of our board of directors since June 2004. Mr. Kerrey has been the President of New School University since 2001. From January 1989 to December 2000, he was a U.S. Senator for the State of Nebraska. Mr. Kerrey was a democratic candidate for President in 1992. From January 1982 to December 1987, Mr. Kerrey served as Governor of Nebraska. Prior thereto, Mr. Kerrey was an independent businessman and founder of a chain of restaurants and health clubs. Mr. Kerrey served in Vietnam as a Navy SEAL from 1966 to 1969, for which he received the Congressional Medal of Honor. He serves on the boards of Jones Apparel Group, Inc. and Tenet Healthcare Corporation. Mr. Kerrey received a B.S. in Pharmacy from the University of Nebraska.
Saiyid T. Naqvi has served as a member of our board of directors since December 2005. Mr. Naqvi has served as the President of Harley-Davidson Financial Services, Inc. since February 2007. Mr. Naqvi served as the Chief Executive Officer of DeepGreen Financial Inc. from January 2005 to December 2006. From November 2002 until January 2005, he was Chairman and Chief Executive Officer of Setara Corporation. From 1985 until January 2001, Mr. Naqvi was with PNC Mortgage (formerly Sears Mortgage Corporation) and served as President and Chief Executive Officer from 1995 to 2001. Mr. Naqvi also serves on the Zamira Foundation, a not-for-profit organization. Mr. Naqvi received a B.A. from the University of Missouri and an M.B.A. from Southern Illinois University.
James A. Parke has served as a member of our board of directors since the completion of our IPO in May 2004. Mr. Parke retired as Vice Chairman and Chief Financial Officer of GE Capital Services and a Senior Vice President at GE in December 2005. He had served in those positions since 2002. From 1989 to 2002 he was Senior Vice President and Chief Financial Officer at GE Capital Services and a Vice President of GE. Prior thereto, from 1981 to 1989 he held various management positions in several GE businesses. He serves as a director of Building with Books and as a regent of Concordia College. Mr. Parke received a B.A. in History, Political Science and Economics from Concordia College in Minnesota.
James S. Riepe has served as a member of our board of directors since March 2006. Mr. Riepe was the Vice Chairman of T. Rowe Price Group, Inc. from 1997 until his retirement in December 2005. Mr. Riepe also served as a director of the T. Rowe Price Group, Inc. and as Chairman and Director of the T. Rowe Price Funds until April 2006. He held various positions during his tenure at T. Rowe Price Group, Inc., which began in 1982, including serving as Chairman of all of the T. Rowe Price funds on which he served as a director or trustee. Prior thereto, Mr. Riepe was an Executive Vice President of The Vanguard Group. Mr. Riepe serves as a director of the Nasdaq Stock Market, Inc. He is the chairman of the University of Pennsylvania’s Board of Trustees and the T. Rowe Price Program for Charitable Giving. He is also a trustee of the James S. and Gail P. Riepe Charitable Foundation, the Baltimore Museum of Art and the Gilman School. Mr. Riepe received an M.B.A. and a B.S. from the University of Pennsylvania.
Barrett A. Toan has served as a member of our board of directors since July 2006. Mr. Toan was the Chairman of Express Scripts, Inc. from November 2000 until his retirement in May 2006 and the Chief Executive Officer of Express Scripts, Inc. from March 1992 until his retirement in March 2005. Mr. Toan was an executive officer of Express Scripts, Inc. from May 1989 until his retirement and served as the President from October 1990 to April 2002. Prior thereto, he was an Executive Director and Chief Operating Officer of Sanus Health Plan of St. Louis. Mr. Toan continues to serve as a director of Express Scripts, Inc. and is also a director of Sigma-Aldrich Corporation. He also serves as a director on a number of charitable organizations, including the St. Louis Art Museum and the Missouri Botanical Garden. Mr. Toan received an M.P.A. from the Wharton School of Finance and Commerce at the University of Pennsylvania and an A.B. from Kenyon College.
210
Thomas B. Wheeler has served as a member of our board of directors since May 2004. Mr. Wheeler was a member of the Massachusetts Mutual (now known as MassMutual Financial Group) field sales force from May 1962 to June 1983, serving as Agent and General Agent, and served as Executive Vice President of Massachusetts Mutual’s insurance and financial management line from July 1983 to December 1986. He became President and Chief Operating Officer of MassMutual in January 1987, President and Chief Executive Officer of MassMutual in October 1988 and Chairman and Chief Executive Officer of MassMutual in March 1996. He retired as Chief Executive Officer in January 1999 and retired as Chairman in December 2000. Mr. Wheeler is a former director of BankBoston, a director of EstateWorks and a director of Textron, Inc. He is a trustee of the Conservancy of S.W. Florida and the Woods Hole Oceanographic Institution. Mr. Wheeler received a B.A. in American Studies from Yale University.
Other Information
We will provide the remaining information that is responsive to this Item 10 in our definitive proxy statement or in an amendment to this Annual Report not later than 120 days after the end of the fiscal year covered by this Annual Report, in either case under the captions “Election of Directors,” “Corporate Governance,” “Board of Directors and Committees,” “Section 16(a) Beneficial Ownership Reporting Compliance,” and possibly elsewhere therein. That information is incorporated into this Item 10 by reference.
| Item 11. | Executive Compensation |
We will provide information that is responsive to this Item 11 in our definitive proxy statement or in an amendment to this Annual Report not later than 120 days after the end of the fiscal year covered by this Annual Report, in either case under the captions “Board of Directors and Committees,” “Compensation Discussion and Analysis,” “Report of Management Development and Compensation Committee” (which report shall be deemed furnished with this Form 10-K, and shall not be deemed “filed” for purposes of Section 18 of the Securities Exchange Act of 1934, nor shall it be deemed incorporated by reference in any filing under the Securities Act of 1933 or the Securities Exchange Act of 1934), “Executive Compensation,” and possibly elsewhere therein. That information is incorporated into this Item 11 by reference.
| Item 12. | Security Ownership of Certain Beneficial Owners and Management and Related Stockholder Matters |
We will provide information that is responsive to this Item 12 in our definitive proxy statement or in an amendment to this Annual Report not later than 120 days after the end of the fiscal year covered by this Annual Report, in either case under the caption “Information Relating to Directors, Director Nominees, Executive Officers and Significant Stockholders,” “Equity Compensation Plans” and possibly elsewhere therein. That information is incorporated into this Item 12 by reference.
| Item 13. | Certain Relationships and Related Transactions, and Director Independence |
We will provide information that is responsive to this Item 13 in our definitive proxy statement or in an amendment to this Annual Report not later than 120 days after the end of the fiscal year covered by this Annual Report, in either case under the captions “Corporate Governance,” “Certain Relationships and Transactions,” and possibly elsewhere therein. That information is incorporated into this Item 13 by reference.
| Item 14. | Principal Accountant Fees and Services |
We will provide information that is responsive to this Item 14 in our definitive proxy statement or in an amendment to this Annual Report not later than 120 days after the end of the fiscal year covered by this Annual Report, in either case under the caption “Independent Registered Public Accounting Firm,” and possibly elsewhere therein. That information is incorporated into this Item 14 by reference.
211
| Item 15. | Exhibits and Financial Statement Schedules |
a. Documents filed as part of this report.
| 1. Financial Statements (see Item 8. Financial Statements and Supplementary Data) |
||
| Report of KPMG LLP, Independent Registered Public Accounting Firm |
146 | |
| Consolidated Statements of Income for the years ended December 31, 2006, 2005 and 2004 |
147 | |
| Consolidated Balance Sheets as of December 31, 2006 and 2005 |
148 | |
| 149 | ||
| Consolidated Statements Cash Flows for the years ended December 31, 2006, 2005 and 2004 |
150 | |
| 151 | ||
| 2. Financial Statement Schedules |
||
| Report of KPMG LLP, Independent Registered Public Accounting Firm, on Schedules |
221 | |
| Schedule I—Summary of investments—other than investments in related parties |
222 | |
| Schedule II—Financial Statements of Genworth Financial, Inc. (Parent Only) |
223 | |
| 229 | ||
3. Exhibits
| Number | Description | |
| 2.1 | Stock Purchase Agreement, dated as of January 10, 2007, by and between Genworth Financial, Inc. and Sun Life Financial, Inc. (incorporated by reference to Exhibit 2.1 to the Current Report on Form 8-K dated January 12, 2007) | |
| 3.1 | Amended and Restated Certificate of Incorporation of Genworth Financial, Inc. (incorporated by reference to Exhibit 3.1 to the Current Report on Form 8-K dated June 7, 2004) | |
| 3.2 | Amended and Restated Bylaws of Genworth Financial, Inc. (incorporated by reference to Exhibit 3.2 to the Current Report on Form 8-K dated October 20, 2006) | |
| 3.3 | Certificate of Designations for Series A Cumulative Preferred Stock (incorporated by reference to Exhibit 3.3 to the Current Report on Form 8-K dated June 7, 2004) | |
| 4.1 | Specimen Class A Common Stock certificate (incorporated by reference to Exhibit 4.1 to the Registration Statement on Form S-1 (No. 333-112009) (the “Registration Statement”)) | |
| 4.2 | Indenture, dated as of June 26, 2001, between GE Financial Assurance Holdings, Inc. and The Chase Manhattan Bank, as Trustee (incorporated by reference to Exhibit 4.2 to the Registration Statement) | |
| 4.3 | First Supplemental Indenture, dated as of June 26, 2001, among GE Financial Assurance Holdings, Inc., The Chase Manhattan Bank, as Trustee, Paying Agent and Exchange Rate Agent, and The Chase Manhattan Bank, Luxembourg, S.A., as Paying Agent (incorporated by reference to Exhibit 4.3 to the Registration Statement) | |
| 4.4 | Second Supplemental Indenture among GE Financial Assurance Holdings, Inc., Genworth Financial, Inc. and The Bank of New York (formerly JPMorgan Chase Bank ), as Trustee (incorporated by reference to Exhibit 4.4 to the Current Report on Form 8-K dated June 7, 2004) | |
| 4.5 | Indenture, dated as of November 14, 2006, between Genworth Financial, Inc. and The Bank of New York Trust Company, N.A., as Trustee (incorporated by reference to Exhibit 4.1 to the Current Report on Form 8-K dated November 14, 2006) | |
| 4.6 | First Supplemental Indenture, dated as of November 14, 2006, between Genworth Financial, Inc. and The Bank of New York Trust Company, N.A., as Trustee (incorporated by reference to Exhibit 4.2 to the Current Report on Form 8-K dated November 14, 2006) | |
212
| Number | Description | |
| 4.7 | ISDA Master Agreement, dated as of March 2, 2000, between Morgan Stanley Derivative Products Inc. and GE Financial Assurance Holdings, Inc. (incorporated by reference to Exhibit 4.5 to the Registration Statement) | |
| 4.8 | Confirmation Letter, dated as of September 29, 2003, from Morgan Stanley Derivative Products Inc. to GE Financial Assurance Holdings, Inc. (incorporated by reference to Exhibit 4.6 to the Registration Statement) | |
| 4.9 | Indenture between Genworth Financial, Inc. and The Bank of New York, as Trustee (incorporated by reference to Exhibit 4.7 to the Current Report on Form 8-K dated June 7, 2004) | |
| 4.10 | Supplemental Indenture No. 1 between Genworth Financial, Inc. and The Bank of New York, as Trustee (incorporated by reference to Exhibit 4.8 to the Current Report on Form 8-K dated June 7, 2004) | |
| 4.11 | Purchase Contract and Pledge Agreement between Genworth Financial, Inc. and The Bank of New York, as Purchase Contract Agent, Collateral Agent, Custodial Agent and Securities Intermediary (incorporated by reference to Exhibit 4.9 to the Current Report on Form 8-K dated June 7, 2004) | |
| 4.12 | Indenture between Genworth Financial, Inc. and The Bank of New York (formerly JPMorgan Chase Bank), as Trustee (incorporated by reference to Exhibit 4.10 to the Annual Report on Form 10-K for the fiscal year ended December 31, 2004) | |
| 4.13 | Supplemental Indenture No. 1 between Genworth Financial, Inc. and The Bank of New York (formerly JPMorgan Chase Bank), as Trustee (incorporated by reference to Exhibit 4.11 to the Annual Report on Form 10-K for the fiscal year ended December 31, 2004) | |
| 4.14 | Supplemental Indenture No. 2, dated as of September 19, 2005, between Genworth Financial, Inc. and The Bank of New York (formerly JPMorgan Chase Bank, N.A.), as Trustee (incorporated by reference to Exhibit 4.1 to the Current Report on Form 8-K filed September 19, 2005) | |
| 10.1 | Master Agreement among Genworth Financial, Inc., General Electric Company, General Electric Capital Corporation, GEI, Inc. and GE Financial Assurance Holdings, Inc. (incorporated by reference to Exhibit 10.1 to the Current Report on Form 8-K dated June 7, 2004) | |
| 10.1.1 | Amendment No. 1, dated as of March 30, 2005, to the Master Agreement, dated as of May 24, 2004, among Genworth Financial, Inc., GE Financial Assurance Holdings, Inc., General Electric Company, General Electric Capital Corporation and GEI, Inc. (incorporated by reference to Exhibit 10.1 to the Current Report on Form 8-K dated April 4, 2005) | |
| 10.2 | Restated Tax Matters Agreement, dated as of February 1, 2006, by and among General Electric Company, General Electric Capital Corporation, GE Financial Assurance Holdings, Inc., GEI, Inc. and Genworth Financial, Inc. (filed herewith) | |
| 10.3 | Coinsurance Agreement, dated as of April 15, 2004, by and between GE Life and Annuity Assurance Company (now known as Genworth Life and Annuity Insurance Company) and Union Fidelity Life Insurance Company (incorporated by reference to Exhibit 10.11 to the Registration Statement) | |
| 10.4 | Coinsurance Agreement, dated as of April 15, 2004, by and between Federal Home Life Insurance Company (merged with and into Genworth Life and Annuity Insurance Company effective January 1, 2007) and Union Fidelity Life Insurance Company (incorporated by reference to Exhibit 10.12 to the Registration Statement) | |
| 10.5 | Coinsurance Agreement, dated as of April 15, 2004, by and between General Electric Capital Assurance Company (now known as Genworth Life Insurance Company) and Union Fidelity Life Insurance Company (incorporated by reference to Exhibit 10.13 to the Registration Statement) | |
213
| Number | Description | |
| 10.6 | Coinsurance Agreement, dated as of April 15, 2004, by and between GE Capital Life Assurance Company of New York (now known as Genworth Life Insurance Company of New York) and Union Fidelity Life Insurance Company (incorporated by reference to Exhibit 10.14 to the Registration Statement) | |
| 10.7 | Coinsurance Agreement, dated as of April 15, 2004, by and between American Mayflower Life Insurance Company of New York (merged with and into Genworth Life Insurance Company of New York effective January 1, 2007) and Union Fidelity Life Insurance Company (incorporated by reference to Exhibit 10.15 to the Registration Statement) | |
| 10.8 | Retrocession Agreement, dated as of April 15, 2004, by and between General Electric Capital Assurance Company (now known as Genworth Life Insurance Company) and Union Fidelity Life Insurance Company (incorporated by reference to Exhibit 10.16 to the Registration Statement) | |
| 10.9 | Retrocession Agreement, dated as of April 15, 2004 by and between GE Capital Life Assurance Company of New York (now known as Genworth Life Insurance Company of New York) and Union Fidelity Life Insurance Company (incorporated by reference to Exhibit 10.17 to the Registration Statement) | |
| 10.10 | Reinsurance Agreement, dated as of April 15, 2004, by and between GE Life and Annuity Assurance Company (now known as Genworth Life and Annuity Insurance Company) and Union Fidelity Life Insurance Company (incorporated by reference to Exhibit 10.18 to the Registration Statement) | |
| 10.11 | Reinsurance Agreement, dated as of April 15, 2004, by and between GE Capital Life Assurance Company of New York (now known as Genworth Life Insurance Company of New York) and Union Fidelity Life Insurance Company (incorporated by reference to Exhibit 10.19 to the Registration Statement) | |
| 10.12 | Capital Maintenance Agreement, dated as of January 1, 2004, by and between Union Fidelity Life Insurance Company and General Electric Capital Corporation (incorporated by reference to Exhibit 10.21 to the Registration Statement) | |
| 10.13 | Credit Agreement, dated as of April 21, 2005, among Genworth Financial, Inc., the several banks and other financial institutions from time to time parties thereto, Bank of America, N.A. and JPMorgan Chase Bank, N.A., as co-administrative agents, and JPMorgan Chase Bank, N.A., as paying agent. (incorporated by reference to Exhibit 10.1 to the Current Report on Form 8-K dated April 26, 2005) | |
| 10.14 | Amended and Restated Five-Year Credit Agreement, dated as of May 25, 2006, among Genworth Financial, Inc., the several banks and other financial institutions from time to time parties thereto, JPMorgan Chase Bank, N.A. and Bank of America, N.A., as co-administrative agents, and JPMorgan Chase Bank, N.A., as paying agent (incorporated by reference to Exhibit 10.1 to the Current Report on Form 8-K dated May 31, 2006) | |
| 10.15 | Canadian Tax Matters Agreement among General Electric Company, General Electric Capital Corporation, GECMIC Holdings Inc., GE Capital Mortgage Insurance Company (Canada) (now known as Genworth Financial Mortgage Insurance Company Canada) and Genworth Financial, Inc. (incorporated by reference to Exhibit 10.47 to the Current Report on Form 8-K dated June 7, 2004) | |
| 10.16 | Trust Agreement, dated as of April 15, 2004, among Union Fidelity Life Insurance Company, General Electric Capital Assurance Company (now know as Genworth Life Insurance Company) and The Bank of New York (incorporated by reference to Exhibit 10.48 to the Registration Statement) | |
| 10.17 | Trust Agreement, dated as of April 15, 2004, among Union Fidelity Insurance Company, American Mayflower Life Insurance Company of New York (merged with and into Genworth Life Insurance Company of New York, effective January 1, 2007) and The Bank of New York (incorporated by reference to Exhibit 10.49 to the Registration Statement) | |
214
| Number | Description | |
| 10.18 | Trust Agreement, dated as of April 15, 2004, among Union Fidelity Life Insurance Company, GE Life and Annuity Assurance Company (now known as Genworth Life and Annuity Insurance Company) and The Bank of New York (incorporated by reference to Exhibit 10.50 to the Registration Statement) | |
| 10.19 | Trust Agreement, dated as of April 15, 2004, among Federal Home Life Insurance Company (merged with and into Genworth Life and Annuity Insurance Company effective January 1, 2007) and The Bank of New York (incorporated by reference to Exhibit 10.51 to the Registration Statement) | |
| 10.20 | Trust Agreement, dated as of April 15, 2004, among Union Fidelity Life Insurance Company, GE Capital Life Assurance Company of New York (now known as Genworth Life Insurance Company of New York) and The Bank of New York (incorporated by reference to Exhibit 10.52 to the Registration Statement) | |
| 10.21 | Trust Agreement, dated as of April 15, 2004, among Union Fidelity Life Insurance Company, First Colony Life Insurance Company (merged with and into Genworth Life and Annuity Insurance Company effective January 1, 2007) and The Bank of New York (incorporated by reference to Exhibit 10.53 to the Registration Statement) | |
| 10.22 | Coinsurance Agreement, dated as of April 15, 2004, between First Colony Life Insurance Company (merged with and into Genworth Life and Annuity Insurance Company effective January 1, 2007) and Union Fidelity Life Insurance Company (incorporated by reference to Exhibit 10.54 to the Registration Statement) | |
| 10.23§ | 2004 Genworth Financial, Inc. Omnibus Incentive Plan (incorporated by reference to Exhibit 10.56 to the Registration Statement) | |
| 10.23.1§ | Form of Deferred Stock Unit Award Agreement under the 2004 Genworth Financial, Inc. Omnibus Incentive Plan (incorporated by reference to Exhibit 10.56.1 to the Current Report on Form 8-K dated December 30, 2004) | |
| 10.23.2§ | Form of Restricted Stock Unit Award Agreement under the 2004 Genworth Financial, Inc. Omnibus Incentive Plan (incorporated by reference to Exhibit 10.56.2 to the Current Report on Form 8-K dated December 30, 2004) | |
| 10.23.3§ | Form of Stock Option Award Agreement under the 2004 Genworth Financial, Inc. Omnibus Incentive Plan (incorporated by reference to Exhibit 10.56.3 to the Current Report on Form 8-K dated December 30, 2004) | |
| 10.23.4§ | Form of Stock Appreciation Rights Award Agreement under the 2004 Genworth Financial, Inc. Omnibus Incentive Plan (incorporated by reference to Exhibit 10.56.4 to the Current Report on Form 8-K dated December 30, 2004) | |
| 10.23.5§ | Form of Restricted Stock Unit Award Agreement under the 2004 Genworth Financial, Inc. Omnibus Incentive Plan (incorporated by reference to Exhibit 10.1 to the Current Report on Form 8-K filed July 19, 2005) | |
| 10.23.6§ | Sub-Plan under the 2004 Genworth Financial, Inc. Omnibus Incentive Plan: Genworth Financial Canada Stock Savings Plan (incorporated by reference to Exhibit 10.52.6 to the Periodic Report on Form 10-Q for the period ended March 31, 2006) | |
| 10.23.7§ | Sub-Plan under the 2004 Genworth Financial, Inc. Omnibus Incentive Plan: Genworth Financial U.K. Share Incentive Plan (incorporated by reference to Exhibit 10.52.7 to the Periodic Report on Form 10-Q for the period ended September 30, 2006) | |
| 10.24§ | Policy Regarding Personal Use of Non-Commercial Aircraft by Executive Officers (incorporated by reference to Exhibit 10 to the Current Report on Form 8-K filed July 21, 2006) | |
215
| Number | Description | |
| 10.25 | European Tax Matters Agreement among General Electric Company, General Electric Capital Corporation, Financial Assurance Company Limited, Financial Insurance Group Services Ltd., GEFA International Holdings Inc., (now known as Genworth Financial International Holdings, Inc.) Genworth Financial, Inc., GEFA UK Holdings Limited (now known as Genworth Financial European Group Holdings Limited) and other parties thereto (incorporated by reference to Exhibit 10.57 to the Current Report on Form 8-K dated June 7, 2004) | |
| 10.26 | Australian Tax Matters Agreement between Genworth Financial, Inc. and General Electric Capital Corporation (incorporated by reference to Exhibit 10.58 to the Current Report on Form 8-K dated June 7, 2004) | |
| 10.27§ | Genworth Financial, Inc. 2005 Change in Control Plan (incorporated by reference to Exhibit 10.60 to the Current Report on Form 8-K dated February 7, 2005) | |
| 10.28§ | Schedule of base salaries (incorporated by reference to Exhibit 10 to the Current Report on Form 8-K dated March 27, 2006) | |
| 10.29§ | Amended and Restated Genworth Financial, Inc. Retirement and Savings Restoration Plan (filed herewith) | |
| 10.30§ | Amended and Restated Genworth Financial, Inc. Supplemental Executive Retirement Plan (filed herewith) | |
| 10.31§ | Genworth Financial, Inc. Deferred Compensation Plan (incorporated by reference to Exhibit 10.3 to the Current Report on Form 8-K dated July 22, 2005) | |
| 10.32§ | Genworth Financial, Inc. Leadership Life Insurance Plan (incorporated by reference to Exhibit 10.1 to the Current Report on Form 8-K dated September 6, 2005) | |
| 10.33§ | Genworth Financial, Inc. Executive Life Program (incorporated by reference to Exhibit 10.2 to the Current Report on Form 8-K dated September 6, 2005) | |
| 10.34 | Director Compensation Summary (incorporated by reference to Exhibit 10.1 to the Current Report on Form 8-K dated December 5, 2005) | |
| 10.35§ | Form of Restricted Stock Unit Award Agreement under the 2004 Genworth Financial, Inc. Omnibus Incentive Plan—Grants Made on or after December 2, 2005 (incorporated by reference to Exhibit 10.2 to the Current Report on Form 8-K dated December 5, 2005) | |
| 10.36§ | Form of Amended Restricted Stock Unit Award Agreement under the 2004 Genworth Financial, Inc. Omnibus Incentive Plan—Replacement Grants for other than September 2003 Award (incorporated by reference to Exhibit 10.3 to the Current Report on Form 8-K dated December 5, 2005) | |
| 10.37§ | Form of Restricted Stock Unit Award Agreement under the 2004 Genworth Financial, Inc. Omnibus Incentive Plan—Replacement Grants for September 2003 Award (incorporated by reference to Exhibit 10.4 to the Current Report on Form 8-K dated December 5, 2005) | |
| 10.38§ | Separation Agreement & Release, effective February 1, 2007, between Genworth Financial, Inc. and George R. Zippel (filed herewith) | |
| 10.39 | Replacement Capital Covenant, dated November 14, 2006 (incorporated by reference to Exhibit 10.1 to the Current Report on Form 8-K dated November 14, 2006) | |
| 12 | Computation of Ratio of Income to Fixed Charges (filed herewith) | |
| 14 | Genworth Financial, Inc. Code of Ethics (incorporated by reference to Exhibit 14.1 to the Current Report on Form 8-K dated July 22, 2005) | |
| 21 | Subsidiaries of the registrant (filed herewith) | |
| 23 | Consent of KPMG LLP (filed herewith) | |
216
| Number | Description | |
| 24 | Powers of Attorney (filed herewith) | |
| 31.1 | Certification Pursuant to Section 302 of the Sarbanes-Oxley Act of 2002—Michael D. Fraizer (filed herewith) | |
| 31.2 | Certification Pursuant to Section 302 of the Sarbanes-Oxley Act of 2002—Victor C. Moses (filed herewith) | |
| 32.1 | Certification Pursuant to Section 1350 of Chapter 63 of Title 18 of the United States Code—Michael D. Fraizer (filed herewith) | |
| 32.2 | Certification Pursuant to Section 1350 of Chapter 63 of Title 18 of the United States Code—Victor C. Moses (filed herewith) | |
| § | Management contract or compensatory plan or arrangement. |
Neither Genworth Financial, Inc., nor any of its consolidated subsidiaries, has outstanding any instrument with respect to its long-term debt, other than those filed as an exhibit to this Annual Report, under which the total amount of securities authorized exceeds 10% of the total assets of Genworth Financial, Inc. and its subsidiaries on a consolidated basis. Genworth Financial, Inc. hereby agrees to furnish to the Securities and Exchange Commission, upon request, a copy of each instrument that defines the rights of holders of such long-term debt that is not filed or incorporated by reference as an exhibit to this Annual Report.
Genworth Financial, Inc. will furnish any exhibit upon the payment of a reasonable fee, which fee shall be limited to Genworth Financial, Inc.’s reasonable expenses in furnishing such exhibit.
217
SIGNATURES
Pursuant to the requirements of Section 13 or 15(d) of the Securities Exchange Act of 1934, the registrant has duly caused this report to be signed on its behalf by the undersigned, thereunto duly authorized.
Dated: February 28, 2007
| GENWORTH FINANCIAL, INC. | ||
| By: | /s/ MICHAEL D. FRAIZER | |
| Name: | Michael D. Fraizer | |
| Title: | Chairman of the Board, President and Chief Executive Officer (Principal Executive Officer) | |
Pursuant to the requirements of the Securities Exchange Act of 1934, this report has been signed below by the following persons on behalf of the registrant and in the capacities and on the date indicated.
Dated: February 28, 2007
| /s/ MICHAEL D. FRAIZER Michael D. Fraizer |
Chairman of the Board, President and Chief Executive Officer (Principal Executive Officer) | |
| /s/ VICTOR C. MOSES Victor C. Moses |
Senior Vice President—Actuarial & Risk; Acting Chief Financial Officer (Principal Financial Officer) | |
| /s/ SCOTT R. LINDQUIST Scott R. Lindquist |
Vice President and Controller (Principal Accounting Officer) | |
| * Frank J. Borelli |
Director | |
| * Nancy J. Karch |
Director | |
| * J. Robert Kerrey |
Director | |
| * Saiyid T. Naqvi |
Director | |
| * James A. Parke |
Director | |
| * James S. Riepe |
Director | |
| * Barrett A. Toan |
Director | |
| * Thomas B. Wheeler |
Director | |
| *By | /s/ MICHAEL D. FRAIZER | |
| Michael D. Fraizer Attorney-in-Fact |
218
Report of Independent Registered Public Accounting Firm
The Board of Directors and Stockholders
Genworth Financial, Inc.:
Under the date of February 28, 2007, we reported on the consolidated balance sheets of Genworth Financial, Inc. (the Company) as of December 31, 2006 and 2005, and the related consolidated statements of income, changes in stockholders’ equity, and cash flows for each of the years in the three-year period ended December 31, 2006, which are included herein. In connection with our audits of the aforementioned consolidated financial statements, we also audited the related financial statement schedules included herein. These consolidated financial statement schedules are the responsibility of the Company’s management. Our responsibility is to express an opinion on these financial statement schedules based on our audits.
In our opinion, such financial statement schedules, when considered in relation to the basic consolidated financial statements taken as a whole, present fairly, in all material respects, the information set forth therein.
As discussed in note 2 to the consolidated financial statements, the Company changed its method of accounting for share-based payments and pension and other postretirement plan obligations in 2006, and certain nontraditional long-duration contracts and separate accounts in 2004.
/s/ KPMG LLP
Richmond, Virginia
February 28, 2007
219
Genworth Financial, Inc.
Summary of investments—other than investments in related parties
(Amounts in millions)
As of December 31, 2006, the amortized cost or cost, estimated fair value and carrying value of our invested assets were as follows:
| Type of investment |
Amortized cost or cost |
Estimated fair value |
Carrying value | ||||||
| Fixed maturities: |
|||||||||
| Bonds: |
|||||||||
| U.S. government, agencies and authorities |
$ | 873 | $ | 888 | $ | 888 | |||
| Tax exempt |
2,126 | 2,231 | 2,231 | ||||||
| Government—non U.S. |
1,688 | 1,765 | 1,765 | ||||||
| Public utilities |
2,766 | 2,813 | 2,813 | ||||||
| All other corporate bonds |
47,376 | 47,751 | 47,751 | ||||||
| Total fixed maturities |
54,829 | 55,448 | 55,448 | ||||||
| Equity securities |
171 | 197 | 197 | ||||||
| Commercial mortgage loans |
8,491 | xxxxx | 8,491 | ||||||
| Policy loans |
1,494 | xxxxx | 1,494 | ||||||
| Other invested assets(1) |
3,322 | xxxxx | 3,846 | ||||||
| Total investments |
$ | 68,307 | xxxxx | $ | 69,476 | ||||
| (1) | The amount shown in the Consolidated Balance Sheets for other invested assets differs from cost as other invested assets includes derivatives, which are reported at estimated fair value. |
See Accompanying Report of Independent Registered Public Accounting Firm.
220
Genworth Financial, Inc.
(Parent Company Only)
Statements of Income
(Amounts in millions)
| Years ended December 31, | ||||||||||||
| 2006 | 2005 | 2004 | ||||||||||
| Revenues: |
||||||||||||
| Gain on outsourcing services agreement |
$ | — | $ | — | $ | 40 | ||||||
| Net investment and other income |
17 | 13 | 1 | |||||||||
| Net investment gains (losses) |
(6 | ) | — | — | ||||||||
| Total revenues |
11 | 13 | 41 | |||||||||
| Benefits and expenses: |
||||||||||||
| Operating expenses |
2 | 50 | 37 | |||||||||
| Amortization of intangibles |
1 | 2 | 2 | |||||||||
| Interest expense |
245 | 222 | 119 | |||||||||
| Total benefits and expenses |
248 | 274 | 158 | |||||||||
| Loss before income taxes and equity in income of subsidiaries |
(237 | ) | (261 | ) | (117 | ) | ||||||
| Benefit for income taxes |
(94 | ) | (100 | ) | (194 | ) | ||||||
| Equity in income of subsidiaries |
1,467 | 1,382 | 632 | |||||||||
| Cumulative effect of accounting change |
4 | — | — | |||||||||
| Net income |
$ | 1,328 | $ | 1,221 | $ | 709 | ||||||
See Notes to Schedule II
See Accompanying Report of Independent Registered Public Accounting Firm
221
Schedule II
Genworth Financial, Inc.
(Parent Company Only)
Balance Sheets
(Amounts in millions)
| December 31, | ||||||
| 2006 | 2005 | |||||
| Assets |
||||||
| Investments: |
||||||
| Fixed maturities available-for-sale, at fair value |
$ | 28 | $ | 145 | ||
| Investment in subsidiaries |
17,632 | 16,720 | ||||
| Other invested assets |
5 | 19 | ||||
| Total investments |
17,665 | 16,884 | ||||
| Cash and cash equivalents |
84 | 332 | ||||
| Accrued investment income |
— | 1 | ||||
| Intangible assets |
1 | 2 | ||||
| Deferred tax asset |
118 | 119 | ||||
| Tax receivable from subsidiaries |
440 | 452 | ||||
| Other assets |
40 | 13 | ||||
| Total assets |
$ | 18,348 | $ | 17,803 | ||
| Liabilities and stockholders’ equity |
||||||
| Liabilities: |
||||||
| Tax payable to GE |
$ | 380 | $ | 379 | ||
| Other liabilities |
185 | 293 | ||||
| Borrowings from subsidiaries |
233 | 233 | ||||
| Short-term borrowings |
199 | 152 | ||||
| Long-term borrowings |
3,321 | 2,736 | ||||
| Senior notes underlying equity units |
600 | 600 | ||||
| Mandatorily redeemable preferred stock |
100 | 100 | ||||
| Total liabilities |
5,018 | 4,493 | ||||
| Commitments and contingencies |
||||||
| Total stockholders’ equity |
13,330 | 13,310 | ||||
| Total liabilities and stockholders’ equity |
$ | 18,348 | $ | 17,803 | ||
See Notes to Schedule II
See Accompanying Report of Independent Registered Public Accounting Firm
222
Schedule II
Genworth Financial, Inc.
(Parent Company Only)
Statements of Cash Flows
(Amounts in millions)
| Years ended December 31, | ||||||||||||
| 2006 | 2005 | 2004 | ||||||||||
| Cash flows from operating activities: |
||||||||||||
| Net income |
$ | 1,328 | $ | 1,221 | $ | 709 | ||||||
| Adjustments to reconcile net income to net cash provided by operating activities: |
||||||||||||
| Equity in income from subsidiaries |
(1,467 | ) | (1,382 | ) | (632 | ) | ||||||
| Dividends from subsidiaries |
634 | 788 | 590 | |||||||||
| Amortization of intangibles |
1 | 2 | 2 | |||||||||
| Amortization of investment premiums |
2 | 4 | — | |||||||||
| Deferred income taxes |
(1 | ) | — | (126 | ) | |||||||
| Corporate overhead allocation |
— | — | 14 | |||||||||
| Cumulative effect of accounting changes, net of tax |
(4 | ) | — | — | ||||||||
| Change in certain assets and liabilities: |
||||||||||||
| Accrued investment income and other assets |
(15 | ) | 10 | (10 | ) | |||||||
| Other liabilities and other policy-related balances |
(98 | ) | 205 | 153 | ||||||||
| Net cash from operating activities |
380 | 848 | 700 | |||||||||
| Cash flows from investing activities: |
||||||||||||
| Proceeds from fixed maturities |
117 | 49 | — | |||||||||
| Purchases of fixed maturities |
— | (1 | ) | — | ||||||||
| Payments for business purchased net of cash acquired |
(223 | ) | — | — | ||||||||
| Capital contribution paid to subsidiaries |
(74 | ) | — | (72 | ) | |||||||
| Net cash from investing activities |
(180 | ) | 48 | (72 | ) | |||||||
| Cash flows from financing activities: |
||||||||||||
| Payment of contingent note |
— | — | (550 | ) | ||||||||
| Short-term borrowings and other, net |
47 | (407 | ) | (1,841 | ) | |||||||
| Proceeds from long-term borrowings and other |
598 | 348 | 1,895 | |||||||||
| Capital contributions received from stockholder |
3 | 23 | — | |||||||||
| Stock-based compensation awards exercised |
49 | — | — | |||||||||
| Acquisition of treasury stock |
(1,000 | ) | (500 | ) | — | |||||||
| Dividend paid to stockholders |
(145 | ) | (128 | ) | (32 | ) | ||||||
| Net cash from financing activities |
(448 | ) | (664 | ) | (528 | ) | ||||||
| Net change in cash and cash equivalents |
(248 | ) | 232 | 100 | ||||||||
| Cash and cash equivalents at beginning of year |
332 | 100 | — | |||||||||
| Cash and cash equivalents at end of year |
$ | 84 | $ | 332 | $ | 100 | ||||||
See Notes to Schedule II
See Accompanying Report of Independent Registered Public Accounting Firm
223
Schedule II
Genworth Financial, Inc.
(Parent Company Only)
Notes to Schedule II
Years Ended December 31, 2006, 2005 and 2004
1. Organization and Purpose
Genworth Financial, Inc. (“Genworth”) was incorporated in Delaware on October 23, 2003. In connection with its corporate formation, Genworth issued 1,000 shares of common stock for $1,000 to GE Financial Assurance Holdings, Inc. (“GEFAHI”), an indirect subsidiary of General Electric Company (“GE”).
Genworth was organized in preparation for the corporate formation of certain insurance and related subsidiaries of GE and an initial public offering of Genworth common stock. Genworth acquired substantially all of the assets and liabilities of GEFAHI, a holding company for a group of companies that provide annuities and other investment products, life insurance, long-term care insurance, group life and health insurance and mortgage insurance. Genworth also acquired certain other insurance businesses owned by other GE subsidiaries and entered into several significant reinsurance transactions with an affiliate of GE.
2. Borrowings and Commitments
All of the consolidated borrowings of Genworth and its consolidated subsidiaries are borrowings of the Parent, except as indicated below.
On April 3, 2000, GEFAHI issued to a subsidiary a senior unsecured note with a principal amount of $233 million with an interest rate of 7.85% maturing on November 30, 2010. As part of our corporate formation, the note was assumed by Genworth. This note is eliminated in consolidation.
We have issued $2,765 million of non-recourse funding obligations in connection with our capital management strategy related to our term and universal life insurance business. These are the obligations of the River Lake and Rivermont Life Insurance Companies, which are wholly owned, special purpose consolidated captive insurance subsidiaries.
In addition to the guarantees discussed in notes 19, 20 and 23 to our consolidated financial statements, we have provided liquidity support to some of our insurance subsidiaries in the form of guarantees of certain (primarily insurance) obligations, in some cases subject to annual scheduled adjustments, totaling $325 million and $418 million as of December 31, 2006 and 2005, respectively. The majority of these obligations are backed by assets held in our insurance subsidiaries which we believe sufficiently cover the underlying obligations.
We have provided a limited guarantee to Rivermont Insurance Company (“Rivermont I”), an indirect subsidiary, which is accounted for as a derivative under SFAS No. 133 and carried at fair value. This derivative does not qualify for hedge accounting and therefore changes in fair value are reported in net investment gains (losses) in the income statement. As of December 31, 2006, the fair value of this derivative was $15 million and was recorded in other liabilities. For the year ended December 31, 2006, the effect on pre-tax income was $(6) million.
In connection with the issuance of non-recourse funding obligations by Rivermont I, Genworth entered into a liquidity commitment agreement with the third-party trusts in which the floating rate notes have been deposited. The liquidity agreement requires that Genworth issue to the trusts either a loan or a letter of credit (“LOC”), at maturity of the notes (2050), in the amount equal to the then market value of the assets held in the trust. Any loan or LOC issued is an obligation of the trust and shall accrue interest at LIBOR plus a margin. In consideration for entering into this agreement, Genworth received, from Rivermont I, a one-time commitment fee of approximately $2 million. The maximum potential amount of future obligation under this agreement is approximately $95 million.
224
Schedule II
Genworth Financial, Inc.
(Parent Company Only)
Notes to Schedule II—(Continued)
3. Supplemental Cash Flow Information
The following table details other non-cash items:
| Year ended December 31, | |||||||||
| (Amounts in millions) |
2006 | 2005 | 2004 | ||||||
| Excluded net assets: |
|||||||||
| Net assets acquired in connection with our corporate formation |
$ | — | $ | — | $ | 15,948 | |||
| Other non-cash transactions in connection with our corporate formation: |
|||||||||
| Issuance of senior notes underlying equity units |
$ | — | $ | — | $ | 600 | |||
| Issuance of Series A preferred stock |
— | — | 100 | ||||||
| Issuance of contingent note |
— | — | 550 | ||||||
| Issuance of short-term note |
— | — | 2,400 | ||||||
| Total other non-cash transactions in connection with our corporate formation |
$ | — | $ | — | $ | 3,650 | |||
| Non-cash transactions subsequent to our corporate formation |
|||||||||
| Dividend from subsidiary |
$ | — | $ | 50 | $ | 151 | |||
| Stock-based compensation |
41 | 50 | 29 | ||||||
| Dividends declared not yet paid |
40 | 35 | 32 | ||||||
| Total non-cash transactions subsequent to our corporate formation |
$ | 81 | $ | 135 | $ | 212 | |||
4. Income Taxes
Under the Tax Matters Agreement, Genworth is obligated to pay GE, over approximately 16 years, on an after-tax basis and subject to a cap of $640 million, 80% of the tax savings associated with the section 338 deductions. We have recorded on our Genworth Consolidated Balance Sheets, at $656 million and $659 million, our estimate of the deferred tax benefits (reducing net deferred income tax liabilities) associated with these deductions as of December 31, 2006 and December 31, 2005, respectively.
As of December 31, 2006, Genworth also holds assets of $550 million in respect of the tax elections, comprised of a $110 million deferred tax assets and $440 million receivable from its subsidiaries pursuant to the tax allocation agreements. The remaining $8 million of net deferred tax assets as of December 31, 2006 are primarily comprised of nonqualified stock options and unrealized gains on derivatives. As of December 31, 2005, Genworth held assets of $571 million in respect of the tax elections, comprised of a $119 million deferred tax asset and $452 million receivable from its subsidiaries pursuant to the tax allocation agreements. These amounts are undiscounted pursuant to the applicable rules governing deferred taxes and intercompany liabilities.
225
Genworth Financial, Inc.
Supplemental Insurance Information
(Amounts in millions)
| Segment |
Deferred Acquisition Costs |
Future Annuity and Contract Benefits & Liability for Policy and Contract Claims |
Unearned Premiums |
Other Policyholder Liabilities |
Premium Revenue | ||||||||||
| December 31, 2006 |
|||||||||||||||
| Protection |
$ | 5,188 | $ | 22,090 | $ | 1,895 | $ | 103 | $ | 4,594 | |||||
| Retirement Income and Investments |
970 | 45,157 | — | 307 | 736 | ||||||||||
| Mortgage Insurance |
167 | 427 | 2,334 | 27 | 1,132 | ||||||||||
| Affinity |
— | — | — | — | — | ||||||||||
| Corporate and Other |
— | 4 | 2 | 4 | 25 | ||||||||||
| Total |
$ | 6,325 | $ | 67,678 | $ | 4,231 | $ | 441 | $ | 6,487 | |||||
| December 31, 2005 |
|||||||||||||||
| Protection |
$ | 4,569 | $ | 20,526 | $ | 1,741 | $ | 100 | $ | 4,521 | |||||
| Retirement Income and Investments |
882 | 46,240 | — | 353 | 855 | ||||||||||
| Mortgage Insurance |
131 | 330 | 1,870 | 50 | 882 | ||||||||||
| Affinity |
— | — | — | — | — | ||||||||||
| Corporate and Other |
4 | 17 | 36 | 4 | 39 | ||||||||||
| Total |
$ | 5,586 | $ | 67,113 | $ | 3,647 | $ | 507 | $ | 6,297 | |||||
| December 31, 2004 |
|||||||||||||||
| Protection |
$ | 4,527 | |||||||||||||
| Retirement Income and Investments |
1,094 | ||||||||||||||
| Mortgage Insurance |
800 | ||||||||||||||
| Affinity |
88 | ||||||||||||||
| Corporate and Other |
50 | ||||||||||||||
| Total |
$ | 6,559 | |||||||||||||
See Accompanying Report of Independent Registered Public Accounting Firm.
226
Genworth Financial, Inc.
Supplemental Insurance Information
(Amounts in millions)
| Segment |
Net Investment Income |
Interest Credited & Benefits and Other Changes in Policy Reserves |
Amortization Deferred |
Other Operating Expenses |
Premiums Written | ||||||||||
| December 31, 2006 |
|||||||||||||||
| Protection |
$ | 1,482 | $ | 3,559 | $ | 402 | $ | 1,566 | $ | 4,716 | |||||
| Retirement Income and Investments |
1,915 | 2,153 | 162 | 331 | 735 | ||||||||||
| Mortgage Insurance |
341 | 293 | 55 | 302 | 1,534 | ||||||||||
| Affinity |
— | — | — | — | — | ||||||||||
| Corporate and Other |
99 | 2 | — | 286 | 21 | ||||||||||
| Total |
$ | 3,837 | $ | 6,007 | $ | 619 | $ | 2,485 | $ | 7,006 | |||||
| December 31, 2005 |
|||||||||||||||
| Protection |
$ | 1,287 | $ | 3,295 | $ | 510 | $ | 1,489 | $ | 4,378 | |||||
| Retirement Income and Investments |
1,813 | 2,167 | 121 | 272 | 857 | ||||||||||
| Mortgage Insurance |
287 | 162 | 50 | 295 | 1,164 | ||||||||||
| Affinity |
— | — | — | — | — | ||||||||||
| Corporate and Other |
149 | 6 | 1 | 338 | 18 | ||||||||||
| Total |
$ | 3,536 | $ | 5,630 | $ | 682 | $ | 2,394 | $ | 6,417 | |||||
| December 31, 2004 |
|||||||||||||||
| Protection |
$ | 1,226 | $ | 3,282 | $ | 690 | $ | 1,308 | $ | 3,909 | |||||
| Retirement Income and Investments |
1,996 | 2,703 | 144 | 277 | 1,094 | ||||||||||
| Mortgage Insurance |
254 | 165 | 41 | 272 | 1,073 | ||||||||||
| Affinity |
26 | 80 | 35 | 135 | 85 | ||||||||||
| Corporate and Other |
146 | 6 | 1 | 280 | 33 | ||||||||||
| Total |
$ | 3,648 | $ | 6,236 | $ | 911 | 2,272 | $ | 6,194 | ||||||
See Accompanying Report of Independent Registered Public Accounting Firm.
227